
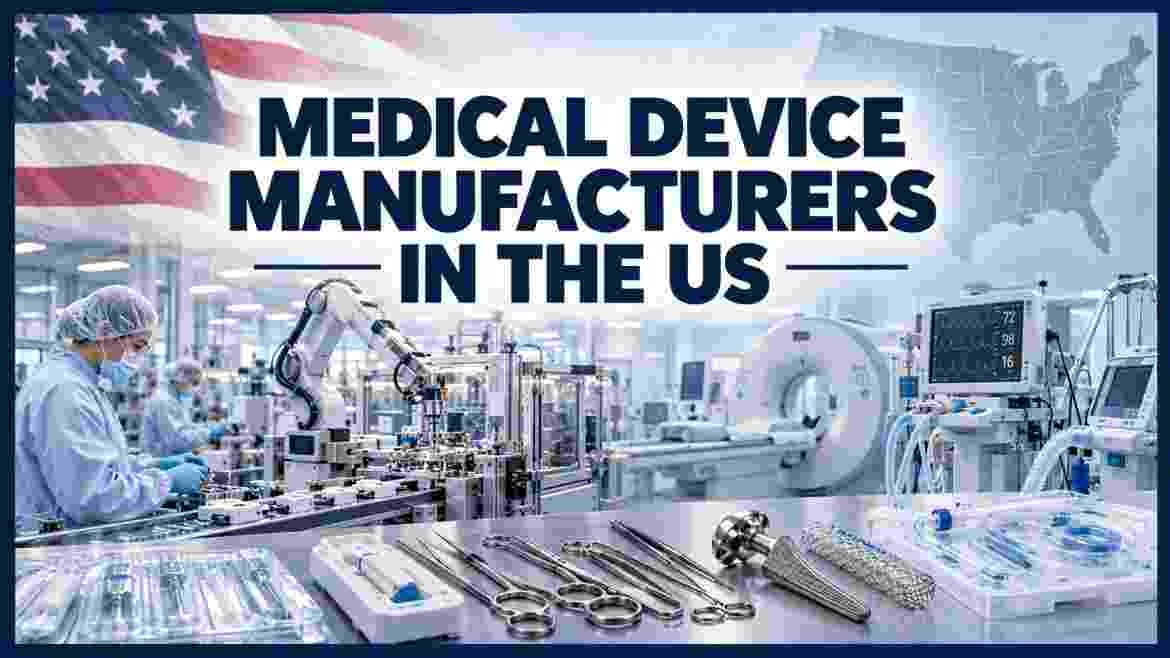
Medtronic leads US medical device manufacturers in 2026 with $36.4 billion in revenue, followed by Johnson & Johnson MedTech at $33.8 billion and Abbott at $30.3 billion. The top 10 companies generate a combined $264 billion, roughly 40% of the entire global medical technology market, even as 62% of devices sold in the US are still imported.
Medical Device Manufacturers in America 2026
Medical device manufacturers headquartered in the United States dominate an industry that touches nearly every corner of modern healthcare, from pacemakers and insulin pumps to surgical robots and diagnostic imaging systems. Eight of the world’s ten largest medical technology companies by revenue are American, and the US alone accounts for roughly 40% of the entire global medtech market, a concentration of scale and capital that few other manufacturing sectors can match.
That dominance sits alongside a structural weak point the industry has only recently started addressing seriously: the majority of devices sold in the US still arrive from overseas factories, a dependency that 2026’s tariff environment has turned into a genuine cost and supply-chain problem rather than a background fact. This report breaks down who the largest US medical device manufacturers actually are, how big the market is by several different measures, what FDA approval data shows about the pace of new device clearances, and how tariffs and reshoring are reshaping where these devices actually get built. Every figure below comes from company financial disclosures, the FDA, the Bureau of Labor Statistics, or named industry analysis, not from independent estimates.
That tension between headquarters strength and manufacturing dependency runs through nearly every section of this report. A company can be an unambiguous American industry leader by revenue, market capitalization, and R&D investment while still building the physical products in facilities located well outside US borders, and 2026 is the first year in which tariff policy, FDA inspection changes, and reshoring incentives have converged to put genuine pressure on that arrangement simultaneously, rather than any single policy lever acting in isolation.
Interesting Facts About Medical Device Manufacturers in 2026
TOP 5 US MEDICAL DEVICE MANUFACTURERS BY REVENUE, 2026 ($ billions)
Medtronic                  ████████████████████████████████████ $36.4B
Johnson & Johnson MedTech  ██████████████████████████████████ $33.8B
Abbott                     ██████████████████████████████ $30.3B
Medline Industries         ████████████████████████████ $28.4B
Stryker                    █████████████████████████ $25.1B
| Fact | Detail |
|---|---|
| Largest US medical device manufacturer, 2026 | Medtronic, $36.4 billion revenue |
| Top 10 companies’ combined revenue | ~$264 billion |
| US share of the global medtech market | ~40% |
| Global medical devices market size, 2025 | $570 billion+ |
| US medical devices imported, 2024 | $75 billion+ |
| Share of US devices that are imported | ~62% |
| FDA 510(k) clearances, 2025 | 3,238 |
| FDA original PMA approvals, 2025 | 41 |
Source: GetReskilled Top 15 Medical Device Companies, 2026; BusinessStats medical technology revenue rankings, 2026; BMP Medical reshoring analysis, September 2026; FDA CDRH data via Emergo/UL compilation.
Medtronic holds the top spot among US medical device manufacturers with $36.4 billion in 2026 revenue, narrowly ahead of Johnson & Johnson MedTech at $33.8 billion and Abbott at $30.3 billion. Together, the top 10 companies, which also include Medline Industries, Stryker, Becton Dickinson, GE HealthCare, Boston Scientific, Baxter, and Zimmer Biomet or Edwards Lifesciences depending on the exact ranking used, generate a combined $264 billion, accounting for roughly 40% of the entire global medical technology market on their own.
That scale coexists with a surprising import dependency: despite housing the industry’s largest manufacturers, the US still imported more than $75 billion in medical devices and supplies in 2024, and roughly 62% of devices sold domestically are imported, with an estimated 70% manufactured entirely outside the country. That gap, massive domestic industry leadership paired with heavy reliance on offshore production for actual device assembly, is the central tension running through the rest of this report.
Top Medical Device Companies by Revenue in 2026
US MEDTECH REVENUE RANKING, 2026 ($ billions)
Medtronic                      ████████████████████████████████████ $36.4B
J&J MedTech                    ██████████████████████████████████ $33.8B
Abbott                         ██████████████████████████████ $30.3B
Medline Industries             ████████████████████████████ $28.4B
Siemens Healthineers           ███████████████████████████ $27.0B
Stryker                        █████████████████████████ $25.1B
| Rank | Company | 2026 Revenue | Primary Focus |
|---|---|---|---|
| 1 | Medtronic | $36.4 billion | Cardiovascular, neuroscience, surgical, diabetes |
| 2 | Johnson & Johnson MedTech | $33.8 billion | Orthopedics, surgery, cardiovascular, vision |
| 3 | Abbott | $30.3 billion | Cardiovascular, diagnostics, diabetes care |
| 4 | Medline Industries | $28.4 billion | Medical supplies, distribution |
| 5 | Siemens Healthineers (Germany) | $27.0 billion | Imaging, diagnostics |
| 6 | Stryker | $25.1 billion | Orthopedics, neurotechnology, MedSurg |
Source: GetReskilled, “Top 15 Medical Device Companies for 2026”; BusinessStats medical technology revenue rankings, 2026.
Stryker’s climb to $25.1 billion in 2025 revenue, a roughly 10% increase over the prior year, ranks among the strongest growth rates of any large-cap device maker, driven heavily by its Mako robotic-assisted surgery platform gaining share in orthopedic procedures. Abbott’s medical devices segment specifically grew 12.7% organically in 2025, marking 12 consecutive quarters of double-digit growth, a streak that has made its diabetes-monitoring and cardiovascular device lines among the fastest-growing product categories in the entire industry.
Revenue figures for these companies vary somewhat depending on whether a source reports total company revenue, a medical-device-specific segment, or a product-line subset, since several of these firms, most notably Johnson & Johnson and Abbott, operate pharmaceutical or nutritional businesses alongside their device operations. Readers comparing rankings across different publications should check whether the figures reflect total company revenue or device-segment revenue specifically, since the two can differ by billions of dollars for the same company in the same year. For how these device makers’ products factor into specific patient outcomes, the hip replacement statistics report tracks Stryker’s Mako robotic platform and other device-driven procedure trends in detail.
Medline Industries’ position at number four is itself a useful reminder that the largest companies by revenue in this space aren’t always the most recognizable device innovators. Medline operates primarily as a manufacturer and distributor of medical supplies, exam gloves, wound care products, incontinence supplies, and similar high-volume consumables, rather than the complex implantable or capital-equipment devices associated with companies like Medtronic or Stryker, yet its sheer distribution scale across hospitals and care facilities nationwide puts its revenue on par with far more technologically specialized competitors.
US Medical Device Market Size Statistics in 2026
US MEDICAL DEVICE MARKET SIZE ESTIMATES, 2026 ($ billions, by source/methodology)
MDMA/AdvaMed estimate           ██████████████████  $175-200B
Precedence Research estimate    ████████████████████  $203B
Mordor Intelligence estimate ██████████████████████████████████████ $377.72B| Market Size Estimate | Figure | Source / Scope |
|---|---|---|
| MDMA/AdvaMed estimate, 2026 | $175-200 billion | Core device manufacturing market |
| Precedence Research estimate, 2026 | $203 billion | Narrower device-only definition |
| Mordor Intelligence estimate, 2026 | $377.72 billion | Broader “manufacturers market” incl. distribution |
| Projected 2031 market (Mordor) | $510.26 billion | 6.20% CAGR |
| Global medical devices market, 2025 | $570 billion+ | All countries combined |
Source: Mordor Intelligence, “US Medical Device Manufacturers Market,” 2026; BioNixus Medical Device Companies USA report, 2026; MedDeviceGuide market analysis, 2026.
Market-size estimates for the US medical device industry vary dramatically depending on methodology, a spread worth understanding rather than treating any single figure as definitive. MDMA (the Medical Device Manufacturers Association) and AdvaMed, the industry’s two leading trade groups, put the core 2026 market at $175 billion to $200 billion, a figure focused specifically on device manufacturing output. Mordor Intelligence’s considerably larger $377.72 billion estimate reflects a broader definition of the “medical device manufacturers market” that likely incorporates distribution and supply-chain revenue alongside pure manufacturing output, explaining why it sits nearly double the trade-association figures.
Regardless of which specific figure is used, every major estimate agrees on the underlying growth trajectory: a compound annual growth rate in the range of 6%, driven by an aging population, expanding robotic surgery adoption, continuous glucose monitoring growth, and structural heart procedure volume. At that pace, even the more conservative $200 billion estimate would approach $270 billion by 2031, while Mordor’s broader measure projects the market reaching $510.26 billion over the same period. Anyone citing a single US medical device market figure in isolation should specify which estimate they’re using and from which source, since headline comparisons between, say, this year’s $203 billion Precedence Research figure and a prior year’s Mordor Intelligence number would compare two fundamentally different measurements rather than tracking genuine year-over-year market growth.
FDA Medical Device Approval Statistics in 2026
FDA DEVICE DECISIONS, TRAILING 12 MONTHS (as of Oct 2026)
510(k) clearances        ████████████████████████████████ 3,191
Original PMA approvals   █  44
| FDA Metric | 2025 (full year) | Trailing 12 months (Oct 2026) |
|---|---|---|
| 510(k) clearances | 3,238 | 3,191 |
| Original PMA approvals | 41 | 44 |
| Total major device decisions | ~3,279 | 3,235 |
| AI/ML-enabled device clearances, 2025 | 295 | — |
| Unique manufacturers receiving AI/ML clearances, 2025 | 221 | — |
| Total annual submissions, all types (FY2024) | ~20,700 | — |
Source: FDA CDRH data compiled by Emergo/UL and Intuition Labs; meddevicestartups.com FDA clearance tracker (sourced via openFDA), October 2026; Innolitics AI/ML 510(k) roundup, 2025.
The FDA cleared 3,238 devices through the standard 510(k) pathway in 2025, alongside 41 original PMA approvals, the agency’s most rigorous device review track reserved for higher-risk Class III devices. 510(k) clearances have held in a remarkably narrow band over the past four years, ranging from 3,107 to 3,326 annually between 2022 and 2025, suggesting the agency’s device-review capacity and submission volume have reached something close to a steady state rather than growing or shrinking sharply year to year.
Artificial intelligence and machine learning-enabled devices represented one of the clearest growth areas within that otherwise stable total: the FDA cleared 295 AI/ML devices in 2025 alone, spanning 221 unique manufacturers, with roughly 62% classified as Software as a Medical Device (SaMD) and 63% serving diagnostic rather than therapeutic functions. That AI/ML clearance pace, which saw 15 separate software clearances land in just nine days during one stretch of December 2025, illustrates how concentrated recent device innovation has become around software and algorithmic tools layered onto existing hardware platforms rather than entirely new physical devices. The trailing-12-month tracker data through October 2026 shows month-to-month volume bouncing between roughly 200 and 320 total decisions, a cadence that reflects both normal submission-cycle timing and the periodic effect of government shutdowns or administrative disruptions on FDA review throughput, rather than any sustained acceleration or slowdown in the agency’s overall device-review capacity.
Medical Device Manufacturing Employment Statistics in 2026
MEDICAL EQUIPMENT & SUPPLIES MANUFACTURING EMPLOYMENT (NAICS 3391)
2021     ████████████████████████████████ 329,000
2023     ██████████████████████████████████ 340,100
2025     ████████████████████████████████ 329,700
| Employment Metric | Figure |
|---|---|
| NAICS 3391 employment, 2025 | 329,700 |
| NAICS 3391 employment, 2023 (prior peak) | 340,100 |
| Narrower NAICS 33911a subsector, 2026 estimate | 304,700 |
| US medical device companies (total, all sizes) | ~6,500 |
| Majority-foreign-owned-company jobs in NAICS 3391 (2019) | 107,200 |
| Manufacturing sector total employer compensation, Q2 2026 | $46.89/hour |
Source: US Bureau of Labor Statistics via FRED (IPUEN3391W200000000); IBISWorld Medical Instrument & Supply Manufacturing report, March 2026; US Department of Commerce medical devices industry overview.
Direct employment in Medical Equipment and Supplies Manufacturing (NAICS 3391) stood at 329,700 workers in 2025, a slight decline from 340,100 in 2023, a dip that coincides with the same period several major device makers announced layoffs tied to production-schedule adjustments and cost-reduction efforts. Despite employment softening slightly at the aggregate level, the industry remains highly fragmented: roughly 6,500 medical device companies operate in the US, and the overwhelming majority are small and medium-sized enterprises rather than the handful of giants that dominate industry revenue rankings.
2026 saw a steady drumbeat of workforce reductions at several major manufacturers even as overall industry revenue kept growing: Intuitive Surgical cut 331 jobs at its Sunnyvale, California site; Medtronic laid off 81 employees at its Northridge, California diabetes-device facility per a February 2026 WARN notice; Johnson & Johnson cut 56 jobs at its New Brunswick, New Jersey headquarters, effective August 21, 2026; and Labcorp closed its nonclinical device-testing facility in Bedford, Massachusetts, affecting 94 workers. That combination, rising revenue alongside selective headcount reduction, mirrors a pattern seen across much of US manufacturing in 2026, where automation and production-schedule optimization have let output grow even as specific facility headcounts shrink. For the clinical demand side of this employment picture, cardiac devices specifically continue driving steady procedure volume covered in the heart disease statistics report, which tracks pacemaker and defibrillator implantation trends tied directly to this manufacturing base.
Medical Device Tariffs and Trade Statistics in 2026
TARIFF IMPACT ON SELECTED US MEDTECH COMPANIES, 2025-2026
J&J MedTech, 2025 tariff cost          ████  ~$400M (1.3% of revenue)
J&J MedTech, 2026 forecast impact      █  ~1.2% of revenue
| Tariff Metric | Figure |
|---|---|
| J&J MedTech 2025 tariff cost | ~$400 million, ~1.3% of segment revenue |
| J&J MedTech 2026 forecast tariff impact | ~1.2% of revenue |
| Section 301 rates on advanced thermoplastics (device components) | Up to 50% |
| Effective stacked tariff rate, some Chinese components | Can exceed 40% |
| Share of US devices that are imported | ~62% |
| Share manufactured entirely outside the US | ~70% |
Source: J&J earnings commentary (CFO Joseph Wolk); MedDeviceGuide “Medical Device Tariffs & Trade War Impact 2026.”
Johnson & Johnson’s CFO Joseph Wolk confirmed the company’s MedTech division absorbed roughly $400 million in tariff costs in 2025, about 1.3% of that segment’s revenue, driven largely by retaliatory tariffs on US device exports into China combined with tariffs on imported components used in domestic assembly. CEO Joaquin Duato was notably skeptical that tariffs alone would meaningfully boost US manufacturing, arguing that “tax policy would be more effective” at incentivizing reshoring than trade barriers.
The tariff math is complicated further by the fact that moving final assembly to the US does not eliminate tariff exposure on the imported sub-components still required to build most devices, since a medical device manufacturer that assembles a product domestically using imported electronic boards, sensors, or specialty plastics still pays tariffs on each of those individual inputs. With certain advanced thermoplastics facing Section 301 rates as high as 50%, and effective stacked tariff rates on some Chinese-sourced components exceeding 40% once multiple tariff authorities apply simultaneously, the industry’s traditionally thin manufacturing margins make full reshoring considerably harder to justify financially than in sectors with wider margins, even when reshoring is the clear long-term strategic direction companies are pursuing.
Medical Device Reshoring Trends in the US 2026
2024 RESHORING/FDI JOB ANNOUNCEMENTS BY SECTOR
Total reshoring/FDI jobs announced       ██████████████████████████ 350,000
Medical & pharma mfg share (14%)         █████  ~49,000
| Reshoring Metric | Figure |
|---|---|
| Total 2024 reshoring/FDI jobs announced, all sectors | 350,000 |
| Medical and pharmaceutical manufacturing share | 14% (~49,000 jobs) |
| Healthcare manufacturing reshoring interest growth since 2020 | +70% |
| Industry leaders supporting reshoring as strategic imperative | 67% |
| Consumer support for reshoring critical industries | 98% |
| FDA expanded unannounced foreign facility inspections | Announced May 2025 |
Source: Black Book Research, “Tariff Pressures Driving Reshoring of U.S. Healthcare Manufacturing”; BMP Medical reshoring analysis, September 2026.
Interest in reshoring medical device manufacturing has grown substantially since 2020, with Black Book’s industry survey finding a 70% surge in healthcare manufacturing reshoring activity over that period, even as the same survey found 97% of respondents report their own operations are still at least partially dependent on offshore production. That gap between stated intent and operational reality captures the central challenge facing medical device reshoring: 67% of industry leaders support reshoring as a national strategic imperative, and 98% of surveyed American consumers favor it on national-security grounds, yet the underlying economics, thin margins, specialized labor shortages, and multi-year FDA revalidation timelines for any manufacturing change, continue to slow how quickly that sentiment translates into shifted production.
The FDA has added its own regulatory pressure to this shift, announcing in May 2025 that it would expand unannounced inspections of foreign manufacturing facilities, a move explicitly intended to tighten oversight of the offshore plants supplying the roughly 70% of US devices currently manufactured entirely outside the country. Any facility change a device maker does pursue, whether reshoring, nearshoring, or simply adding a second supplier, triggers FDA change-control requirements under the Quality System Regulation that typically demand a full revalidation cycle, a process device makers must factor into project timelines well before any new facility becomes operational. Hospital systems that ultimately purchase and deploy these devices face their own capacity pressures that intersect with this supply picture; the hospital closure statistics report details how shrinking rural hospital infrastructure affects access to the devices this industry produces.
Medical Device Manufacturers FAQs 2026
Who is the largest medical device manufacturer in the US in 2026?
Medtronic, with $36.4 billion in 2026 revenue, ahead of Johnson & Johnson MedTech ($33.8 billion) and Abbott ($30.3 billion).
How big is the US medical device market?
Estimates range from $175 billion to $377.72 billion depending on methodology, with most core industry-specific estimates clustering around $175-203 billion.
What share of the global medical device market does the US control?
Roughly 40%, with eight of the world’s ten largest medtech companies headquartered in the US.
How many medical devices did the FDA clear in 2025?
3,238 devices through the 510(k) pathway, plus 41 original PMA approvals.
How many people work in US medical device manufacturing?
329,700, based on 2025 BLS data for NAICS 3391 (Medical Equipment and Supplies Manufacturing).
How many medical device companies are there in the US?
Approximately 6,500, the large majority of which are small and medium-sized enterprises.
What share of US medical devices are imported?
Roughly 62%, with about 70% manufactured entirely outside the United States.
How much are tariffs costing medical device companies?
Johnson & Johnson’s MedTech division absorbed about $400 million in tariff costs in 2025, roughly 1.3% of segment revenue.
Does moving assembly to the US eliminate tariff costs?
No. Devices assembled domestically using imported components still face tariffs on those individual imported parts.
How many AI-enabled medical devices did the FDA clear in 2025?
295, across 221 unique manufacturers, marking a record year for AI/ML device clearances.
Is medical device manufacturing reshoring to the US?
Reshoring interest has grown 70% since 2020, though thin margins and long FDA revalidation timelines continue to slow the pace of actual facility relocation.
Which US state has the largest medical device manufacturing presence?
Massachusetts ranks among the leaders, generating $4.7 billion in medical device exports and employing 16.4% of its workforce in healthcare-related industries.
Disclaimer: This research report is compiled from publicly available sources. While reasonable efforts have been made to ensure accuracy, no representation or warranty, express or implied, is given as to the completeness or reliability of the information. We accept no liability for any errors, omissions, losses, or damages of any kind arising from the use of this report.