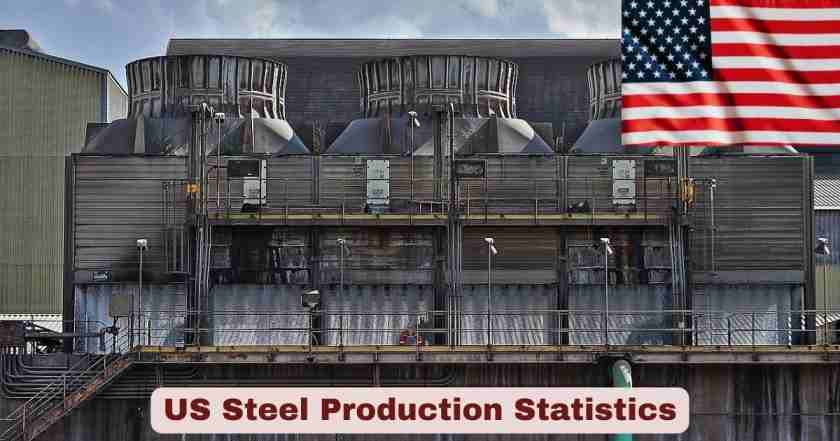
Steel Production in the US 2026
The United States steel industry continues to demonstrate remarkable resilience and adaptability as it navigates through 2026, maintaining its position as a critical component of American manufacturing infrastructure. According to the U.S. Geological Survey (USGS) Mineral Commodity Summaries 2025, the nation produced 81 million tons of raw steel in 2024, establishing a strong foundation for current year production trends. The industry operates through a sophisticated network of two companies managing integrated steel mills across 12 locations, complemented by 49 companies operating 104 minimills utilizing electric arc furnace technology.
The American steel sector represents a significant economic force, with an estimated sales value of approximately $120 billion in 2024, supporting employment for over 81,000 workers in iron and steel mills alone. Recent data from the American Iron and Steel Institute (AISI) for January 2026 indicates steady production momentum, with weekly output reaching 1.778 million short tons in the week ending January 24, 2026, marking a 20-week high and demonstrating the sector’s recovery from end-of-year seasonal adjustments. This production level, coupled with a capability utilization rate of 76.9%, signals healthy demand conditions across key consuming sectors including construction, automotive, and manufacturing.
Interesting Facts About US Steel Production in the US 2026
| Fact Category | Key Statistics | Data Source |
|---|---|---|
| Weekly Production (Week Ending Jan 24, 2026) | 1,778,000 short tons | American Iron and Steel Institute (AISI) |
| Capacity Utilization Rate (Jan 24, 2026) | 76.9% | American Iron and Steel Institute (AISI) |
| Year-to-Date Production (Through Jan 24, 2026) | 6,016,000 short tons | American Iron and Steel Institute (AISI) |
| Year-Over-Year Production Growth (YTD 2026) | +3.4% compared to 2025 | American Iron and Steel Institute (AISI) |
| Annual Raw Steel Production (2024) | 81 million metric tons | U.S. Geological Survey (USGS) |
| Total Production Capacity | 107 million tons per year | U.S. Geological Survey (USGS) |
| Number of Integrated Steel Mills | 12 locations (2 companies) | U.S. Geological Survey (USGS) |
| Number of Minimills | 104 facilities (49 companies) | U.S. Geological Survey (USGS) |
| Electric Arc Furnace Share | 72% of production | U.S. Geological Survey (USGS) |
| Basic Oxygen Furnace Share | 28% of production | U.S. Geological Survey (USGS) |
| Continuously Cast Steel | 99.7% of production | U.S. Geological Survey (USGS) |
| Total Industry Employment (Iron & Steel Mills) | 81,000 workers | Bureau of Labor Statistics (BLS) |
| Steel Product Manufacturing Employment | 56,000 workers | Bureau of Labor Statistics (BLS) |
| Industry Sales Value (2024) | $120 billion | U.S. Geological Survey (USGS) |
Data Source: American Iron and Steel Institute (AISI) Weekly Reports, U.S. Geological Survey (USGS) Mineral Commodity Summaries 2025, Bureau of Labor Statistics (BLS) 2024-2025
The latest statistics reveal robust momentum in US steel production heading into 2026. The American Iron and Steel Institute reported that weekly raw steel output for the week ending January 24, 2026, reached 1,778,000 short tons, representing the highest production level in 20 weeks and a 4.6% increase compared to the same week in 2025. The capacity utilization rate of 76.9% demonstrates that domestic mills are operating at healthy levels. Through the first three weeks of January 2026, cumulative production totaled 6,016,000 short tons, marking a 3.4% year-over-year increase from 2025.
The production landscape in 2024 established important benchmarks. The U.S. Geological Survey documented that total raw steel production reached 81 million metric tons, with electric arc furnaces accounting for 72% of output while basic oxygen furnaces contributed 28%. The fact that 99.7% of steel is continuously cast reflects near-universal adoption of this efficient technology. With combined production capacity of 107 million tons annually, the industry maintains substantial capacity reserves while supporting 137,000 direct manufacturing jobs.
Regional Steel Production Distribution in the US 2026
| Region | Production (Week Ending Jan 24, 2026) | Share of Total Production |
|---|---|---|
| Southern Region | 780,000 net tons | 43.9% |
| Great Lakes Region | 505,000 net tons | 28.4% |
| Midwest Region | 277,000 net tons | 15.6% |
| Northeast Region | 125,000 net tons | 7.0% |
| Western Region | 91,000 net tons | 5.1% |
| Total US Production | 1,778,000 net tons | 100.0% |
Data Source: American Iron and Steel Institute (AISI), Steel Market Update Analysis, January 2026
The geographic distribution of steel production across the United States in 2026 reveals distinct regional concentrations. The Southern region dominates domestic output, contributing 780,000 net tons during the week ending January 24, 2026, representing nearly 44% of total national production. This regional leadership reflects decades of investment in modern minimill capacity, particularly in states like Alabama, Texas, and Arkansas. The Great Lakes region maintains its position as the second-largest producing area with 505,000 net tons weekly, accounting for 28.4% of national output.
The Midwest, Northeast, and Western regions collectively contribute the remaining 27.7% of production. At the state level, the USGS reports that Indiana alone accounts for an estimated 25% of total raw steel production, followed by Ohio with 12%, Texas with 6%, and Pennsylvania with 5%. No other individual state accounts for more than 4% of total domestic raw steel production.
Steel Mill Product Shipments in the US 2026
| Shipment Category | Volume (2024) | Year-Over-Year Change |
|---|---|---|
| Total Steel Mill Product Shipments | 78 million metric tons | Down from 81 million tons (2023) |
| Construction Sector | 21.8 million metric tons | 28% of total shipments |
| Steel Service Centers & Distributors | 17.9 million metric tons | 23% of total shipments |
| Automotive Sector | 11.7 million metric tons | 15% of total shipments |
| Converting & Processing | 7.0 million metric tons | 9% of total shipments |
| Appliances | 2.3 million metric tons | 3% of total shipments |
| Machinery & Equipment | 2.3 million metric tons | 3% of total shipments |
| Oil & Gas | 2.3 million metric tons | 3% of total shipments |
| Other Applications | 12.5 million metric tons | 16% of total shipments |
Data Source: U.S. Geological Survey (USGS) Mineral Commodity Summaries 2025, American Iron and Steel Institute (AISI)
Steel mill product shipments in 2024 totaled 78 million metric tons, representing the primary channel through which domestically produced steel reaches end-use markets. The construction sector emerged as the largest consumer, receiving 21.8 million metric tons or 28% of total shipments. Steel service centers and distributors ranked second, handling 17.9 million metric tons (23% of shipments).
The automotive industry claimed 11.7 million metric tons (15% of shipments), maintaining its position as a major steel consumer. The converting and processing sector absorbed 7.0 million metric tons (9%), while appliances, machinery and equipment, and oil and gas each accounted for 2.3 million metric tons (3% each). According to the Metals Service Center Institute, service center stocks at year-end 2024 stood at 7.0 million metric tons.
Steel Imports and Trade Balance in the US 2026
| Trade Category | Volume (2024-2025) | Key Details |
|---|---|---|
| Total Steel Imports (2024 Est.) | 26 million metric tons | Finished + semifinished products |
| Finished Steel Imports (2024 Est.) | 20 million metric tons | Core import category |
| October 2025 Total Imports | 1.73 million net tons | +11.0% vs September 2025 |
| Year-to-Date Imports (Jan-Oct 2025) | Down 10.7% (total), 14.0% (finished) | Compared to 2024 |
| Top Import Source #1 – Canada | 311,000 net tons (October 2025) | Leading supplier |
| Top Import Source #2 – Brazil | 294,000 net tons (October 2025) | +68% vs September |
| Top Import Source #3 – Mexico | 154,000 net tons (October 2025) | +6% vs September |
| Total Steel Exports (2024 Est.) | 8 million metric tons | Finished + semifinished |
| Net Import Reliance | 13% of apparent consumption | Import dependence measure |
Data Source: American Iron and Steel Institute (AISI), U.S. Census Bureau, U.S. Department of Commerce International Trade Administration
Steel imports to the United States in 2024 are estimated at 26 million metric tons, comprising 20 million metric tons of finished steel products and 6 million metric tons of semifinished materials. The American Iron and Steel Institute reported that October 2025 imports totaled 1.73 million net tons, representing an 11.0% increase from September 2025 levels. The top five import sources in October 2025 were Canada (311,000 net tons), Brazil (294,000 net tons), Mexico (154,000 net tons), South Korea (128,000 net tons), and Taiwan (96,000 net tons).
On the export side, the United States shipped an estimated 8 million metric tons of steel in 2024. The net import reliance ratio stands at 13% of apparent consumption, meaning domestic production satisfies approximately 87% of US steel demand.
Steel Industry Employment in the US 2026
| Employment Category | Number of Workers (2024) | Notes |
|---|---|---|
| Iron and Steel Mills (NAICS 331100) | 81,000 workers | Primary production facilities |
| Steel Product Manufacturing (NAICS 332100) | 56,000 workers | Fabrication and finishing |
| Total Direct Steel Industry Employment | 137,000 workers | Combined manufacturing workforce |
| Average Annual Salary (Full-time) | $80,006 | Industry compensation |
| Average Weekly Hours (Full-time) | 45.2 hours | Work schedule |
Data Source: U.S. Bureau of Labor Statistics (BLS), Data USA, U.S. Department of Labor
The American steel industry directly employs approximately 137,000 workers across iron and steel mills and steel product manufacturing facilities as of 2024. This workforce is distributed between 81,000 employees in iron and steel mills and 56,000 workers in steel product manufacturing. Compensation levels in the steel industry remain competitive, with full-time employees earning an average annual salary of $80,006 while working an average of 45.2 hours per week.
Production Technology Distribution in the US 2026
| Technology Type | Production Share (2024) | Capacity & Facilities |
|---|---|---|
| Electric Arc Furnaces (EAF) | 72% of raw steel production | 104 minimill facilities |
| Basic Oxygen Furnaces (BOF) | 28% of raw steel production | 12 integrated mill locations |
| Continuously Cast Steel | 99.7% of production | Near-universal adoption |
| Pig Iron Production (2024) | 22 million metric tons | Integrated mill feedstock |
| Total Raw Steel Production (2024) | 81 million metric tons | Combined EAF + BOF output |
| Production Capacity | 107 million tons annually | Total national capacity |
| Capacity Utilization (Jan 24, 2026) | 76.9% | Weekly operating rate |
Data Source: U.S. Geological Survey (USGS) Mineral Commodity Summaries 2025, American Iron and Steel Institute (AISI)
The technological composition of US steel production in 2026 reflects a transformation toward electric arc furnace operations. Electric arc furnaces accounted for 72% of raw steel production in 2024, operating across 104 minimill facilities. Basic oxygen furnaces (BOF) contribute the remaining 28% through 12 integrated mill locations. Regardless of production method, 99.7% of American steel is continuously cast. With total production capacity of 107 million tons annually and current utilization rates around 76.9% as of late January 2026, the industry maintains flexibility to increase output.
Apparent Steel Consumption in the US 2026
| Consumption Metric | Volume (2024) | Calculation Method |
|---|---|---|
| Apparent Consumption (Steel Mill Products) | 93 million metric tons | Shipments + Imports – Exports ± Stock Changes |
| Domestic Shipments (2024) | 78 million metric tons | Primary supply source |
| Finished Steel Imports (2024) | 20 million metric tons | Foreign supply |
| Finished Steel Exports (2024) | 8 million metric tons | Domestic steel shipped abroad |
| Service Center Stocks (Year-end 2024) | 7.0 million metric tons | Inventory levels |
Data Source: U.S. Geological Survey (USGS) Mineral Commodity Summaries 2025, Metals Service Center Institute
Apparent steel consumption in the United States for 2024 remained steady at 93 million metric tons. The 93 million metric tons was supplied through multiple channels: 78 million metric tons from domestic mill shipments, 20 million metric tons from finished steel imports, reduced by 8 million metric tons of exports. Service center stocks at year-end 2024 stood at 7.0 million metric tons.
Producer Price Index and Market Conditions in the US 2026
| Price Indicator | Value (2024) | Comparison |
|---|---|---|
| Producer Price Index (Steel Mill Products) | 290 (1982=100 baseline) | Down from 320 (2023) |
| PPI Year-Over-Year Change | -9.4% decrease | 2024 vs 2023 |
| Industry Sales Value (2024) | $120 billion | Down 10% from 2023 |
| Average Revenue Per Ton (2024) | ~$1,481 per metric ton | Sales value ÷ production |
Data Source: U.S. Geological Survey (USGS) Mineral Commodity Summaries 2025, Bureau of Labor Statistics (BLS)
Steel prices in 2024 experienced significant moderation, with the Producer Price Index (PPI) declining to 290 from 320 in 2023, representing a 9.4% year-over-year decrease. The total sales value of the industry in 2024 reached approximately $120 billion, translating to an average revenue of approximately $1,481 per metric ton produced.
Infrastructure and Policy Impact on US Steel Production in US 2026
| Policy Initiative | Key Details | Steel Impact |
|---|---|---|
| Infrastructure Investment and Jobs Act (IIJA) | $1.2 trillion through 2026 | Enacted November 2021 |
| Buy America Requirements | Domestic steel mandated | Federal infrastructure projects |
| Domestic Content Threshold (2024) | 65% domestic content required | Increased from 60% |
| Future Domestic Content (2029) | 75% domestic content target | Progressive increase |
| Decarbonization Funding (DOE) | $575 million to one producer | Direct-reduced iron + EAF |
| Electrical Steel Grant (IRS) | $281 million for new facility | Alabama facility |
Data Source: U.S. Geological Survey (USGS) Mineral Commodity Summaries 2025, U.S. Department of Energy
Federal infrastructure and industrial policy initiatives are providing substantial support for US steel demand in 2026. The Infrastructure Investment and Jobs Act, enacted in November 2021, appropriates approximately $1.2 trillion through 2026 for infrastructure investments. The domestic content thresholds reached 65% in 2024 and are scheduled to rise to 75% by 2029. The U.S. Department of Energy selected one company for up to $575 million in decarbonization funding, while the IRS awarded $281 million toward an electrical steel facility.
Major Steel-Producing States in the US 2026
| State | Share of Total US Raw Steel Production | Key Features |
|---|---|---|
| Indiana | 25% of total production | Largest producing state |
| Ohio | 12% of total production | Second-largest producer |
| Texas | 6% of total production | Third-largest producer |
| Pennsylvania | 5% of total production | Fourth-largest producer |
Data Source: U.S. Geological Survey (USGS) Mineral Commodity Summaries 2025
Indiana maintains its position as the dominant steel-producing state, accounting for 25% of total raw steel production in 2024. Ohio ranks second with 12%, Texas contributes 6%, and Pennsylvania maintains 5% share. No other state accounts for more than 4% of total production.
Environmental and Sustainability Trends in the US 2026
| Sustainability Metric | Value/Status | Trend Direction |
|---|---|---|
| Steel Recycling Rate | 80-90% average | Consistently high |
| Automobiles Recycled Annually | >15 million tons | Nearly 100% recovery |
| Iron Ore Conserved Per Ton Recycled | 1.1 tons | Resource efficiency |
| Direct-Reduced Iron Consumption (2023) | 5.3 million tons | Growing alternative |
Data Source: U.S. Geological Survey (USGS) Mineral Commodity Summaries 2024-2025
The American steel industry’s environmental performance reflects decades of progress, with the steel recycling rate averaging 80-90%. Over 15 million tons of steel is recovered annually from approximately 12 million end-of-life vehicles. Recycling one ton of steel conserves 1.1 tons of iron ore, 0.6 ton of coking coal, and 0.05 ton of limestone.
The industry is utilizing direct-reduced iron (DRI) as an alternative feedstock, with consumption reaching 5.3 million tons in 2023. More than 7,000 vehicle dismantlers and 350 car shredders across North America create a reliable scrap supply for electric arc furnace operations.
Global Steel Production Context for the US 2026
| Country/Region | Raw Steel Production (2024 Est.) | Share of World Production |
|---|---|---|
| World Total | 1,900 million metric tons | 100.0% |
| China | 990 million metric tons | 52.1% |
| India | 150 million metric tons | 7.9% |
| Japan | 85 million metric tons | 4.5% |
| United States | 81 million metric tons | 4.3% |
| Russia | 75 million metric tons | 3.9% |
| South Korea | 64 million metric tons | 3.4% |
| Germany | 35 million metric tons | 1.8% |
| Brazil | 34 million metric tons | 1.8% |
Data Source: U.S. Geological Survey (USGS) Mineral Commodity Summaries 2025, World Steel Association
The United States’ position in global steel production during 2026 reflects its role as the world’s fourth-largest producer, contributing 81 million metric tons to total world output of approximately 1,900 million metric tons in 2024, representing 4.3% of global production. This ranking places the United States behind China (990 million metric tons, 52.1%), India (150 million metric tons, 7.9%), and Japan (85 million metric tons, 4.5%), while ahead of Russia (75 million metric tons, 3.9%) and South Korea (64 million metric tons, 3.4%).
China dominates global production, accounting for over half of total world output. The World Steel Association estimated that global finished steel consumption would decrease by approximately 0.9% in 2024 due to geopolitical uncertainties, inflation, and monetary tightening.
Economic Value and Industry Contribution in the US 2026
| Economic Indicator | Value | Context |
|---|---|---|
| Direct Economic Output (2017 Study) | >$520 billion | Including direct, indirect, induced |
| Direct Employment Impact (2017 Study) | ~2 million jobs | Total economic footprint |
| Annual Sales Value (2024) | $120 billion | Industry revenue |
| Production Volume (2024) | 81 million metric tons | Raw steel output |
| Average Value Per Ton (2024) | ~$1,481 per metric ton | Revenue per unit |
Data Source: American Iron and Steel Institute (AISI), U.S. Geological Survey (USGS)
The economic contribution of the American steel industry extends beyond direct employment and sales. According to a 2017 economic impact study by the American Iron and Steel Institute, the industry accounted for more than $520 billion in economic output and nearly 2 million jobs when including direct operations, indirect suppliers, and induced economic activity.
The $120 billion sales value in 2024 represents substantial economic activity in manufacturing-intensive regions. This revenue flows through complex supply chains, supporting thousands of supplier firms. Steel’s role as a foundational material for construction, automotive, machinery, and infrastructure means domestic production capacity has strategic importance for national economic security.
Steel Scrap Consumption and Recycling in the US 2026
| Scrap Category | Volume/Value | Details |
|---|---|---|
| Annual Domestic Scrap Consumption | ~70 million tons | American steelmaking furnaces |
| Post-Consumer (Old) Scrap | 58% of total scrap | Obsolete steel products |
| Prompt (New) Scrap | 24% of total scrap | Manufacturing plant scrap |
| Home (Mill) Scrap | 18% of total scrap | Recirculating mill scrap |
| Automobile Recycling Rate | ~100% annually | Nearly complete recovery |
| Steel Recycled from Automobiles | >15 million tons | Annual volume |
| Equivalent Cars Recycled | ~12 million vehicles | Annual basis |
| Vehicle Dismantlers | >7,000 facilities | North American network |
| Car Shredders | 350 operations | Processing facilities |
| Energy Savings from Recycling | 74% less energy | vs. primary production |
| Iron Ore Conserved Per Ton | 1.1 tons (2,500 lbs) | Resource savings |
| Coking Coal Conserved Per Ton | 0.6 ton (1,400 lbs) | Energy material savings |
| Limestone Conserved Per Ton | 0.05 ton (120 lbs) | Flux material savings |
| Scrap Export Volume (2023) | ~9 million metric tons | International shipments |
| Scrap Import Volume (2023) | ~3 million metric tons | Primary from Canada |
Data Source: U.S. Geological Survey (USGS) Mineral Commodity Summaries 2024-2025, American Iron and Steel Institute (AISI), Environmental Protection Agency (EPA)
Steel scrap recycling represents a cornerstone of the American steel industry’s operational model and sustainability profile in 2026. American steelmaking furnaces consume nearly 70 million tons of domestic steel scrap annually in the production of new steel, making recycled scrap the single largest source of raw material for the industry. This scrap is categorized into three types: post-consumer or old scrap comprising approximately 58% of total scrap (including discarded automobiles, appliances, machinery, railroad cars and tracks, demolished structures, and other end-of-life steel products), prompt or new scrap accounting for 24% (generated during manufacturing processes at fabrication plants), and home or mill scrap representing 18% (recirculating scrap produced and reused within the same steel production facility). The automobile sector stands as the primary source of old scrap, with recycling rates approaching 100% annually as more than 15 million tons of steel is recovered from approximately 12 million end-of-life vehicles each year through a robust infrastructure of over 7,000 vehicle dismantlers and 350 car shredders operating across North America.
The environmental and economic benefits of steel scrap recycling are substantial and well-documented by federal agencies. According to the Environmental Protection Agency, secondary steel production using recycled scrap requires approximately 74% less energy than primary production from iron ore, while the U.S. Department of Energy confirms that recycling one ton of steel conserves 1.1 tons (2,500 pounds) of iron ore, 0.6 ton (1,400 pounds) of coking coal, and 0.05 ton (120 pounds) of limestone. The energy saved from recycling steel in a single year is estimated to be equivalent to the power needed for approximately 18 million homes for 12 months. Beyond domestic consumption, the United States maintains an active international scrap trade, with exports totaling approximately 9 million metric tons in 2023 (valued at an estimated $4-5 billion) primarily destined for steel mills in Turkey, Mexico, Taiwan, and other countries, while imports of approximately 3 million metric tons arrive primarily from Canada (72% of imports), Mexico (12%), and European sources (~10%). The physical characteristics of steel enable it to be recycled continuously without loss of quality or strength, supporting the industry’s circular economy model where old cars become soup cans, which then become storage tanks, pipes, bridges, or new vehicles in an endless loop that maximizes resource efficiency while minimizing environmental impact in the 2026 landscape.
Raw Materials and Input Costs in the US 2026
| Raw Material | Cost Share | Key Details |
|---|---|---|
| Raw Materials (Total) | 56-71% of production costs | Varies by production route |
| Scrap Metal (EAF Operations) | Up to 72% of total costs | Primary EAF feedstock |
| Iron Ore (BOF Operations) | Major cost component | Blast furnace feedstock |
| Coking Coal (BOF Operations) | Significant expense | Fuel and reducing agent |
| Direct-Reduced Iron Consumption (2023) | 5.3 million tons | Alternative to scrap |
| Energy as Cost Component | Variable by technology | Higher for EAF operations |
| Scrap Metal Availability | Critical to EAF | Quality and supply dependence |
Data Source: U.S. Geological Survey (USGS), Industry Analysis Reports, U.S. Energy Information Administration (EIA)
Raw materials represent the dominant cost component in US steel production in 2026, accounting for 56% to 71% of total manufacturing expenses depending on the production technology employed and geographic location of facilities. In electric arc furnace (EAF) operations, which now account for 72% of domestic production, scrap metal serves as the primary raw material and can represent up to 72% of total production costs, making the availability, quality, and pricing of steel scrap absolutely critical to operational economics. The EAF sector benefits from the United States’ robust scrap collection infrastructure and high recycling rates, though scrap prices fluctuate based on global demand, domestic consumption patterns, and export market conditions. In contrast, traditional basic oxygen furnace (BOF) integrated mills rely primarily on iron ore as their principal raw material input, supplemented by coking coal which serves dual purposes as both a fuel source and chemical reducing agent in blast furnace operations. These materials are subject to international commodity market dynamics, transportation costs from mining regions, and geopolitical factors affecting global supply chains.
To bridge the gap between scrap-based EAF production and ore-based BOF production, the industry increasingly utilizes direct-reduced iron (DRI), with consumption reaching 5.3 million tons in 2023 and continuing to grow in 2026. DRI is produced by reducing iron ore pellets using natural gas rather than coke, creating a high-purity metallic iron feedstock that can be blended with scrap in EAF operations to achieve desired chemistry for premium steel grades while maintaining the energy efficiency and flexibility advantages of electric furnace technology. Beyond raw materials, energy costs represent another significant input expense, particularly for EAF operations where electricity accounts for a major portion of operating costs, though this is partially offset by the 74% energy savings compared to primary ore-based production. The competitive landscape for raw materials in 2026 is shaped by factors including domestic scrap generation rates tied to economic activity and vehicle retirement cycles, iron ore pricing influenced by Australian and Brazilian mining output and Chinese demand, coking coal availability from Appalachian and international sources, natural gas prices affecting DRI economics, and transportation infrastructure capacity connecting raw material sources to production facilities across the United States.
Steel Product Types and Applications in the US 2026
| Product Category | Primary Applications | Market Characteristics |
|---|---|---|
| Flat-Rolled Products | Construction, automotive, appliances | Largest product segment |
| Hot-Rolled Coil (HRC) | Structural applications, pipe | Benchmark pricing product |
| Cold-Rolled Coil (CRC) | Automotive, appliances | Premium processing |
| Coated Steel (Galvanized) | Construction, automotive | Corrosion resistance |
| Electrical Steel | Electric motors, transformers | Critical material designation |
| Long Products | Construction, infrastructure | Bars, rods, structural shapes |
| Rebar | Concrete reinforcement | Infrastructure demand driver |
| Structural Shapes | Buildings, bridges | Beams, columns, angles |
| Seamless Pipe & Tube | Energy, construction | Oil & gas applications |
| Welded Pipe & Tube | Construction, utilities | Standard/line pipe |
| Specialty Steels | Aerospace, defense, tooling | High-value applications |
| Stainless Steel | Food, chemical, medical | Corrosion-resistant alloys |
Data Source: American Iron and Steel Institute (AISI), Industry Publications
The American steel industry in 2026 produces a diverse portfolio of products serving specialized applications across the economy. Flat-rolled products constitute the largest product segment by volume, encompassing hot-rolled coil (HRC), cold-rolled coil (CRC), and various coated products including galvanized, galvalume, and tin-plated steel. Hot-rolled coil serves as the industry’s benchmark pricing product and finds applications in structural components, pipe and tube manufacturing, and general fabrication, while cold-rolled coil undergoes additional processing to achieve tighter dimensional tolerances and superior surface finish required for automotive body panels, appliances, and exposed applications. Coated steel products, particularly galvanized (zinc-coated) and galvalume (aluminum-zinc-coated) materials, provide enhanced corrosion resistance essential for automotive, metal building, and outdoor applications, representing significant value-added processing capabilities concentrated in facilities like those in Alabama, Indiana, and other strategic locations.
Electrical steel, recently designated as a critical material by the U.S. Department of Energy, has gained prominence due to its essential role in electric motors powering electric and hybrid vehicles, with the $281 million IRS grant supporting a new 150,000-ton-per-year facility in Alabama specifically targeting non-grain-oriented electrical steel production. Long products including rebar (reinforcing bar), structural shapes (beams, columns, angles, channels), bars, and rods serve the construction and infrastructure sectors, with rebar consumption driven by concrete reinforcement needs in buildings, bridges, highways, and other infrastructure funded through the Infrastructure Investment and Jobs Act. The pipe and tube sector manufactures both seamless and welded products, with seamless pipe commanding premium pricing for demanding applications in oil and gas drilling and transmission (OCTG – oil country tubular goods and line pipe), while welded pipe and tube serves standard construction, mechanical, and utilities applications. Specialty and stainless steels occupy higher-value market niches, with stainless steel (containing chromium and often nickel) providing corrosion resistance for food processing, chemical processing, medical equipment, and architectural applications, while other specialty alloys serve aerospace, defense, tooling, and advanced manufacturing sectors demanding specific performance characteristics for strength, heat resistance, wear resistance, or other critical properties in the 2026 marketplace.
Future Demand Drivers and Industry Outlook in the US 2026
| Demand Driver | Projected Impact | Key Details |
|---|---|---|
| Data Center Construction | High growth sector | AI infrastructure expansion |
| Meta Mesa Data Center | ~12,000 tons steel consumed | Arizona facility |
| Amazon New Carlisle Expansion | $15 billion investment | Indiana, 2026 start |
| LNG Export Facilities | Substantial steel demand | Multiple pipeline projects |
| Apex Pipeline | 2026 construction | Natural gas infrastructure |
| Infrastructure Spending (IIJA) | $1.2 trillion through 2026 | Federal investment |
| Buy America Provisions | Domestic preference | Infrastructure projects |
| Clean Energy Transition | Growing steel need | Wind, solar installations |
| Electric Vehicle Production | Electrical steel demand | Critical material status |
| Residential Construction | Interest rate sensitive | Potential recovery |
| Commercial Building | Steady demand | Office, retail, warehouse |
Data Source: Construction Industry Publications, U.S. Department of Energy, Congressional Research Service
The US steel industry in 2026 faces a dynamic demand environment shaped by emerging sectors and ongoing infrastructure investment. Data center construction has emerged as a significant new demand driver, with widespread artificial intelligence implementation requiring massive computational facilities that consume substantial quantities of structural steel, steel rebar for foundations and containment structures, and specialized steel products for power distribution and cooling systems. Major projects like the Meta Mesa Data Center in Arizona, which consumed an estimated 12,000 tons of steel including structural shapes for beams and columns, joists and deck, rebar, and galvanized products, demonstrate the material intensity of these facilities. Amazon’s $15 billion expansion of its New Carlisle, Indiana facility, scheduled to begin in early 2026 as the state’s largest project, exemplifies the scale of investment flowing into this sector.
Liquefied natural gas (LNG) export facilities and associated pipeline infrastructure represent another major demand source for 2026 and beyond. LNG facilities require substantial amounts of carbon-based steel throughout their construction, including structural beams and columns, pipe racks, compressor buildings, process modules, handrails, stairs, platforms, supports, steel plates for baseplates and connectors, and rebar reinforcement for pipe trenches, dikes, containment walls, tank slabs, and marine structures. Multiple natural gas pipeline projects including the Apex Pipeline, Blackcomb Pipeline, Saguaro Connector Pipeline, and Rio Bravo Pipeline are approved for 2026 construction, each requiring compressor stations, large-diameter pipelines and feeder lines, processing terminal connections, and extensive support structures. The Infrastructure Investment and Jobs Act’s $1.2 trillion appropriation through 2026, combined with strengthened Buy America provisions requiring domestic steel in federally-funded projects, continues to provide baseline demand support across highways, bridges, public transportation systems, rail, airports, water infrastructure, and broadband networks. The clean energy transition generates additional steel consumption through wind turbine towers and foundations, solar farm mounting structures, electric vehicle charging networks, battery manufacturing facilities, and transmission line upgrades, while potential residential construction recovery if interest rates moderate could unlock pent-up demand for housing-related steel products in appliances, HVAC systems, and structural applications.
Major Steel Producers and Production Facilities in the US 2026
| Producer/Facility | Production Capacity | Location & Technology |
|---|---|---|
| Nucor Corporation | Largest US producer by tonnage | 30+ EAF facilities |
| Nucor Calvert City | 4.2 million tons annually | Kentucky flagship plant |
| U.S. Steel Corporation | Integrated steel giant | Founded 1901 |
| Gary Works (U.S. Steel) | Largest integrated mill | Indiana, Lake Michigan |
| Big River Steel (U.S. Steel) | 6.3 million tons combined | Arkansas (BR1 + BR2) |
| Cleveland-Cliffs | Integrated flat-rolled producer | Indiana, Ohio facilities |
| Steel Dynamics Inc. | Second-largest US-owned | Georgia, Missouri, Texas |
| ArcelorMittal USA | Global leader, US footprint | Southeast EAF sites |
| Fairfield Works (U.S. Steel) | 1.6 million tons EAF capacity | Alabama |
| Total Integrated Mills | 12 locations | 2 operating companies |
| Total Minimills | 104 facilities | 49 operating companies |
| Combined National Capacity | 107 million tons annually | Total US capacity |
Data Source: American Iron and Steel Institute (AISI), Company Reports, Industry Publications
The American steel industry in 2026 is dominated by several major producers operating diverse production facilities across the country. Nucor Corporation ranks as the largest steel producer in the United States by tonnage, operating over 30 electric arc furnace (EAF) facilities that run primarily on scrap metal and electricity, with their flagship Calvert City, Kentucky plant processing 4.2 million tons per year. U.S. Steel Corporation, an integrated steel giant founded in 1901, continues to operate classic blast furnace complexes in Pennsylvania, Indiana, and Illinois, with Gary Works in Indiana remaining the single largest integrated mill in the country. U.S. Steel’s acquisition of Big River Steel added substantial EAF capacity, with the combined Big River 1 and Big River 2 facilities in Osceola, Arkansas contributing 6.3 million tons of annual raw steel capacity through modern electric arc furnaces, ladle metallurgy, endless casting and rolling, and extensive finishing capabilities.
Cleveland-Cliffs, formerly primarily an iron ore mining company, has pivoted to become a major flat-rolled steel producer operating integrated plants in Indiana and Ohio that serve the automotive and other critical markets. Steel Dynamics Inc. stands as the second-largest US-owned steelmaker, known for its agile EAF operations in Georgia, Missouri, and Texas that rapidly respond to market conditions. ArcelorMittal USA, the domestic arm of the global steel leader, maintains a strong US footprint especially in the Southeast where it operates modern EAF sites. U.S. Steel’s Fairfield Works near Birmingham, Alabama exemplifies modern domestic capacity with a state-of-the-art electric arc furnace having annual capacity of approximately 1.6 million tons that can be fitted with slab or rounds casters and actively supplies the company’s nearby Fairfield Tubular Operations seamless pipe mill. The competitive landscape is characterized by two companies operating the nation’s 12 integrated steel mill locations using traditional blast furnace and basic oxygen furnace technology, while 49 companies operate 104 minimill facilities employing electric arc furnace technology, collectively providing 107 million tons of annual production capacity strategically distributed across regions to serve local and national markets in the 2026 industrial environment.
Disclaimer: This research report is compiled from publicly available sources. While reasonable efforts have been made to ensure accuracy, no representation or warranty, express or implied, is given as to the completeness or reliability of the information. We accept no liability for any errors, omissions, losses, or damages of any kind arising from the use of this report.