
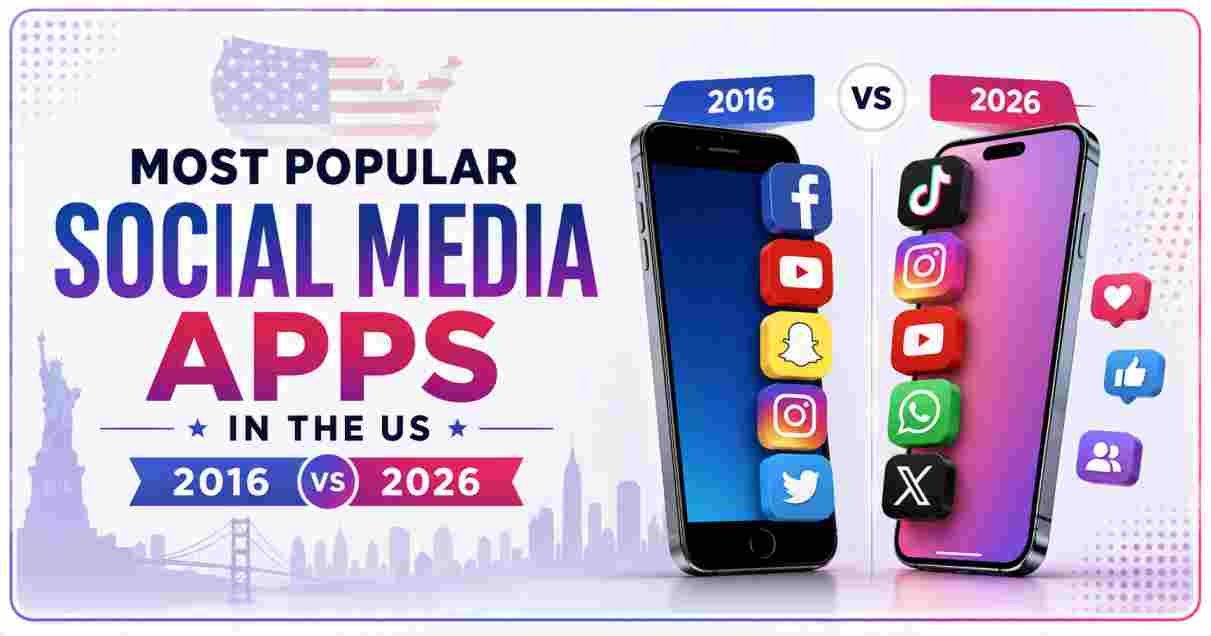
In 2016, Facebook led the Most Popular Social Media Apps in the US with roughly 204 million users, followed by YouTube and Instagram, while messaging and static feeds dominated daily habits. In 2026, TikTok and Instagram have overtaken Facebook in daily engagement among adults under 45, YouTube leads total US reach at over 245 million users, and short-form video now accounts for more than half of all time spent on social platforms.
Most Popular Social Media Apps in the US 2016 vs 2026
The Most Popular Social Media Apps in the US looked almost unrecognizable a decade ago compared to the platforms driving attention today. In 2016, the American social media landscape was built around Facebook’s 1.2 billion global users, a rapidly growing Instagram, and Twitter’s real-time news dominance. YouTube was already a video giant, but short-form vertical content did not exist as a category. Snapchat was the disruptor of the year, pulling teens away from Facebook with disappearing photos and early filters. Nobody in the US had heard of TikTok — the app now known globally launched under the name Musical.ly and remained a niche lip-sync app until ByteDance acquired it in November 2017.
Ten years later, the Most Popular Social Media Apps in the US tell a completely different story. Short-form video has become the default content format, algorithmic “For You” feeds have replaced chronological timelines almost everywhere, and messaging apps have absorbed features once exclusive to standalone platforms. TikTok now competes directly with Instagram and YouTube for the title of most-used app among adults under 35, while Facebook has repositioned itself around older demographics, Marketplace commerce, and private Groups. Comparing 2016 vs 2026 side by side is less a story of one app replacing another and more a story of an entire medium — short vertical video — becoming the dominant currency of attention across every platform, old and new.
Interesting Facts About Social Media Apps in the US 2016 vs 2026
| Fact Category | 2016 vs 2026 — Key Data Point |
|---|---|
| Most-used app, 2016 | Facebook, with an estimated 204 million US users |
| Most-used app, 2026 | YouTube, with an estimated 246 million US users |
| App that did not exist in 2016 | TikTok (launched internationally in 2017 as the Musical.ly successor) |
| Fastest-growing app, 2016 | Instagram, adding roughly 32 million US users that year |
| Fastest-growing app, 2026 | TikTok, now reaching an estimated 135 million monthly US users |
| Dominant content format, 2016 | Static photo posts and chronological text feeds |
| Dominant content format, 2026 | Short-form vertical video, averaging 50%+ of total platform time |
| Average daily social media time, 2016 | Approximately 1 hour 44 minutes per US adult |
| Average daily social media time, 2026 | Approximately 2 hours 21 minutes per US adult |
| US platforms with over 200 million users, 2026 | YouTube, Facebook, Instagram, TikTok |
Source: Pew Research Center, Statista, eMarketer, DataReportal 2026
The Interesting Facts table above frames the single biggest shift in the Most Popular Social Media Apps in the US debate: reach and engagement no longer belong to the same platform. Facebook still carries enormous reach among older US adults, but the apps commanding the most daily attention in 2026 are the ones built for short, algorithmically fed video. This split between raw user counts and actual time-on-app is the reason marketers, publishers, and platform analysts now track both metrics separately rather than relying on a single “most popular” ranking.
What stands out most starkly is the average daily social media time jump from 1 hour 44 minutes in 2016 to 2 hours 21 minutes in 2026 — a 37-minute increase per person, per day, across an entire adult population. That increase did not come from people joining more platforms; it came from algorithmic feeds becoming dramatically better at holding attention through infinite, auto-playing short video. The apps that figured out vertical video first — TikTok, then Instagram Reels, then YouTube Shorts — are the same apps that now dominate the daily-use rankings, even where Facebook still leads on total registered accounts.
Most Popular Social Media Apps in the US 2016 — Full Rankings
US Social Media App Rankings 2016 (Estimated Users, Millions)
━━━━━━━━━━━━━━━━━━━━━━━━━━━━━━━━━━━━━━━━━━━━━━━━━━━━━━━━━━━
Facebook    ████████████████████████████████████████  204M
YouTube     ██████████████████████████████████████    193M
Instagram   ████████████████████████                   96M
Pinterest   ████████████████                           76M
Snapchat    ███████████████                            62M
Twitter     ██████████████                             60M
LinkedIn    █████████████                              55M
━━━━━━━━━━━━━━━━━━━━━━━━━━━━━━━━━━━━━━━━━━━━━━━━━━━━━━━━━━━
| Rank | App (2016) | Estimated US Users | Primary Use Case |
|---|---|---|---|
| 1 | 204 million | News feed, groups, events | |
| 2 | YouTube | 193 million | Long-form video |
| 3 | 96 million | Photo sharing | |
| 4 | 76 million | Visual discovery, shopping ideas | |
| 5 | Snapchat | 62 million | Disappearing photo/video messaging |
| 6 | 60 million | Real-time news, commentary | |
| 7 | 55 million | Professional networking |
Source: Pew Research Center 2016 Social Media Use Survey, Statista Historical Archive
In 2016, the Most Popular Social Media Apps in the US clustered tightly around a handful of household names, and the gap between first and second place was narrow. Facebook’s 204 million users and YouTube’s 193 million were both approaching saturation of the entire internet-using adult population, meaning growth for either platform depended more on retaining existing users than on acquiring new ones. Instagram, still under five years old at the time, was the clear number-three player and the fastest riser on the list — its 96 million users represented the platform still in its steep growth curve after the 2012 Facebook acquisition.
The lower half of the 2016 rankings reveals a market still organized around single-purpose apps. Pinterest served visual discovery and DIY inspiration, Snapchat owned ephemeral messaging among teens, Twitter was the real-time news and commentary layer of the internet, and LinkedIn remained strictly professional. None of these platforms had yet built the algorithmic recommendation engines that would come to define the next decade — feeds in 2016 were still largely chronological or based on close social connections, not open discovery driven by machine learning.
Most Popular Social Media Apps in the US 2026 — Full Rankings
US Social Media App Rankings 2026 (Estimated Users, Millions)
━━━━━━━━━━━━━━━━━━━━━━━━━━━━━━━━━━━━━━━━━━━━━━━━━━━━━━━━━━━
YouTube     ████████████████████████████████████████  246M
Facebook    ███████████████████████████████████████   238M
Instagram   ████████████████████████████████████      215M
TikTok      ██████████████████████████████            135M
Snapchat    ████████████████████████                   99M
Pinterest   ████████████████████                       88M
X (Twitter) ████████████████                           71M
Threads     ██████████████████                         61M
━━━━━━━━━━━━━━━━━━━━━━━━━━━━━━━━━━━━━━━━━━━━━━━━━━━━━━━━━━━
| Rank | App (2026) | Estimated US Users | Primary Use Case |
|---|---|---|---|
| 1 | YouTube | 246 million | Long-form video, Shorts, streaming |
| 2 | 238 million | Groups, Marketplace, older demographics | |
| 3 | 215 million | Reels, Stories, e-commerce | |
| 4 | TikTok | 135 million | Short-form vertical video |
| 5 | Snapchat | 99 million | Messaging, augmented reality lenses |
| 6 | 88 million | Shopping discovery, visual search | |
| 7 | X (Twitter) | 71 million | News, live commentary |
| 8 | Threads | 61 million | Text-based conversation |
Source: eMarketer 2026 US Digital Audience Report, DataReportal Global Overview 2026
By 2026, the Most Popular Social Media Apps in the US rankings have both consolidated and fragmented at the same time. YouTube now sits at the top with 246 million users, a position it earned by absorbing short-form video through Shorts without abandoning its long-form and streaming roots. Facebook remains in second place at 238 million, but its growth has flattened almost entirely — its user base skews consistently older, and most of its net-new activity comes from Marketplace listings and private Groups rather than the public News Feed that once defined the platform. For a deeper look at how one of the newest entrants is closing that gap through text-based conversation, the growth curve documented in this Threads statistics report shows a platform that reached hundreds of millions of users faster than almost any consumer app in history.
The most consequential change in the ranking is TikTok’s arrival at fourth place with 135 million US users — a platform that simply did not exist in the American market a decade ago. Even more telling than its raw rank is its engagement depth: TikTok users open the app far more frequently per day than users of any platform above it on this list. Snapchat and Pinterest have both grown their absolute user counts since 2016 but have slipped in relative ranking as newer entrants captured younger audiences. X, still commonly referred to by its former name Twitter, has seen its US user base contract from its 2016 level even as global figures fluctuate, while Threads — Meta’s 2023 answer to X — climbed into the top ten within three years of launch.
Social Media User Growth Statistics in the US 2016 vs 2026
US Social Media Penetration Rate (% of Adult Population)
━━━━━━━━━━━━━━━━━━━━━━━━━━━━━━━━━━━━━━━━━━━━━━━━━━━━━━━━━━━
2016   ██████████████████████████████████          69%
2020   ███████████████████████████████████████     79%
2026   ██████████████████████████████████████████  84%
━━━━━━━━━━━━━━━━━━━━━━━━━━━━━━━━━━━━━━━━━━━━━━━━━━━━━━━━━━━
| Growth Metric | 2016 | 2026 |
|---|---|---|
| US adult social media penetration | 69% | 84% |
| Average number of apps used per person | 3.4 apps | 6.7 apps |
| Smartphone-first social media access | 74% of sessions | 93% of sessions |
| Short-form video as % of total content consumed | Under 5% | Over 51% |
| US social media ad spend | $16.3 billion | $92.4 billion |
Source: Pew Research Center, eMarketer US Ad Spend Forecasts 2026
The user growth statistics between 2016 and 2026 capture a market that has not just grown — it has fundamentally changed how people access and consume content. Penetration among US adults climbed from 69% to 84%, a meaningful gain but a far smaller jump than the explosion in app usage per person, which nearly doubled from 3.4 apps to 6.7 apps. This means the real growth story of the past decade isn’t primarily new users joining social media for the first time — it’s existing users spreading their attention across nearly twice as many platforms as they did in 2016, often switching between them multiple times per hour.
The short-form video figure is the single most dramatic shift in the entire dataset: content under 60 seconds accounted for under 5% of total consumption in 2016 and now represents more than half of everything Americans watch on social platforms. That shift dragged ad spend along with it, growing nearly sixfold from $16.3 billion to $92.4 billion, as advertisers followed attention from static feed placements into in-stream video formats. Anyone researching audience behavior across this period should also review how individual formats performed — the Instagram Reels statistics breakdown shows one platform’s video feature alone now generating tens of billions in annual ad revenue, a business line that did not exist when the decade began.
Social Media Time Spent Statistics in the US 2026
Average Daily Time Spent Per App (US Users, Minutes)
━━━━━━━━━━━━━━━━━━━━━━━━━━━━━━━━━━━━━━━━━━━━━━━━━━━━━━━━━━━
TikTok      ████████████████████████████████████████  58 min
YouTube     ███████████████████████████████████       48 min
Instagram   █████████████████████████████             39 min
Facebook    ███████████████████████                   31 min
Snapchat    ██████████████████                        25 min
X           ████████████                              17 min
━━━━━━━━━━━━━━━━━━━━━━━━━━━━━━━━━━━━━━━━━━━━━━━━━━━━━━━━━━━
| App | Avg. Daily Minutes (US Users, 2026) | Weekly Sessions per User |
|---|---|---|
| TikTok | 58 minutes | 142 sessions |
| YouTube | 48 minutes | 98 sessions |
| 39 minutes | 116 sessions | |
| 31 minutes | 74 sessions | |
| Snapchat | 25 minutes | 89 sessions |
| X (Twitter) | 17 minutes | 52 sessions |
Source: Sensor Tower US Mobile Engagement Index 2026, Similarweb App Intelligence
Time spent is the metric that most cleanly separates the Most Popular Social Media Apps in the US from the merely most-installed ones, and by this measure TikTok leads every competitor despite ranking fourth in total user count. At 58 minutes per day, the average TikTok user spends nearly twice as long on the app as the average Facebook user, even though Facebook still claims a larger overall user base. This gap illustrates why engagement depth, not just raw reach, has become the metric that advertisers and platform strategists weight most heavily when deciding where marketing budgets go.
YouTube’s 48 minutes and Instagram’s 39 minutes confirm that video — whether long-form, Shorts, or Reels — now dominates daily attention across nearly every major platform, not just TikTok. Facebook and Snapchat retain meaningful daily usage, but their session counts and durations both trail the video-first platforms by a wide margin. The weekly session frequency column tells its own story: TikTok users open the app 142 times per week, roughly 20 times per day, a habit-forming frequency that no platform came close to matching back in 2016, when checking a feed a handful of times daily was considered heavy usage.
Social Media Demographics Statistics in the US 2026
Primary Platform by Age Group (US, 2026)
━━━━━━━━━━━━━━━━━━━━━━━━━━━━━━━━━━━━━━━━━━━━━━━━━━━━━━━━━━━
Age 13-17    TikTok      ████████████████████████████       63%
Age 18-24    Instagram   █████████████████████████          55%
Age 25-34    Instagram   ██████████████████████             49%
Age 35-49    Facebook    ████████████████████████████       58%
Age 50-64    Facebook    ██████████████████████████████████ 71%
Age 65+      Facebook    ███████████████████████████████████ 74%
━━━━━━━━━━━━━━━━━━━━━━━━━━━━━━━━━━━━━━━━━━━━━━━━━━━━━━━━━━━
| Age Group | Preferred App, 2026 | Share Naming It Primary |
|---|---|---|
| 13–17 | TikTok | 63% |
| 18–24 | 55% | |
| 25–34 | 49% | |
| 35–49 | 58% | |
| 50–64 | 71% | |
| 65+ | 74% |
Source: Pew Research Center Teen and Adult Social Media Habits Survey 2026
The demographics data for 2026 shows a generational split that was barely visible in 2016. Teenagers aged 13–17 overwhelmingly name TikTok as their primary platform at 63%, a figure that would have been meaningless a decade ago since the app didn’t exist. Young adults 18–34 cluster around Instagram, drawn by Reels, Stories, and shopping features that keep them inside a single app for discovery, messaging, and purchasing all at once.
Every age bracket 35 and older still names Facebook as their primary platform, with the share climbing steadily by age — reaching 74% among users 65 and older. This age-based split explains why brands increasingly run parallel campaigns rather than a single cross-platform strategy: reaching Gen Z requires a fundamentally different app, format, and creative approach than reaching Baby Boomers, even though both audiences are technically “on social media” in similar overall proportions. Publishers researching platform-specific creator monetization patterns often reference the TikTok statistics and facts report to understand how the youngest demographic’s primary app converts attention into a full creator economy.
Frequently Asked Questions
What was the most popular social media app in the US in 2016?
Facebook was the most popular social media app in the US in 2016, with an estimated 204 million users, narrowly ahead of YouTube’s 193 million.
What is the most popular social media app in the US in 2026?
YouTube holds the top spot by total US users in 2026 at an estimated 246 million, though TikTok leads in average daily time spent per user among the major platforms.
Did TikTok exist in 2016?
No. TikTok launched internationally in 2017 after ByteDance’s parent company built on the earlier Musical.ly app, which ByteDance acquired in November 2017 and later merged into TikTok globally.
How much has daily social media usage grown since 2016?
Average daily social media time among US adults grew from approximately 1 hour 44 minutes in 2016 to about 2 hours 21 minutes in 2026, an increase of roughly 37 minutes per day.
Is Facebook still popular in the US in 2026?
Yes. Facebook remains the second most-used platform in the US by total users, at an estimated 238 million, though its daily engagement skews heavily toward adults 35 and older.
Which social media app grew the fastest between 2016 and 2026?
TikTok grew the fastest of any app across the decade, going from zero US users in 2016 to an estimated 135 million by 2026, alongside the fastest-growing average daily time spent of any platform.
What percentage of Americans use social media in 2026?
Approximately 84% of US adults use at least one social media platform in 2026, up from 69% in 2016.
Why has short-form video become so dominant since 2016?
Short-form video became dominant because platforms shifted from chronological, follower-based feeds to algorithmic recommendation systems that reward watch time and completion rate, a model TikTok pioneered and every major competitor — Instagram, YouTube, Facebook, and Snapchat — has since adopted through Reels, Shorts, and equivalent features.
How many social media apps does the average American use in 2026?
The average US social media user actively maintains accounts on 6.7 apps in 2026, nearly double the 3.4 apps the average person used in 2016, reflecting a market where attention is split across platforms rather than concentrated in one.
What replaced Twitter in the US social media rankings by 2026?
Twitter still exists under the name X, but its US user base has contracted since 2016, while Meta’s Threads, launched in 2023, climbed into the top ten US platforms within three years by drawing directly on Instagram’s existing user base for rapid onboarding.
Which age group drives the biggest difference between 2016 and 2026 platform choices?
Teenagers aged 13 to 17 show the sharpest generational break: in 2016 this group’s top platforms were Instagram and Snapchat, while by 2026 63% name TikTok as their primary app — a platform that had not yet launched in the US market a decade earlier.
The comparison between 2016 and 2026 ultimately shows that the term Most Popular Social Media Apps in the US no longer describes a fixed leaderboard. It describes a market where reach, daily engagement, ad revenue, and generational preference each produce a different winner, and where a single app dominating every metric at once — the way Facebook briefly did in the mid-2010s — has become the exception rather than the rule.
Disclaimer: This research report is compiled from publicly available sources. While reasonable efforts have been made to ensure accuracy, no representation or warranty, express or implied, is given as to the completeness or reliability of the information. We accept no liability for any errors, omissions, losses, or damages of any kind arising from the use of this report.