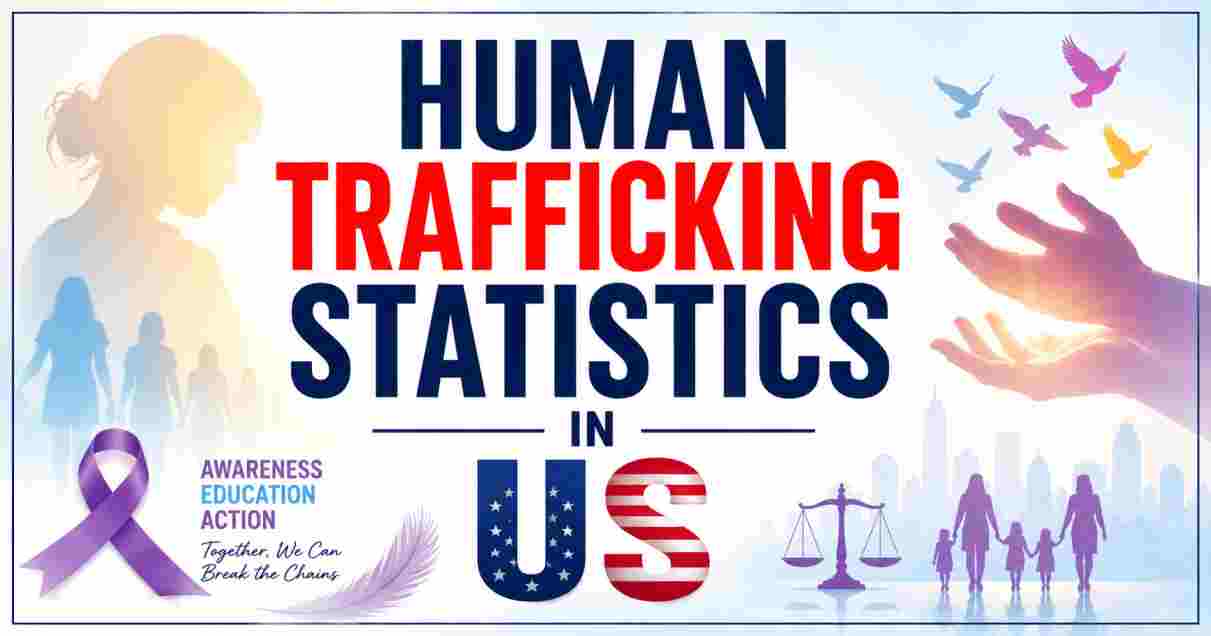
Human Trafficking in America 2026
Human trafficking statistics in the United States for 2026 come from a genuinely fragmented data landscape, and that fragmentation is itself one of the most important facts to understand before looking at any individual number. No single US government agency counts “how many trafficking victims there are” in any definitive sense. Instead, the picture is assembled from several overlapping but methodologically distinct sources: the National Human Trafficking Hotline, operated under a U.S. Department of Health and Human Services (HHS) contract and historically run by the nonprofit Polaris Project; the Department of Justice’s annual federal prosecution data; the State Department’s annual Trafficking in Persons (TIP) Report, mandated by the Trafficking Victims Protection Act of 2000; and the National Center for Missing and Exploited Children (NCMEC) for child-specific cases. Each source counts something different — hotline contacts, federal prosecutions, or globally-derived prevalence estimates — and conflating them produces exactly the kind of misleading statistics that have long plagued public discussion of this issue.
According to the National Human Trafficking Hotline’s own published data, the hotline has received 463,109 signals and identified 112,822 cases of human trafficking involving 218,568 victims since Polaris began operating it in 2007. In 2024 specifically, the hotline received 32,309 substantive signals and identified 11,999 potential trafficking cases referencing roughly 21,866 victims. On the federal enforcement side, the Department of Justice initiated 146 federal human trafficking prosecutions in fiscal year 2024, charging 223 defendants and securing 210 convictions — though this represented a meaningful decline from the 181 prosecutions and 289 convictions recorded in fiscal year 2023, according to the State Department’s 2025 Trafficking in Persons Report. Every credible source in this field — the DOJ, the State Department, Polaris, and independent researchers alike — agrees on one point above all others: trafficking is substantially underidentified, and the statistics that follow represent only the visible portion of a crime that is, by its nature, designed to stay hidden. This article compiles the latest, most current verified statistics on human trafficking in the United States as of today.
Interesting Facts About Human Trafficking in the US 2026
| Fact | Detail |
|---|---|
| Total signals received by the National Human Trafficking Hotline (since 2007) | 463,109 signals |
| Total trafficking cases identified by the Hotline (since 2007) | 112,822 cases |
| Total victims identified through the Hotline (since 2007) | 218,568 victims |
| Hotline signals received in 2024 | 32,309 substantive signals |
| Potential trafficking cases identified, 2024 | 11,999 cases, referencing approximately 21,866 victims |
| Sex trafficking situations reported to the Hotline, 2024 | 6,647 situations |
| Labor trafficking situations reported, 2024 | 2,220 situations |
| Combined sex and labor trafficking situations, 2024 | 1,360 situations |
| Hotline demographic data, 2024 (non-cumulative) | 8,233 adults; 2,666 minors; 8,359 females; 1,972 males |
| DOJ federal human trafficking prosecutions, FY2024 | 146 prosecutions (down from 181 in FY2023) |
| DOJ defendants charged, FY2024 | 223 defendants (down from 258 in FY2023) |
| DOJ convictions secured, FY2024 | 210 convictions (down from 289 in FY2023) |
| FBI human trafficking investigations, FY2023 | 666 cases; 145 arrests |
| ICE/HSI human trafficking investigations, FY2023 | 1,282 cases; 2,610 arrests |
| Individuals referred to U.S. attorneys for trafficking offenses, FY2023 | 2,329 individuals — a 23% increase from 2013 |
| NCMEC reports of possible child sex trafficking, 2024 | More than 27,800 reports |
| Children reported missing in 2024 who were likely trafficking victims | 1 in 7 of more than 29,000 missing child cases |
| Global human trafficking victims (ILO estimate, 2021) | 27.6 million people — 3.5 per 1,000 globally |
| Global trafficking — share via forced labor vs. sexual exploitation | 77% forced labor; 23% commercial sexual exploitation |
Source: National Human Trafficking Hotline, official statistics (humantraffickinghotline.org, accessed 2026); U.S. Department of Transportation, “Human Trafficking 101” (transportation.gov, updated May 28, 2026); U.S. Department of State, 2025 Trafficking in Persons Report — United States narrative (state.gov, September 29, 2025); Congressional Research Service, “Criminal Justice Data: Human Trafficking” (congress.gov, R47211); International Labour Organization, Global Estimates of Modern Slavery 2021
The facts table above illustrates why responsible reporting on this topic requires constant attention to which specific dataset a given number comes from. The National Human Trafficking Hotline’s cumulative figures since 2007 — 463,109 signals, 112,822 cases, 218,568 victims — are frequently cited as if they represented the scale of trafficking in America today, but these are cumulative totals spanning nearly two decades, not an annual snapshot, and they reflect hotline contacts rather than confirmed criminal convictions. The far smaller 2024-specific figures — roughly 12,000 cases and 22,000 referenced victims in a single year — provide a more accurate sense of the current annual scale of what is being reported through this one channel, though even this remains, by every official acknowledgment, a significant undercount of the true scope of trafficking nationally.
The DOJ enforcement data reveals a genuinely concerning year-over-year decline that deserves direct attention rather than being buried in a larger numbers table: federal prosecutions fell from 181 in FY2023 to 146 in FY2024, a drop of roughly 19%, while convictions fell even more sharply, from 289 to 210, a decline of approximately 27%. The State Department’s own 2025 TIP Report does not offer an explicit single-sentence explanation for this decline within the publicly available narrative, but it is documented as fact within the same report that simultaneously assesses US government anti-trafficking efforts against the Trafficking Victims Protection Act’s minimum standards — meaning this is not an outside critique of US enforcement, but the US government’s own published accounting of its own enforcement trend.
National Human Trafficking Hotline Data for 2026
National Human Trafficking Hotline — Cumulative vs. Annual (2024) Figures
──────────────────────────────────────────────────────────────────────────
CUMULATIVE (since 2007)
  Signals received      │████████████████████████████████████████  463,109
  Cases identified        │████████░░░░░░░░░░░░░░░░░░░░░░░░░░░░░░░░  112,822
  Victims identified        │██████████████░░░░░░░░░░░░░░░░░░░░░░░░  218,568

ANNUAL (2024 only)
  Signals received          │████████████████████████████████████████  32,309
  Cases identified            │████████████░░░░░░░░░░░░░░░░░░░░░░░░░░  11,999
  Victims referenced            │████████████████████░░░░░░░░░░░░░░░░░  ~21,866
                                  └──────────────────────────────────────────
                                  (Source: National Human Trafficking Hotline
                                  official statistics; DOT Human Trafficking 101)
| Hotline Metric (2024) | Figure |
|---|---|
| Sex trafficking situations | 6,647 |
| Labor trafficking situations | 2,220 |
| Combined sex and labor trafficking situations | 1,360 |
| Adults identified (non-cumulative) | 8,233 |
| Minors identified (non-cumulative) | 2,666 |
| Females identified (non-cumulative) | 8,359 |
| Males identified (non-cumulative) | 1,972 |
| Reported method of contact | Primarily by phone or text; also chat, online form, email |
| Hotline operating hours | 24/7, 365 days a year, in more than 200 languages |
| Hotline number | 1-888-373-7888, or text 233733 |
| Operational transition (2026) | HHS and Polaris transitioning hotline operations to Compass Connections |
Source: National Human Trafficking Hotline official statistics (humantraffickinghotline.org); U.S. Department of Transportation, “Human Trafficking 101” (May 28, 2026)
The 2024 hotline breakdown by trafficking type confirms the long-documented pattern that sex trafficking situations significantly outnumber labor trafficking situations in what gets reported to this particular channel, with 6,647 sex trafficking situations compared to 2,220 labor trafficking situations. It is important to understand that this proportion reflects what the Hotline receives and identifies — which depends heavily on public awareness, who is positioned to recognize and report a situation, and which forms of trafficking are more visible to bystanders and survivors — rather than necessarily reflecting the true underlying prevalence of each trafficking type nationally. Labor trafficking, which frequently occurs in private homes, agricultural settings, or industries with limited public visibility, is widely believed by researchers to be substantially underreported relative to sex trafficking, which more often intersects with law enforcement contact, healthcare settings, and public-facing commercial activity.
A significant operational change is underway in 2026 that researchers should be aware of: the National Human Trafficking Hotline’s own website confirms operations are being transitioned from Polaris to a new operator, Compass Connections, working alongside HHS during the transition. This matters for data continuity, since Polaris itself has faced sustained, legitimate methodological criticism over the years — Wikipedia’s documentation of the organization notes that in 2011 Polaris was specifically criticized for “knowingly using false and misleading data to exaggerate the number of trafficked sex workers,” and that journalist Elizabeth Nolan Brown of Reason magazine has referred to Polaris as “one of the biggest purveyors of bad statistics dressed up as ‘human trafficking awareness.'” Polaris has since partnered with data analysis firm Palantir Technologies specifically to improve data accuracy, and the hotline’s official statistics page is now considerably more methodologically careful, explicitly noting its data “does not define the totality of human trafficking” and that figures only reflect cases that were actually reported.
Federal Prosecution & Enforcement Statistics for 2026
DOJ Federal Human Trafficking Enforcement — FY2023 vs. FY2024
──────────────────────────────────────────────────────────────────────
                       FY2023        FY2024        Change
Prosecutions initiated │ 181          │ 146          │ −19.3%
Defendants charged      │ 258          │ 223          │ −13.6%
Convictions secured       │ 289          │ 210          │ −27.3%
Sex-trafficking-predominant│ 169          │ 136          │ −19.5%
Labor-trafficking-predominant│ 12          │ 10           │ −16.7%
                              └──────────────────────────────────────
                              (Source: 2025 Trafficking in Persons
                              Report, United States narrative)
| Federal Enforcement Metric | FY2023 | FY2024 |
|---|---|---|
| DOJ prosecutions initiated | 181 | 146 |
| Defendants charged | 258 | 223 |
| Convictions secured | 289 | 210 |
| Prosecutions predominantly sex trafficking | 169 | 136 |
| Prosecutions predominantly labor trafficking | 12 | 10 |
| Extraterritorial child sexual exploitation convictions | 8 | 5 |
| Individuals referred to U.S. attorneys, FY2023 | — | 2,329 (a 23% increase from 2013) |
| FBI human trafficking investigations, FY2023 | — | 666 cases; 145 arrests |
| ICE/HSI human trafficking investigations, FY2023 | — | 1,282 cases; 2,610 arrests |
| OVC (DOJ) human trafficking grantees, FY2023 | — | 249 grantees, serving ~7,755 clients per quarter |
| State prison admissions for trafficking offenses, 2023 | — | 916 admissions (National Corrections Reporting Program) |
Source: U.S. Department of State, 2025 Trafficking in Persons Report — United States narrative (September 29, 2025); Congressional Research Service, “Criminal Justice Data: Human Trafficking” (R47211)
The gap between investigative volume and prosecutorial outcomes is one of the most analytically important patterns in this entire dataset. ICE’s Homeland Security Investigations division alone opened 1,282 cases and made 2,610 arrests in FY2023, a volume that dwarfs the 146 federal prosecutions DOJ actually initiated the following fiscal year. This is not necessarily evidence of failure — trafficking investigations frequently uncover related crimes (immigration violations, narcotics offenses, financial crimes) that get prosecuted under different statutes, and many arrests lead to state rather than federal charges, which are not captured in DOJ’s federal trafficking-specific prosecution count. Still, the Congressional Research Service’s own analysis is candid that “even if law enforcement becomes aware of a potential crime, it may not have the resources to conduct an extensive and ongoing investigation,” and that “competing priorities coupled with finite resources can be limiting factors.”
The decline in DOJ’s headline prosecution and conviction figures between FY2023 and FY2024 is documented but not fully explained in the publicly available portions of the 2025 TIP Report. What is clear from the surrounding context is that this occurred during a period when the Department of Homeland Security was simultaneously issuing new rules to strengthen worker protections within temporary worker programs and resuming interview requirements for certain H-2 visa applicants — suggesting policy attention to labor trafficking prevention was active even as raw prosecution numbers fell. The 916 state prison admissions for trafficking offenses in 2023, reported separately through the National Corrections Reporting Program, is a useful reminder that the federal prosecution figures discussed throughout most trafficking coverage represent only one layer of the US criminal justice response — the substantial majority of all criminal prosecutions in the United States occur at the state and local level and are not centrally tracked in the same way as DOJ’s federal caseload.
Trafficking Routes, Recruitment & Transportation Methods in 2026
How Traffickers Transport Victims — Survivor-Reported Methods
──────────────────────────────────────────────────────────────────────────────────────────
Trafficker's own vehicle      │███████████████████████████████████████  81%
Rental vehicles               │███████████████████████░░░░░░░░░░░░░░░░  47%
Taxis                         │███████████████████████░░░░░░░░░░░░░░░░  47%
Airplanes                     │███████████████████░░░░░░░░░░░░░░░░░░░░  38%
Public buses                  │████████████████░░░░░░░░░░░░░░░░░░░░░░░  33%
Victim's own vehicle          │█████████████░░░░░░░░░░░░░░░░░░░░░░░░░░  27%
                                                                               └──────────────────────────────────────────
                                          (Source: Polaris 2018 survivor transportation study)
| Recruitment / Transportation Metric | Figure |
|---|---|
| Survivors who used transportation during recruitment (NOST 2021) | 81% of 107 surveyed survivors |
| Survivors who used transportation during exploitation (NOST 2021) | 76% |
| Survivors for whom transportation aided their exit/escape (NOST 2021) | 52% |
| Transported by trafficker’s own vehicle (Polaris 2018, n=104) | 81% |
| Transported by rental vehicles | 47% |
| Transported by taxis | 47% |
| Transported by airplane | 38% |
| Transported by public bus | 33% |
| Transported by victim’s own vehicle | 27% |
| Transported by subway | 19% |
| Transported by long-distance bus | 19% |
| Transported by long-distance rail | 11% |
| Online recruitment as a method (2025 data) | Two-thirds of cases identified in 2025 involved online recruitment via social media, dating apps, or fraudulent job postings |
| Most frequently reported control methods (2021 Hotline trend analysis) | Emotional abuse (28%), economic abuse (26%), threats (23%) |
| Adverse childhood experiences among survivors (2022 Polaris study, n≈450) | 96% experienced abuse; 91% mental health challenges; 83% poverty; 69% ran away from home; 62% substance abuse |
Source: U.S. Department of Transportation, “Human Trafficking 101,” citing the 2021 National Outreach Survey for Transportation (NOST) by United Against Slavery and a 2018 Polaris survivor transportation study (transportation.gov, May 28, 2026); Agape International Missions, citing 2025 TIP Report trend analysis (April 2026)
The transportation and recruitment data reveals that trafficking in the United States is overwhelmingly facilitated through ordinary, everyday transportation infrastructure rather than any specialized or exotic smuggling network — a finding with direct practical implications for prevention training across the transportation sector. The fact that 81% of surveyed survivors were transported in a trafficker’s own personal vehicle, with rental cars and taxis each used in 47% of cases, underscores why the Department of Transportation has developed specific trafficking-awareness training programs targeted at rideshare drivers, taxi operators, and rental car staff — these are precisely the touchpoints where survivors have reported genuine opportunities for intervention or escape, with 52% of NOST survey respondents specifically citing transportation as having facilitated their eventual exit from a trafficking situation.
The shift toward online recruitment represents the most significant methodological change in how trafficking is initiated as documented heading into 2026, with roughly two-thirds of cases identified in 2025 involving recruitment through social media, dating apps, or fraudulent job postings, according to trend analysis cited by anti-trafficking organization Agape International Missions, drawing on the 2025 TIP Report’s own technology-focused findings. This shift is directly connected to the TIP Report’s explicit warning about the dual role of artificial intelligence in this space: the same AI tools that help investigators analyze online advertisements and identify victims are simultaneously being weaponized by traffickers to automate grooming, generate deepfake exploitation material, and run large-scale scam operations — a genuinely new and rapidly evolving dimension of the trafficking landscape that older, vehicle-and-location-focused transportation data does not fully capture.
Disclaimer: This research report is compiled from publicly available sources. While reasonable efforts have been made to ensure accuracy, no representation or warranty, express or implied, is given as to the completeness or reliability of the information. We accept no liability for any errors, omissions, losses, or damages of any kind arising from the use of this report.