
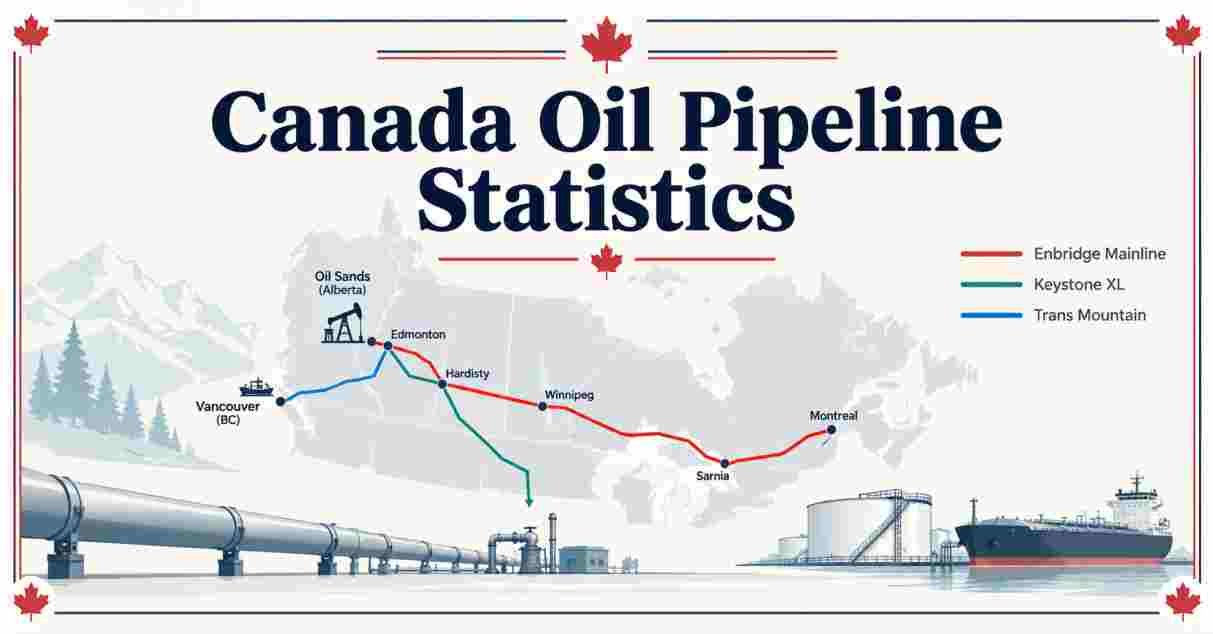
Canada’s six major western export pipelines carried a combined 4.75 million barrels per day of crude oil in 2025, led by Enbridge’s 3.22-million-barrel-per-day Mainline, while a newly fast-tracked 1-million-barrel-per-day pipeline to the Pacific coast could cost up to C$43.7 billion and create 140,000 jobs. Prime Minister Mark Carney accelerated the national-interest review of that new West Coast pipeline in late September 2026, with a government decision expected by October 1, as Canada pushes to diversify crude exports beyond the United States.
Canada Oil Pipeline – Introduction
Canada’s oil pipeline network moved into a genuinely new phase in 2026, after years of a single dominant storyline: the completion of the Trans Mountain Expansion Project in mid-2024. That expansion nearly tripled Trans Mountain’s capacity to 890,000 barrels per day, giving Canada its first meaningful alternative to piping almost all of its crude oil directly into the United States. By 2026, that expanded pipeline was already running at full capacity, and the conversation in Ottawa and Calgary shifted decisively toward what comes next — a shift accelerated dramatically by the 2026 Iran conflict, which disrupted Middle Eastern oil flows through the Strait of Hormuz and sent Asian refiners searching for alternative, geopolitically stable crude supplies.
That search put Canada’s west coast pipeline capacity squarely in the spotlight. With more than 90% of Canadian crude still flowing to the United States via pipeline, and Trans Mountain itself already oversubscribed, Prime Minister Mark Carney’s government moved in 2026 to fast-track a proposed new pipeline to British Columbia’s northwest coast — a project that would roughly double Canada’s current tidewater export capacity and materially reduce the country’s near-total reliance on a single export market. This report walks through Canada’s current pipeline capacity, the major expansion and optimization projects underway, and the economics behind the country’s biggest energy infrastructure push in over a decade.
Interesting Facts about Canada Oil Pipeline 2026
| Category | Figure |
|---|---|
| Combined capacity, 6 major Western Canada export pipelines (2025) | 4.75 million barrels/day |
| Enbridge Mainline nameplate capacity | 3.22 million barrels/day |
| Trans Mountain pipeline capacity (post-expansion) | 890,000 barrels/day |
| Trans Mountain record quarterly utilization (Q2 2026) | 94%, averaging 840,000 b/d |
| Proposed new West Coast pipeline capacity | 1,000,000 barrels/day |
| Estimated cost of the new West Coast pipeline | C$35.2-43.7 billion |
| Jobs the new pipeline could create at construction peak | 140,000 |
| Canadian crude oil production (2025 record) | 5.1 million barrels/day |
| Share of Canadian crude exports sent to the US | More than 90% |
Canada’s pipeline capacity numbers reveal a system running with almost no spare room. Western Canada’s six major export pipelines had only an estimated 150,000 barrels a day of spare takeaway capacity as of the second quarter of 2026, a notably tight margin given that Canadian oil production hit a record 5.1 million barrels per day on average in 2025, with further growth expected. The Enbridge Mainline, by far the largest system, ran “apportioned” — meaning oversubscribed — throughout the first quarter of 2026, while Trans Mountain itself hit a record 94% utilization rate in the second quarter, underscoring just how little slack currently exists in Canada’s ability to move oil to market.
That tightness is precisely why the proposed new West Coast pipeline became such an urgent political priority in 2026. At a full 1 million barrels per day, the project would increase Canada’s total crude export capacity by close to 20% in one stroke and more than double the country’s existing capacity to ship oil to tidewater for overseas shipment — a genuinely transformative addition rather than an incremental one, and the clearest sign yet that Ottawa is treating pipeline capacity as a strategic economic priority rather than simply an industry concern.
Canada’s Current Pipeline Network and Capacity in 2026
WESTERN CANADA CRUDE OIL EXPORT PIPELINE CAPACITY, 2025 ('000 B/D)
ENBRIDGE MAINLINE      ████████████████████████████████████████  3,062-3,220
SOUTH BOW KEYSTONE     ███████  579-580
TRANS MOUNTAIN         ████████  701-890
ENBRIDGE EXPRESS       ███  276-310
RANGELAND/MILK RIVER   █  98-127
| Pipeline | 2025 Capacity (‘000 b/d) | Primary Destination |
|---|---|---|
| Enbridge Mainline | 3,062-3,220 | US Exports, Eastern Canada |
| South Bow Keystone | 579-580 | US Exports |
| Trans Mountain | 701-890 | Marine Exports (B.C./Asia) |
| Enbridge Express | 276-310 | US Exports |
| Rangeland/Milk River | 98-127 | US Exports |
| Total combined capacity | ~4,745-4,746 | — |
Data Source: Canadian Association of Petroleum Producers (CAPP), Canada Energy Regulator, Trans Mountain Corp.
Canada’s crude oil leaves Western Canada through six major export pipeline systems, and the scale difference between the largest and smallest of them is stark. The Enbridge Mainline alone accounts for roughly two-thirds of total export capacity, moving crude and natural gas liquids from Alberta and Saskatchewan to refineries across Eastern Canada and the US Midwest through more than 13,800 kilometers of active pipe — a network so extensive that Enbridge says it connects to 75% of North America’s total refining capacity. By contrast, smaller systems like Rangeland/Milk River move a fraction of that volume, together with Enbridge Express and South Bow’s Keystone pipeline rounding out the remaining export capacity heading to the United States.
Trans Mountain occupies a unique position in this network as Canada’s only pipeline reaching the Pacific coast, making it the sole direct conduit for Canadian crude to reach Asian markets by sea rather than crossing into the United States first. Since the Trans Mountain Expansion Project entered service in May 2024, the pipeline’s capacity has sat at 890,000 barrels per day, nearly triple its original 300,000-barrel-per-day capacity — and by 2026, that expanded capacity was already proving insufficient to meet demand, running at a record 94% utilization rate in the second quarter and operating at full capacity through June and July. For more on how this pipeline capacity fits into the broader US-Canada energy trading relationship, see our What Does the US Import From Canada report.
Trans Mountain Pipeline in 2026
TRANS MOUNTAIN PIPELINE CAPACITY GROWTH
ORIGINAL CAPACITY          ████  300,000 b/d
POST-EXPANSION (2024)      ████████████  890,000 b/d
POTENTIAL W/ OPTIMIZATION  ████████████████  1,190,000 b/d (by late 2028)
| Metric | Figure |
|---|---|
| Original pipeline capacity | 300,000 barrels/day |
| Capacity after the 2024 expansion (TMEP) | 890,000 barrels/day |
| Expansion project cost | C$34 billion (~US$24.2 billion) |
| Record quarterly utilization (Q2 2026) | 94%, averaging 840,000 b/d |
| Potential capacity with drag-reducing agents (DRA) | +10% |
| Potential capacity with further optimization (by late 2028) | ~1.19 million barrels/day |
| China’s share of Trans Mountain seaborne exports | ~60% |
Data Source: Trans Mountain Corp., US Energy Information Administration, Canada Energy Regulator
The Trans Mountain Expansion Project, which took years to build and roughly C$34 billion to complete, added 590,000 barrels per day of new capacity when it entered commercial service in May 2024, connecting Alberta’s oil sands to the port of Burnaby near Vancouver. The strategic payoff of that expansion became especially apparent in 2026: as the 2026 Iran conflict disrupted Middle Eastern crude flows through the Strait of Hormuz, Asian refiners increasingly turned to Trans Mountain’s seaborne exports as a geopolitically stable alternative, with China alone now accounting for roughly 60% of the pipeline’s marine shipments according to the Canadian government.
Rather than build an entirely new pipeline to add capacity in the near term, federal regulators approved Trans Mountain’s request to use drag-reducing agents (DRA) — a chemical additive that reduces friction inside the pipe — to boost throughput by about 10% without new construction, with that project moving forward through 2026 and 2027. A more ambitious Mainline Optimization Project could add another 210,000 barrels per day by the end of 2028, pushing total system capacity to approximately 1.19 million barrels per day — a meaningful increase achieved largely through engineering upgrades to the existing pipeline rather than a new greenfield build.
Enbridge Mainline: Canada’s Largest Export Pipeline in 2026
ENBRIDGE MAINLINE THROUGHPUT GROWTH
2007    ████████  ~1.5 million b/d
2025    ████████████████  ~3.1-3.2 million b/d
| Metric | Figure |
|---|---|
| Nameplate capacity | 3.22 million barrels/day |
| Throughput, Q1 2026 | ~3.2 million barrels/day (apportioned/oversubscribed) |
| Pipeline length | 13,800+ kilometers |
| Share of Canadian crude exports carried | 58-65% |
| Phase 1 optimization (approved, in service 2027) | +150,000 barrels/day, part of a C$1.4 billion package |
| Phase 2 optimization (postponed, July 2026) | +250,000 barrels/day (on hold) |
Data Source: Enbridge, Canada Energy Regulator, Reuters
The Enbridge Mainline is Canada’s single largest piece of oil export infrastructure by a wide margin, and its throughput has essentially doubled since 2007, climbing from roughly 1.5 million barrels per day to around 3.1 to 3.2 million barrels per day in 2025 and into 2026, driven by debottlenecking projects and the completed Line 3 Replacement. The system has consistently run close to its full nameplate capacity of 3.22 million barrels per day, and reporting from the first quarter of 2026 described the Mainline as “apportioned” — industry terminology for oversubscribed — throughout the period, meaning shippers wanting to move oil through the system faced reduced allocations relative to what they requested.
Enbridge approved a $1.4 billion expansion package in mid-2026 covering Mainline and Flanagan South pipeline upgrades, adding a combined 250,000 barrels per day of capacity for Canadian heavy oil shippers moving crude to US refiners, expected online in 2027. A separate, larger second-phase Mainline expansion that would have added another 250,000 barrels per day was postponed in July 2026, with Enbridge citing a lack of firm commitments from Canadian oil producers to significantly increase output — a reminder that pipeline capacity additions ultimately depend on upstream production growth materializing as projected. For broader context on how Canada’s overall economic picture has been shaped by energy prices and trade dynamics in 2026, see our Canada’s Economy Statistics report.
The New West Coast Pipeline: Canada’s Next Mega-Project in 2026
NEW WEST COAST PIPELINE: KEY PROJECT METRICS
CAPACITY               ████████████████████████████████████████  1,000,000 b/d
ESTIMATED COST (LOW)   ██████████████████████████████████  C$35.2 billion
ESTIMATED COST (HIGH)  ████████████████████████████████████████  C$43.7 billion
| Metric | Figure |
|---|---|
| Proposed capacity | 1,000,000 barrels/day |
| Estimated construction cost | C$35.2 billion to C$43.7 billion |
| Jobs created (construction peak) | Up to 140,000 |
| Annual GDP contribution | Over C$20 billion/year |
| Government revenue by 2060 | ~C$100 billion |
| Minimum Indigenous ownership offer | 10%+ |
| National-interest decision deadline | October 1, 2026 |
| Lead developers | Trans Mountain Corp. (with Pembina Pipeline Corp.) |
Data Source: Government of Canada, Reuters, BOE Report
Prime Minister Mark Carney announced in late September 2026 that his government would fast-track approval of a new, government-backed oil export pipeline to British Columbia’s northwest coast, framing the project as central to Canada’s ambition of becoming a global “energy superpower.” At a proposed capacity of 1 million barrels per day, built and operated by government-owned Trans Mountain Corp. in coordination with Pembina Pipeline Corp., the project would roughly double Canada’s current ability to ship oil directly to Asian markets rather than through the United States — a strategic priority that gained new urgency after the 2026 Iran conflict exposed the risks of relying on Middle Eastern supply routes vulnerable to disruption at the Strait of Hormuz.
The numbers behind the project are substantial even by the standards of major energy infrastructure: Alberta estimates construction costs between C$35.2 billion and C$43.7 billion, while Ottawa projects the completed pipeline would create up to 140,000 jobs at the peak of construction, generate more than C$20 billion a year in GDP, and deliver roughly C$100 billion in cumulative government revenue by 2060. The government has also committed that Indigenous communities along the route would receive an ownership offer of no less than 10%, reflecting lessons learned from the lengthy legal and regulatory battles that delayed the original Trans Mountain expansion for years. A formal national-interest designation decision was expected by October 1, 2026, with construction potentially beginning as early as that September if the designation is granted — though the project still faces a multi-year path through environmental review, Indigenous consultation, and final investment decisions before any oil actually flows.
Canada’s Oil Exports and Trade in 2026
CANADIAN CRUDE EXPORTS: US vs. NON-US DESTINATIONS
US DESTINATIONS (TOTAL)           ████████████████████████████████████████  >90%
NON-US (VIA TRANS MOUNTAIN, ETC.) ████  <10%, but growing fast
| Metric | Figure |
|---|---|
| Share of Canadian crude exports to the US | More than 90% |
| Canadian crude exports to non-US destinations, 2024 growth | Nearly 60% increase, to a record 10.6 million m³ |
| Canadian oil production (2025 average) | 5.1 million barrels/day (record) |
| Alberta oil & gas exports (2025) | ~4.8 MMBOE/day, worth C$131 billion |
| WCS-to-WTI price discount (2025, aided by Trans Mountain) | ~US$12/barrel |
| Projected Canadian production growth by decade’s end | +500,000 to 600,000 barrels/day |
Data Source: Statistics Canada, Canadian Association of Petroleum Producers (CAPP), Bank of Canada
Despite years of effort to diversify, more than 90% of Canada’s crude oil exports still flow to the United States, a dependence that has become a sharper political concern amid unpredictable US trade policy under President Trump’s tariff regime. Still, the trend line on diversification is moving in a meaningful direction: Statistics Canada reported that Canadian crude exports to countries other than the United States jumped nearly 60% in 2024 alone, reaching a record 10.6 million cubic metres, almost entirely attributable to the Trans Mountain Expansion coming online and opening a genuine pathway to Asian buyers for the first time at scale.
Canadian production itself continues climbing, hitting a record 5.1 million barrels per day on average in 2025, with Enbridge forecasting another 500,000 to 600,000 barrels per day of supply growth by the end of the decade. That growing supply has also helped narrow the long-standing Western Canadian Select (WCS) discount to US benchmark crude, which the Bank of Canada credits Trans Mountain with helping hold near US$12 a barrel through much of 2025 — a meaningful improvement in the price Canadian producers actually realize for their oil, compared with the much steeper discounts that prevailed before additional export capacity became available. For more on how this growing energy sector has fed into provincial labor markets, particularly in Alberta, see our Canada Employment Statistics report.
Frequently Asked Questions
What is the total capacity of Canada’s oil export pipelines?
Canada’s six major Western export pipelines had a combined capacity of approximately 4.75 million barrels per day in 2025, led by the Enbridge Mainline at 3.22 million barrels per day and Trans Mountain at 890,000 barrels per day.
How much oil does the Trans Mountain pipeline carry?
Trans Mountain’s capacity reached 890,000 barrels per day following the Trans Mountain Expansion Project, which entered service in May 2024. The pipeline hit a record 94% utilization rate in the second quarter of 2026, averaging 840,000 barrels per day.
What is the proposed new Canadian oil pipeline to the west coast?
Announced and fast-tracked in September 2026 under Prime Minister Mark Carney, the proposed New West Coast Pipeline would carry 1 million barrels per day to British Columbia’s northwest coast, at an estimated cost of C$35.2 to C$43.7 billion, creating up to 140,000 jobs at construction peak.
How much of Canada’s oil is exported to the United States?
More than 90% of Canadian crude oil exports still go to the United States, though exports to other destinations — primarily via the Trans Mountain pipeline to Asia — grew nearly 60% in 2024 alone, reaching a record 10.6 million cubic metres.
Is Canada’s largest pipeline, the Enbridge Mainline, at full capacity?
Largely, yes. The Enbridge Mainline, with a nameplate capacity of 3.22 million barrels per day, ran “apportioned,” or oversubscribed, throughout the first quarter of 2026, reflecting very limited spare capacity across the broader Western Canadian pipeline network.
How much oil does Canada produce?
Canadian crude oil production hit a record 5.1 million barrels per day on average in 2025, with industry forecasts projecting an additional 500,000 to 600,000 barrels per day of growth by the end of the decade.
Why is Canada building new pipelines now?
A combination of record oil production, near-full existing pipeline capacity, and the 2026 Iran conflict’s disruption of Middle Eastern crude flows through the Strait of Hormuz has pushed Canada to accelerate new pipeline capacity, particularly to diversify exports away from near-total reliance on the United States and toward Asian markets.
How many jobs would the new Canadian pipeline create?
The Canadian government estimates the proposed 1-million-barrel-per-day West Coast pipeline would create up to 140,000 jobs at the peak of construction, along with more than C$20 billion annually in GDP and roughly C$100 billion in cumulative government revenue by 2060.
Disclaimer: This research report is compiled from publicly available sources. While reasonable efforts have been made to ensure accuracy, no representation or warranty, express or implied, is given as to the completeness or reliability of the information. We accept no liability for any errors, omissions, losses, or damages of any kind arising from the use of this report.