
What Does the US Import From Canada?
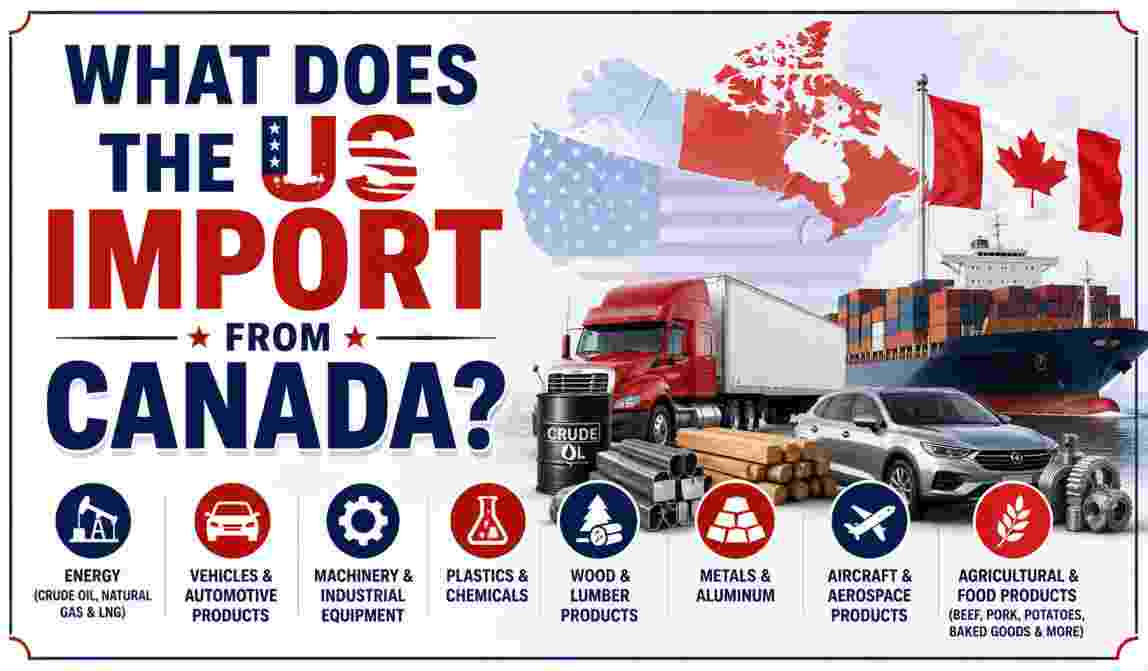
Canada is one of America’s most deeply integrated trading partners, and the goods flowing south across the border reflect decades of supply chain integration, particularly in energy, automotive manufacturing, and industrial materials. The relationship isn’t simple buyer-and-seller trade — much of it involves components and raw materials crossing the border multiple times as they move through joint North American production processes before reaching a final consumer. Canada’s largest exports to the US include crude oil, natural gas, and electricity, alongside vehicles and auto parts, industrial metals like aluminum and steel, and a substantial slate of agricultural products ranging from beef to processed fruits and vegetables.
In 2026, this relationship sits under unusual strain. A series of tariffs imposed under the International Emergency Economic Powers Act (IEEPA) and Section 232 of the Trade Expansion Act, layered on top of the existing US-Mexico-Canada Agreement (USMCA), have reshaped the cost and structure of cross-border trade even as the underlying volume of goods — especially energy — remains substantial. With the mandatory USMCA six-year review beginning in July 2026, and both governments navigating an unusually contentious tariff environment, understanding exactly what the US imports from Canada, and at what value, has become more relevant than at almost any point in the agreement’s history.
Key US-Canada Import Facts in 2026
| Fact | Figure |
|---|---|
| US goods imports from Canada (2025) | $381.9 billion, down 7.2% from 2024 |
| US goods and services imports from Canada (2025) | $453.6 billion |
| US goods exports to Canada (2025) | $333.6 billion, down 4.8% from 2024 |
| US-Canada goods trade deficit (2025) | $48.3 billion, a 21% decrease from 2024 |
| Canada’s rank as a US import source (2024) | 3rd-largest, behind Mexico and China |
| Canada’s rank as a US export destination | 1st, the top destination for US goods |
| Share of 2025 Canadian imports classified as goods | 85.8% |
| Largest single import category | Industrial supplies and materials, $195.9 billion |
| June 2026 average CAD/USD exchange rate | 1.4034 Canadian dollars per US dollar |
Source: US Census Bureau and Bureau of Economic Analysis FT900 report; USAFacts trade data; Office of the US Trade Representative Canada country page.
Taken together, these figures describe a trading relationship that remains enormous in absolute terms even as it contracts year over year. The drop from 2024’s $412 billion in goods imports to 2025’s $381.9 billion represents a meaningful 7.2% decline, driven largely by falling energy prices and the tariff regime introduced through 2025, yet Canada still comfortably ranks among the top three sources of everything the US buys from abroad. The relationship also remains asymmetric in an important way: Canada depends far more heavily on US demand than the reverse, exporting over three-quarters of its total goods to the United States while importing under half of its goods from the US in return.
What’s most notable for 2026 specifically is the narrowing trade deficit, which fell 21% even as total trade volume declined — a combination explained largely by US exports to Canada falling less steeply than US imports from Canada. This pattern reflects the immediate effect of the tariff measures imposed throughout 2025: US imports of Canadian goods, particularly energy and metals subject to new duties, dropped faster than the reciprocal flow of American goods heading north, narrowing the gap between what the US buys and what it sells to its northern neighbor.
US Energy Imports From Canada in 2026
| Energy Import Metric | Figure |
|---|---|
| Total US-Canada energy trade value (2025) | $137 billion, down 11% from 2024 |
| US energy imports from Canada (2025) | $111 billion |
| US energy exports to Canada (2025) | $26 billion |
| Crude oil share of total energy trade value | 69% |
| Average crude oil trade value (2025) | $94.7 billion, down 16% from 2024 |
| Canada’s share of US crude oil imports by volume (2025) | 64% (1.4 billion barrels) |
| Canada’s share of US crude oil imports (2015, for comparison) | 41% (1.1 billion barrels) |
| Tariff rate on Canadian energy exports (non-USMCA-qualifying) | 10% |
| Average Brent crude oil price (2025) | $69/barrel, down $11 from 2024 |
Source: US Energy Information Administration “Lower crude oil prices reduced U.S.-Canada energy trade value in 2025”; Congressional Research Service US-Canada Trade Relations report, March 2026.
Canada's Share of US Crude Oil Imports by Volume: 2015 vs 2025
2015   ████████████████ 41% (1.1 billion barrels)
2025   █████████████████████████ 64% (1.4 billion barrels)
Energy remains, by a wide margin, the single most important category in the entire US-Canada trading relationship, and crude oil alone accounts for 69% of all energy trade value between the two countries. What makes this dependence structurally durable rather than easily substitutable is pipeline infrastructure: American refineries, particularly in the Midwest, were specifically engineered to process the heavy crude oil Canada produces, meaning even significant tariff friction hasn’t meaningfully dented the physical flow of oil across the border. Canada’s share of total US crude oil imports actually grew from 41% in 2015 to 64% in 2025, even as the overall dollar value of the energy trade declined due to falling prices.
The 11% drop in total energy trade value during 2025 illustrates an important distinction between price and volume: lower global oil prices, averaging $69 per barrel versus $80 the year before, reduced the dollar value of the trade even as physical barrel volumes climbed. The 10% tariff on non-USMCA-qualifying energy exports, introduced in March 2025, adds a layer of cost that importers must now navigate, though the EIA notes that most crude oil volumes remain potentially exempt if they qualify for USMCA preference, meaning the tariff’s practical bite on actual energy flows has so far been more limited than its headline rate might suggest.
Vehicles and Automotive Imports From Canada in 2026
| Automotive Import Metric | Figure |
|---|---|
| Vehicles category rank among Canadian imports (by value) | 2nd-largest, after energy products |
| Canada Imports of vehicles/parts from US, Feb. 2026 (month-over-month) | +5.9% |
| US tariff on vehicle and auto parts imports (April 2025) | 25% |
| US-manufactured component share of some Canadian-assembled vehicles | 60% to 80% |
| US goods trade with Canada (total, exports + imports, 2025) | $715.5 billion |
| Auto sector characterization | “Deeply integrated” supply chains |
| Section 232 tariff exemption status for USMCA-compliant vehicles | Not exempt |
| Canada’s motor vehicle production trend (early 2026) | Volatile; production stoppages in January, rebound in February |
Source: Congressional Research Service US-Canada Trade Relations, September 2025 and March 2026 updates; Trading Economics Canada trade data; CargoTrans Canada Tariff guide, June 2026.
Canada Motor Vehicle & Parts Imports from US: Monthly Volatility, Early 2026
January 2026    ████████ Decline (-4.5%), production stoppages
February 2026   ████████████ Increase (+5.9%), rebound in production
The automotive sector stands out as the clearest illustration of just how intertwined US-Canada manufacturing has become, since many vehicles assembled in Canadian plants in Ontario and Quebec already contain 60% to 80% US-manufactured components before they’re shipped south. This means a single vehicle can cross the US-Canada border multiple times during production — as raw parts, subassemblies, and finally a finished car — making the 25% Section 232 tariff on vehicles and auto parts imposed in April 2025 a genuinely complicated cost to calculate, since the “Canadian” and “American” content of any given vehicle is often deeply blended.
The volatility visible in early 2026 production data — a 4.5% decline in January followed by a 5.9% rebound in February — reflects how sensitive this tightly linked supply chain is to short-term disruptions, whether from tariff policy changes, plant maintenance schedules, or shifting demand. Crucially, the CRS notes that USMCA-compliant vehicles are not exempt from the Section 232 tariffs, a departure from how the agreement traditionally shielded qualifying goods from additional duties, meaning the automotive sector has had to absorb costs that other USMCA-compliant categories have largely avoided.
Industrial Materials and Metals Imports From Canada in 2026
| Industrial Materials Metric | Figure |
|---|---|
| Largest single 2025 import category | Industrial supplies and materials, $195.9 billion |
| Section 232 steel/aluminum tariff rate (as of June 2025) | 50% |
| Steel/aluminum tariff before June 2025 increase | 25% |
| Copper products tariff (introduced August 2025) | 50% |
| Canada’s status as a key US copper import source | Confirmed by CRS as a “key source” |
| USMCA-compliant steel/aluminum/copper tariff exemption | Not exempt from Section 232 |
| Country exemptions eliminated for steel/aluminum tariffs | All exemptions removed, March 2025 |
| US imports of “commodities not specified by kind” from Canada | $10.55 billion (2024) |
Source: Congressional Research Service, “U.S.-Canada Trade Relations,” updated through March 2026; USAFacts Canada trade breakdown, July 2026.
Section 232 Tariff Escalation on Canadian Steel & Aluminum
Pre-March 2025   ████████████ 25% (with country exemptions)
June 2025+       ████████████████████████ 50% (exemptions eliminated)
Industrial supplies and materials — a broad category covering everything from chemicals and plastics to metals and minerals — was the single largest category of US imports from Canada in 2025, at nearly $196 billion, edging out even energy in the USAFacts breakdown of the year’s trade composition. Within this category, metals have faced the sharpest and most rapidly escalating tariff treatment of any sector in the relationship: Section 232 steel and aluminum duties, which stood at 25% with country-specific exemptions as recently as early 2025, were doubled to 50% by June 2025 after Canada’s exemption was eliminated entirely in March of that year.
The August 2025 addition of 50% tariffs on copper products extended this metals-focused tariff escalation further, a significant development given that Canada ranks as a key source of US copper imports. Unlike some other trade categories where USMCA compliance shields goods from additional duties, the CRS is explicit that USMCA-compliant steel, aluminum, copper, and related products remain fully subject to Section 232 tariffs, meaning the trade agreement’s usual protections simply don’t apply to this particular slice of the relationship, regardless of how the underlying materials were sourced or processed.
US Trade Deficit and Balance With Canada in 2026
| Trade Balance Metric | Figure |
|---|---|
| 2025 goods trade deficit with Canada | $48.3 billion |
| 2024 goods trade deficit with Canada | $61.2 billion (implied by the 21% decrease) |
| 2025 goods and services trade deficit (USAFacts figure) | $27.35 billion |
| 2024 goods and services deficit (for comparison) | $39.4 billion |
| US goods and services trade (total) with Canada, 2025 | $872.3 billion, down 4.6% from 2024 |
| Consecutive years of US trade deficit with Canada | Every year, 2021 through 2025 |
| June 2026 US total goods and services deficit (all countries) | $73.3 billion, down from $77.6 billion in May |
| Year-to-date deficit reduction (all countries, through June 2026) | -$189.3 billion, or 33.8% |
Source: US Census Bureau/BEA “U.S. International Trade in Goods and Services,” June 2026 release; USAFacts trade balance analysis, July 2026; Office of the US Trade Representative.
US Goods Trade Deficit with Canada: 2024 vs 2025 ($ Billions)
2024   ████████████████████████████████████████████████████ $61.2B
2025   ████████████████████████████████████████ $48.3B (-21%)
The US has run a trade deficit with Canada every year from 2021 through 2025, a persistent pattern that reflects the sheer scale of energy and industrial material purchases relative to what Canada buys back. Even so, the 21% narrowing of that deficit in 2025 is one of the more significant shifts in the relationship’s recent history, driven by the combination of falling US import volumes under tariff pressure and relatively steadier US export performance to Canada. It’s worth noting that different data sources — USAFacts’ goods-and-services figure of $27.35 billion versus the goods-only figure of $48.3 billion — capture different scopes of the relationship, since Canada’s services deficit actually runs in the US’s favor and partially offsets the larger goods imbalance.
The broader national context matters too: America’s overall global trade deficit fell 33.8% year-to-date through June 2026 compared to the same period in 2025, suggesting the Canada-specific narrowing is part of a wider pattern playing out across US trade relationships as the 2025-2026 tariff regime reshapes import volumes broadly, not just with Canada specifically. For a broader view of how the US trade landscape has shifted across all of its partners during this period, the US trading partners statistics provide useful comparative context on how Canada’s position stacks up against Mexico, China, and the European Union.
US Tariffs on Canadian Imports in 2026
| Tariff Metric | Figure |
|---|---|
| Base IEEPA tariff rate on most Canadian imports (initial, March 2025) | 25% (10% for energy/potash) |
| Increased IEEPA tariff rate (later 2025) | 35% |
| USMCA-qualifying goods status | Exempt from IEEPA tariffs |
| Duty-free treatment removal date for non-qualifying goods | August 29, 2025 |
| Section 232 steel/aluminum tariff (current) | 50% |
| Section 232 copper tariff (current) | 50% |
| Section 232 vehicle/auto parts tariff (current) | 25% |
| Sector under active Section 232 investigation | Timber and lumber |
| US imports from Canada entering duty-free (~$50.5B example period) | Majority, likely via USMCA qualification |
Source: Congressional Research Service “U.S.-Canada Trade Relations” IF12595, updated through March 2026; CRS tariff timeline compiled from US government documents.
Timeline of Major 2025-2026 US Tariff Actions on Canadian Goods
Mar 2025   IEEPA tariffs introduced (25% general, 10% energy/potash)
Mar 2025   Steel/aluminum country exemptions eliminated
Jun 2025   Steel/aluminum tariff doubled to 50%
Aug 2025   Copper tariff (50%) added; duty-free treatment removed for non-USMCA goods
Feb 2026   USTR review activity noted
Jul 2026   Mandatory USMCA six-year review begins
The stated rationale behind the IEEPA tariffs, first imposed in March 2025, centered on a declared national emergency tied to the US-Canada border and concerns about illicit fentanyl trafficking, a justification that has remained the formal legal basis for the broader tariff regime even as it expanded into unrelated sectors like steel, aluminum, copper, and autos through separate Section 232 authority. The escalation from an initial 25% rate to 35% later in 2025, paired with the removal of duty-free treatment for non-USMCA-qualifying goods at the end of August, meaningfully raised the cost of doing business for Canadian exporters who couldn’t establish USMCA compliance for their specific shipments.
The critical mechanism protecting much of the relationship’s underlying trade volume is USMCA qualification: goods that meet the agreement’s rules-of-origin requirements remain exempt from the IEEPA-based tariffs specifically, even though they’re not shielded from the separate Section 232 sectoral tariffs on metals and autos. This dual-track tariff structure — one set of duties tied to the fentanyl-related national emergency declaration, another tied to sector-specific national security justifications — has made 2026 an unusually complex year for US importers of Canadian goods to navigate, since a single shipment’s tariff exposure can depend on both its USMCA status and its specific product category simultaneously.
USMCA Review and Trade Policy Outlook for 2026
| USMCA/Policy Metric | Figure |
|---|---|
| Mandatory USMCA review start date | July 2026 |
| Review frequency under the agreement | Every 6 years |
| Potential agreement extension term if renewed | 16 years |
| Risk if extension isn’t agreed upon | Agreement termination possible by 2036 |
| Key negotiation topics expected | Auto content rules, steel/aluminum tariffs, energy export terms |
| US FDI stock in Canada (2024, latest available) | $459.6 billion |
| Canada’s rank as source of US FDI | 2nd-largest, at $732.9 billion |
| US position as source of Canada’s FDI | Largest, by stock |
Source: CargoTrans Canada Tariffs guide, June 2026; Congressional Research Service US-Canada Trade Relations, March 2026; Bureau of Economic Analysis and Statistics Canada FDI data.
USMCA Review Timeline and Stakes
2026 (Jul)   ● Mandatory 6-year review begins
2026-2027    ○ Negotiations over autos, tariffs, energy terms
Extension    → 16-year renewed term if agreed
No deal      → Possible termination pathway toward 2036
The mandatory USMCA review, set to begin in July 2026, arrives at a genuinely consequential moment for the agreement, since the current tariff disputes over autos, steel, aluminum, and energy will form the substantive core of what negotiators actually discuss. Because the review only happens once every six years and any extension would lock in another 16-year term, the stakes for getting this round of negotiations right — or at least avoiding a breakdown — are considerably higher than a routine trade policy check-in, with failure to reach agreement theoretically opening a path toward the agreement’s termination as early as 2036.
Beyond the flow of goods themselves, the depth of foreign direct investment between the two countries — with the US holding $459.6 billion in Canadian FDI stock and Canada holding an even larger $732.9 billion in US FDI stock — underscores just how much is riding on the review’s outcome beyond simple tariff schedules. Businesses on both sides of the border have already had to overhaul risk management and supply chain strategies in response to the current tariff environment, and the review represents the first formal opportunity to either stabilize or further complicate the rules governing a trade relationship that, even after 2025’s declines, still moves over $870 billion in combined goods and services annually. Readers wanting the fuller tariff picture across all of America’s trading partners, not just Canada, can find additional detail in the US global tariff statistics, which tracks how the current tariff regime compares across different countries and trade blocs.
US-Canada Trade in Broader Context 2026
| Broader Trade Context Metric | Figure |
|---|---|
| Canada’s rank among all US trading partners (goods + services) | 2nd-largest |
| Canada’s rank as source of US goods imports specifically (2024) | 3rd-largest, $412 billion |
| Canada’s rank as destination for US goods exports | 1st, $350 billion (2024) |
| US agricultural exports to Canada | Over $30 billion |
| Canadian agricultural exports to US | Over $40 billion |
| Canada’s exports directed to the US (2025, Statistics Canada) | 73% of total Canadian goods exports |
| Canada’s imports sourced from the US (2025) | 46% of total Canadian goods imports |
| Total US-Canada trade value comparison basis | Consistently among the top 2 US global partners |
Source: US Census Bureau; Office of the US Trade Representative Canada country profile; Statistics Canada bilateral trade data, 2025.
Directionality of Trade: How Dependent Is Each Country on the Other?
Canada's exports going to the US        ██████████████████████████████ 73%
US goods imports coming from Canada     ████████████ ~13-15% of total US imports
Zooming out to the full trading relationship, the striking asymmetry becomes clear: Canada sends 73% of everything it exports to the United States, while the US directs a much smaller, though still substantial, share of its own trade toward Canada. This dependency imbalance is precisely why Canadian policymakers have approached the 2025-2026 tariff disputes with such urgency — losing preferential or even standard access to the US market carries far greater proportional consequences for Canada’s economy than the reverse holds true for the United States, even though Canada remains genuinely important to the US as its top export destination and third-largest import source.
The agricultural trade figures offer a useful counterpoint to the energy- and metals-dominated headlines, since both countries export more than $30-40 billion in food products to each other annually, spanning everything from US bakery goods, cereals, and fresh produce heading north to Canadian beef, processed fruits and vegetables, and vegetable oils heading south. This two-way agricultural flow, largely insulated from the sectoral tariff disputes dominating energy and metals, illustrates that even amid genuine trade tension, large segments of the US-Canada relationship continue operating on the integrated, tariff-light basis the original NAFTA and later USMCA frameworks were designed to preserve. For a more complete accounting of how this fits into overall US import and export patterns across all product categories and countries, the trade statistics in the US offer useful additional context on where Canada ranks relative to America’s other major trading relationships.
Disclaimer: This research report is compiled from publicly available sources. While reasonable efforts have been made to ensure accuracy, no representation or warranty, express or implied, is given as to the completeness or reliability of the information. We accept no liability for any errors, omissions, losses, or damages of any kind arising from the use of this report.