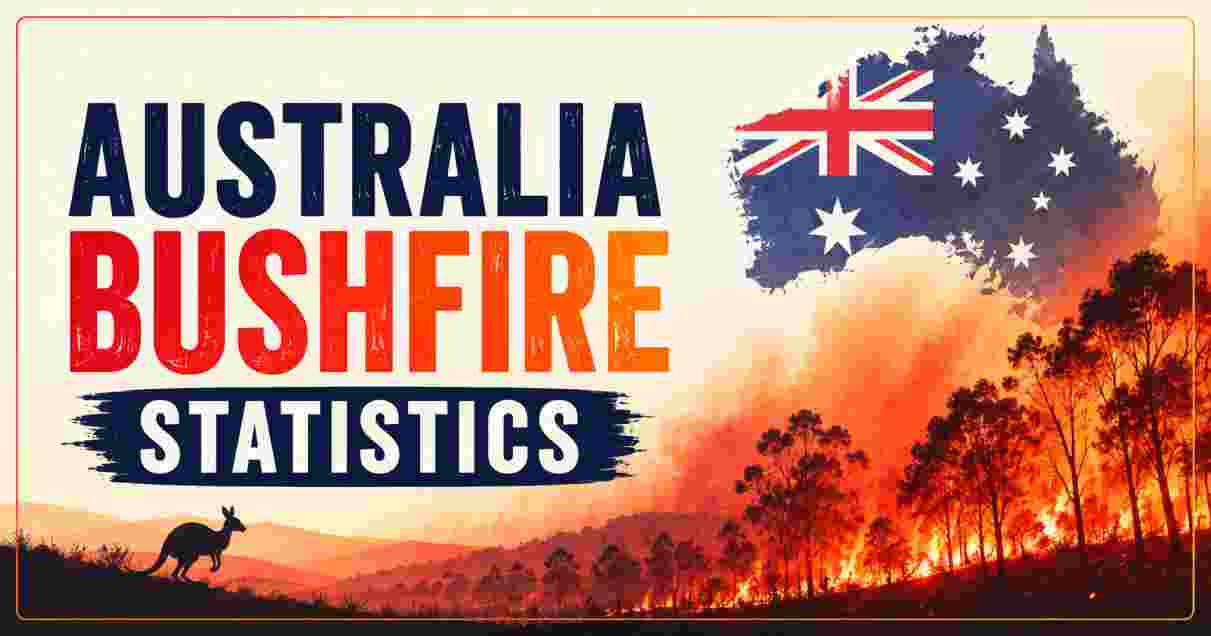
Australia Bushfire Season 2026
The 2025–26 Australian bushfire season ran from August 2025 through May 2026 and delivered what fire scientists and emergency managers had been warning about for years — not a repeat of the catastrophic 2019–20 Black Summer, but a sharp and costly reminder that the climate conditions capable of producing mass-casualty fire events can re-align at speed even outside the most extreme drought years. The season resulted in 5 deaths, at least 959 structures destroyed (approximately 386 homes and 562 outbuildings), and hundreds of thousands of hectares burned across multiple states. Its defining chapter was the January 2026 Victorian crisis, when a severe heatwave with temperatures exceeding 40°C for consecutive days, combined with critically low soil moisture and wind gusts reaching 100 km/h, triggered some of the most dangerous fire weather conditions seen since Black Summer. A State of Disaster was declared across 18 local government areas in Victoria — the most significant emergency declaration in the state since 2019–20 — as fires in Longwood, Walwa, and Ravenswood burned simultaneously and fire fronts advanced simultaneously from multiple directions. By January 13, 2026, more than 400,000 hectares had burned in Victoria alone — an area more than five times the size of Singapore.
What makes the 2026 season significant in the long arc of Australian bushfire history is not its raw numbers, which fall well short of Black Summer’s devastating benchmarks, but what it reveals about the new normal of fire risk on the continent. The AFAC (Australasian Fire and Emergency Service Authorities Council) had already flagged elevated risk across most of Victoria before the season began, with critically low soil moisture after an extended dry period across Victoria and New South Wales. Meteorologists described the January 2026 conditions as the most dangerous fire weather since 2019–20. Moody’s analytics — analysing the season in a January 2026 report — warned that the key lesson for risk modellers was not the question of scale alone, but how quickly compound drivers can realign: prolonged drought, extreme heat, strong winds, and concurrent ignitions that stretch suppression capacity to its absolute limit. Australia did not need a Black Summer repeat to demonstrate that its fire risk has permanently intensified. The 2025–26 season proved the point with alarming efficiency.
Key Australia Bushfire Facts 2026
| Fact | Detail |
|---|---|
| Current season duration | August 2025 – May 2026 |
| Deaths (2025–26 season) | 5 deaths confirmed |
| Non-fatal injuries (2025–26) | 1 recorded |
| Structures destroyed (2025–26) | ~959 total — approx. 386 homes, 562 outbuildings |
| Victoria area burned (January 2026) | 400,000+ hectares — more than 5× the size of Singapore |
| State of Disaster declared in Victoria | 18 local government areas — January 2026 |
| Largest single fire (Jan 2026, Victoria) | Longwood fire complex — 137,000 hectares |
| Second largest fire (Jan 2026) | Walwa fire — 102,000 hectares |
| Max temperature during crisis | Well above 40°C for consecutive days |
| Max wind gusts | Up to 100 km/h |
| Active fires in Victoria (Jan 13) | ~30 fires — 12 major still burning |
| Official fire warnings issued (Victoria, Jan 2026) | 26 official extreme/catastrophic warnings |
| Season ignition causes | Substantial fuel loads; record heat; climate change; dry lightning; arson |
| Worst-ever season: Black Summer 2019–20 | 24 million hectares burned — 33 direct deaths — 417 indirect |
| Black Summer structures destroyed | 3,000+ buildings — 103,094 homes lost across season (all structures) |
| Black Summer economic damage | Estimated AUD $100 billion total |
| Black Summer insured losses | AUD $2.4 billion (2024 valuation — ICA) |
| Black Summer CO₂ emissions | ~830 million tonnes CO₂-equivalent — 1.5× Australia’s annual emissions |
| Black Summer animals killed or displaced | Estimated 3 billion |
| Australia threatened species list (March 2026) | 2,175 species — a 54% increase since 2000 |
| Black Summer: species with 30%+ habitat burned | 997 species had more than 30% of habitat burned |
| Species listed/uplisted since 2019 linked to Black Summer | More than half of all newly listed species |
| Bushfire seasons with zero structures lost | 2021–22 (1 death, 6 structures); 2022–23 (0 deaths, 39 structures) |
Source: Wikipedia — 2025–26 Australian Bushfire Season (en.wikipedia.org, updated June 2026); Risk Frontiers — January 2026 Victorian Grassfires and Bushfires (riskfrontiers.com, February 2026); BNHRC NSW — Unpacking Science Behind 2025–26 Fire Season (nsw-bnhrc.org, April 2026); Moody’s — Australia’s Bushfire Reality in Early 2026 (moodys.com, January 2026); CTIF International — Australia State of Disaster (ctif.org); Wikipedia — 2019–20 Australian Bushfire Season; wifitalents.com Australian Bushfire Data Reports (February 2026); Australian Geographic — Australia’s Environment 2025 Report (March 2026)
The 2025–26 season statistics tell a story that sits in sobering contrast to the bookend seasons that surrounded it. The 2022–23 season — cushioned by La Niña rainfall — produced just 39 structures destroyed and zero deaths. The 2021–22 season lost only 6 structures and 1 life. Then the 2023–24 season burned approximately 960,000 square kilometres, caused 10 deaths and 171+ structures lost, and the 2024–25 season again saw elevated temperatures — August 2024 was Australia’s warmest August on record — and significant fires in Victoria’s Grampians National Park burning 136,647 hectares. By the time the 2025–26 season arrived, the landscape across southeastern Australia was carrying a compounding moisture deficit, high fuel loads from the good-rainfall seasons of 2021–23, and the structural fire weather intensification that Australia’s warming climate delivers with increasing regularity. The January 2026 crisis was not a surprise to those who had been tracking the accumulating conditions. It was an inevitability.
The 2,175 threatened species on Australia’s federal threatened species list as of March 2026 — a 54% increase since 2000, with climate change identified as a threat to nine in ten of the newly listed species — provides the biodiversity framing without which the bushfire statistics are incomplete. More than half of all species listed or uplisted since 2019 were directly impacted by Black Summer fires. The 2025–26 fires in Victoria, burning an estimated 400,000 hectares in the most cleared state in Australia, added a further layer of habitat destruction on top of that five-year biodiversity recovery challenge. Australia has the highest mammal extinction rate in the world — a record that fire seasons, even those modest by Black Summer standards, continue to worsen.
2025–26 Australia Bushfire Season by State & Territory
2025–26 Season — State-by-State Fire Activity
==============================================

Victoria (Jan 2026)     |████████████████████████████████████████| 400,000+ ha — State of Disaster
New South Wales         |████████████████████████████             | Active Dec 2025; ongoing 2026
Tasmania                |████████████████████████████             | 30+ fires Dec 2025 incl. 3 emergency-level
South Australia         |████████████████████████                 | Active Nov–Jan; firefighter death Nov 2025
Western Australia       |████████████████████                     | Elevated activity ongoing
Queensland              |██████████████████                       | Active throughout season
Northern Territory      |████████████████████                     | Extensive (savanna burning)
ACT                     |█████████                                | Lower risk; minor activity

Season-wide total deaths by state:
South Australia         |████████████████████████████████████████| 1 firefighter (Nov 2025, CFS)
Victoria                |████████████████████████████████████████| 1 civilian confirmed (Longwood)
Other states            |████████████████████████████████████████| Additional deaths recorded
| State / Territory | Key 2025–26 Events | Impact |
|---|---|---|
| Victoria | State of Disaster — 18 LGAs; fires from Jan 2026; peak of season | 400,000+ ha burned; 1+ deaths; ~300+ homes destroyed; 36 fires burning simultaneously |
| Longwood, VIC | Largest single fire in the season | 137,000 ha — 100 km northeast of Melbourne; heatwave-driven spread |
| Walwa, VIC | Second-largest fire | 102,000 ha — northern edge of Victoria near NSW border |
| Ravenswood, VIC | Third major fire complex | 4,100 ha — near Castlemaine and Bendigo |
| South Australia | November 2025 CFS firefighter death at Pinkawillinie Conservation Park | 1 firefighter killed; Tooperang fire (Jan 2026) — 2 homes, 600 ha |
| Tasmania | December 4, 2025 — 30+ fires reported; 3 reached emergency level | Dolphin Sands, Levendale, Glenlusk fires; evacuation centre opened at Swansea |
| New South Wales | Fires active from December 2025; ongoing risk through summer | Concurrent with Victoria; border-zone fires |
| Western Australia | Elevated fire activity — ongoing throughout season | History of major fire events; 9.5M ha burned in 2023–24 season |
| Queensland | Active throughout — particularly northern QLD | High fuel loads from prior wet seasons |
| Northern Territory | Extensive savanna burning — routine but large in scale | Typically 80M+ ha annually (savanna management fires) |
| ACT | Minor activity; lower structural risk | — |
Source: Wikipedia — 2025–26 Australian Bushfire Season (updated June 2026); Risk Frontiers (February 2026); BNHRC NSW (April 2026); CTIF International (January 2026); WSWS — Victoria Fires January 2026 (January 9–13, 2026); Moody’s — Australia Bushfire Reality 2026 (January 21, 2026)
The state-by-state breakdown of the 2025–26 season confirms a pattern that has become increasingly familiar in Australian bushfire management: southeastern Australia bears the brunt of the structural and human cost, even while vast areas of the Northern Territory and northern Queensland burn far more hectares annually through savanna management and lightning-ignited fires that rarely threaten populated areas. Victoria’s January 2026 crisis was the season’s centrepiece — not just in terms of the 400,000+ hectares burned across the state, but in terms of the emergency management scale it demanded: a State of Disaster declaration across 18 local government areas, 26 official extreme and catastrophic fire warnings issued within Victoria alone, and a multi-front fire scenario that stretched the Country Fire Authority (CFA) and Forest Fire Management Victoria (FFMV) across simultaneous campaigns at Longwood, Walwa, Ravenswood, and dozens of smaller fires simultaneously.
The Longwood fire complex near Gobur — approximately 100 kilometres northeast of Melbourne — was the defining individual event of the season. Igniting and growing to more than 100,000 hectares by January 9 through the mechanism of strong northwesterly wind gusts fanning through critically dry vegetation, it claimed at least one confirmed civilian life: Max Hobson, an elderly cattle farmer who died trying to save his herd and was found approximately 100 metres from his vehicle along a remote dirt road. The South Australia fatality in November 2025 — a CFS (Country Fire Service) firefighter who died while attending a scrub fire at Pinkawillinie Conservation Park — was the season’s first death, a reminder that the human cost of bushfire begins with the firefighters who face it before any civilian evacuation order is issued.
Australia Bushfire Historical Comparison in 2026
Australia Bushfire Seasons — Historical Comparison
====================================================

2009 Black Saturday (VIC)  |████████████████                         | 173 deaths; 408 homes; 450,000 ha
2019–20 Black Summer       |████████████████████████████████████████ | 24M ha; 33 deaths; 3,000+ structures
2020–21                    |████████████                             | Moderate; recovery year
2021–22                    |████                                     | 1 death; 6 structures
2022–23                    |████                                     | 0 deaths; 39 structures
2023–24                    |████████████████████████████████████████ | 96M ha (incl. NT); 10 deaths; 171 structures
2024–25                    |████████████████████                     | Grampians 136K ha; 0 deaths
2025–26                    |████████████████████████                 | 400K+ ha (VIC alone); 5 deaths; 959 structures

Scale: Broad relative comparison — NT savanna skews total ha figures significantly
| Season | Fatalities | Structures Destroyed | Area Burned (est.) | Key Events |
|---|---|---|---|---|
| 2009–10 (Black Saturday, VIC) | 173 deaths | 408 homes (VIC alone) | 450,000+ ha | Deadliest Australian bushfire since 1974; 7,562 homeless |
| 2019–20 (Black Summer) | 33 direct / 417 indirect | 3,000+ | ~24 million ha | All-time record; 3 billion animals; $100B damage |
| 2020–21 | Low | Low | Moderate | Recovery season after Black Summer |
| 2021–22 | 1 | 6 | Low | La Niña-cushioned; very low season |
| 2022–23 | 0 | 39 | Low | La Niña continued; lowest recent season |
| 2023–24 | 10 | 171+ | ~96 million ha (incl. NT savanna: 84M ha) | El Niño season; 70%+ burned in WA, QLD, NT |
| 2024–25 | 0 | Unspecified | Elevated | Grampians, VIC — 136,647 ha; warmest Aug on record |
| 2025–26 | 5 | ~959 (~386 homes) | 400,000+ ha (VIC alone) + other states | Victoria State of Disaster; Jan 2026 crisis |
| 10-year average (2015–2025, structures) | Varies | Hundreds per year | Tens of millions ha annually | NT savanna dominates total hectares |
| 2015–16 (worst property loss pre-Black Summer) | 9 | 408 homes | ~299,468 ha | Most destructive since 2008–09 by property loss |
Source: Wikipedia — 2025–26 Australian Bushfire Season (June 2026); Wikipedia — 2019–20 Australian Bushfire Season; Wikipedia — 2023–24 Australian Bushfire Season; Wikipedia — 2015–16 Australian Bushfire Season; Wikipedia — 2009–10 Australian Bushfire Season; BNHRC NSW (April 2026); wifitalents.com Australian Bushfire Data Reports (February 2026)
The historical comparison places the 2025–26 season in proper context: significantly more destructive than the quiet La Niña seasons of 2021–23, broadly comparable to the 2015–16 season in structural loss (which destroyed 408 homes and 9 lives and was at the time considered the worst property-loss season since 2008–09), but still well below the catastrophic benchmarks set by Black Summer and the 2009 Black Saturday fires. The critical nuance in reading Australian bushfire historical data is the dominance of the Northern Territory savanna in total hectares burned: in 2023–24, approximately 84 of the 96 million hectares recorded as burned nationally occurred in the NT through a combination of planned burning and natural fires in remote savanna — a figure that utterly dwarfs southeastern Australia’s impact statistics in area terms, while contributing relatively little to human death tolls or structural losses.
Black Summer remains the defining reference point for every subsequent season — the benchmark against which fire scientists, insurers, emergency managers, and policymakers measure all subsequent risk. The 33 direct deaths and 417 indirect deaths from smoke inhalation and cardiovascular stress that Black Summer produced; the 3,000+ structures destroyed; the estimated 3 billion animals killed or displaced; the AUD $2.4 billion in insured losses (2024 valuation) against a broader economic damage estimate exceeding AUD $100 billion — these numbers have not been repeated. But the 2025–26 season demonstrated that you do not need a Black Summer to cause mass displacement, significant loss of life, hundreds of home destructions, and a fire weather crisis capable of overwhelming every layer of emergency response in the country’s most populous southern states. The question is no longer whether another Black Summer-scale event will occur. It is when.
Climate Change & Australia’s Bushfire Risk in 2026
Australia Climate & Bushfire Risk Drivers — 2026
=================================================

Australia warming rate                |████████████████████████████████████████| Fastest-warming developed country
2019 mean temperature above avg       |████████████████████████████████████████| +1.52°C above average — hottest year on record
2019 rainfall deficit                 |████████████████████████████████████████| 40% below long-term average
Black Summer CO₂ emissions            |████████████████████████████████████████| 830Mt — 1.5× Australia's annual emissions
Threatened species (March 2026)       |████████████████████████████████████████| 2,175 — up 54% since 2000
Species threatened by climate change  |████████████████████████████████████████| 9 in 10 newly listed species
AFAC pre-season flagged elevated risk |████████████████████████████████████████| Critically low soil moisture — VIC, NSW
January 2026 fire weather description |████████████████████████████████████████| "Most dangerous since Black Summer"
| Climate / Risk Driver | Data Point | Source |
|---|---|---|
| Australia’s warming trajectory | Fastest warming among developed countries — hottest continent on Earth | Australian Bureau of Meteorology |
| 2019 mean temperature | +1.52°C above average — Australia’s hottest year on record going into Black Summer | wifitalents.com (February 2026) |
| 2019 rainfall deficit | 40% below long-term average — critical fuel drying pre-Black Summer | wifitalents.com (February 2026) |
| Black Summer CO₂ emissions | ~830 million tonnes CO₂-equivalent — 1.5× Australia’s full annual emissions | Springer Nature / Australian Government |
| January 2026 fire weather characterisation | “Most dangerous fire weather conditions seen since the 2019–20 Black Summer fires” | Risk Frontiers (February 2026) |
| Soil moisture pre-January 2026 fires | Critically low across Victoria and NSW — flagged by AFAC pre-season | Risk Frontiers (February 2026) |
| Temperature during January 2026 crisis | Well above 40°C for consecutive days | Moody’s (January 2026) |
| Wind gusts during January 2026 crisis | Up to 100 km/h — critical fire spread driver | Risk Frontiers / Moody’s (2026) |
| Threatened species list growth | 2,175 species — 54% increase since 2000 (March 2026) | Australian Geographic (March 2026) |
| Climate change: threat to newly listed species | 9 in 10 (90%+) of newly listed threatened species | Australian Geographic (March 2026) |
| Black Summer: species with 30%+ habitat burned | 997 species had more than 30% of habitat burned | wifitalents.com (February 2026) |
| Black Summer: threatened species impacted | More than 300 threatened species affected | Biodiversity Council Australia |
| Species listed since 2019 linked to Black Summer | More than half of all species listed or uplisted | Australian Geographic (March 2026) |
| Australia mammal extinction rate | Highest in the world | Independent Australia (January 2026) |
| Climate change insurance modelling impact | “Future bushfire seasons expected to become more frequent and severe” — challenges insurance models | UNSW Business Think (January 2026) |
| AFAC risk flagging (pre-season Aug 2025) | Increased risk across most of Victoria flagged in AFAC outlook | AFAC August 2025 outlook |
| 2025–26 ignition causes | Substantial fuel loads; record heat; climate change; dry lightning; arson | Wikipedia 2025–26 season |
Source: Risk Frontiers (riskfrontiers.com, February 2026); Moody’s — Australia Bushfire Reality 2026 (moodys.com, January 2026); Australian Geographic — Australia’s Environment 2025 Report (australiangeographic.com.au, March 2026); UNSW Business Think — Economic Cost of Climate Risk (businessthink.unsw.edu.au, January 2026); wifitalents.com — Australian Bushfire Data Reports (February 2026); Biodiversity Council Australia; Wikipedia 2025–26 Season; AFAC August 2025 outlook
The climate science behind Australia’s escalating bushfire risk entered a new phase of clarity in 2026, with the January crisis providing a real-time demonstration of the mechanisms that researchers had been modelling for years. The AFAC seasonal outlook, released in August 2025, had already identified critically low soil moisture across Victoria and New South Wales as the primary pre-season risk factor — soil that should have been replenishing over the cooler months but had instead remained dry following an extended period without significant rainfall. When the January heatwave arrived — with temperatures well above 40°C for consecutive days and wind gusts reaching 100 km/h — the combination produced exactly the fire weather behaviour that the models predicted: rapid fire spread, multiple simultaneous ignitions, fire fronts advancing faster than evacuation orders could be issued, and suppression resources stretched across a geography too large to cover.
Australia’s threatened species trajectory provides the longest-run climate indicator in the entire bushfire dataset. The 54% increase in threatened species since 2000, with climate change identified as the primary threat to 9 in 10 newly listed species, represents the biodiversity ledger of two decades of intensifying fire, drought, heat stress, and habitat fragmentation. More than half of all species listed or uplisted since 2019 were directly impacted by Black Summer — meaning that the single most ecologically damaging event in recorded Australian history is still actively driving species listings six years after the last flame was extinguished. The 2025–26 fires in Victoria, burning across the most highly cleared state in Australia in January 2026, added a new chapter to that story. Professor Euan Ritchie’s assessment was unambiguous: the extent of land clearing in Victoria makes it harder for animals to find suitable habitat after fires, and wildlife mortality in the January 2026 fires was “very significant”, with survivors facing a grim future in an already fragmented landscape.
Black Summer 2019–20 — The Benchmark & Its Legacy in 2026
Black Summer 2019–20 — Defining Statistics
===========================================

Area burned                |████████████████████████████████████████| ~24 million hectares
Homes & structures         |████████████████████████████████████████| 3,000+ destroyed; 103,094 total (incl. all types)
Direct deaths              |████████████████████████████████████████| 33
Indirect smoke deaths      |████████████████████████████████████████| 417
Animals killed/displaced   |████████████████████████████████████████| ~3 billion
Total economic damage      |████████████████████████████████████████| AUD $100 billion (est.)
Insured losses (2024 val.) |████████████████████████████████████████| AUD $2.4 billion
CO₂ emitted                |████████████████████████████████████████| 830Mt — 1.5× annual Aus emissions
Tourism losses             |████████████████████████████████████████| AUD $2.8 billion in total output
Population affected        |████████████████████████████████████████| ~80% of Australians
Total fires                |████████████████████████████████████████| 11,774+
| Black Summer Metric | Data Point |
|---|---|
| Season dates | June 2019 – 31 March 2020 — peak: Dec 2019 – Jan 2020 |
| Total area burned | ~24 million hectares (59 million acres) — approx. size of UK |
| NSW area burned | Over 10 million hectares |
| Victoria area burned | More than 1.5 million hectares |
| Total fires | 11,774+ |
| Direct deaths | 33 |
| Indirect deaths (smoke) | 417 |
| Non-fatal injuries | 4,000+ |
| Evacuated | 63,000+ |
| Structures destroyed | 3,000+ buildings |
| Homes specifically | Over 103,094 homes destroyed across the season |
| Animals killed or displaced | Estimated 3 billion |
| Total economic damage | Estimated AUD $100 billion |
| Insured losses (ICA, 2024 valuation) | AUD $2.4 billion — one of costliest in recorded history |
| Tourism losses | AUD $2.8 billion in total tourism output |
| CO₂ emitted | ~830 million tonnes CO₂-equivalent |
| CO₂ as multiple of annual Aus emissions | 1.5 times Australia’s annual emissions |
| Population affected | Nearly 80% of Australians affected |
| Forest area burned | 21.1 million hectares of Australia’s total forest area |
| Black Summer forest fire as % of national forest | ~35% of Australia’s total forest area affected 2016–2021 |
| Species with 30%+ habitat burned | 997 species |
| Threatened species directly impacted | 300+ threatened species |
| Koala status post-Black Summer | Endangered in NSW, QLD, ACT |
| 2025–26 season vs Black Summer (area) | Fraction of Black Summer’s 24M ha — but conditions can re-align rapidly |
Source: Wikipedia — 2019–20 Australian Bushfire Season; Moody’s — Black Summer Five Years On (moodys.com, August 2025); Moody’s — Australia’s Bushfire Reality in Early 2026 (moodys.com, January 2026); UNSW Business Think — Economic Cost of Climate Risk (January 2026); Springer Nature — Economic Impact of Tourism Shutdown from Black Summer (2024); Australian Geographic (March 2026); wifitalents.com Australian Bushfire Data Reports (February 2026); DAFF — Forest Fire Data (agriculture.gov.au); Biodiversity Council Australia
Black Summer remains, by every metric, the defining event in Australian bushfire history — and in 2026, its legacy is measurable in ways that extend far beyond the raw statistics of its own season. The 417 indirect deaths from smoke inhalation — dwarfing the 33 direct fire deaths — established for the first time in Australian public consciousness that bushfire smoke is itself a mass-casualty public health event, one that reaches millions of people in cities hundreds of kilometres from any flame. The AUD $100 billion in estimated total economic damage includes not just insured losses and property replacement costs but the AUD $2.8 billion in tourism output losses as international and domestic visitors cancelled travel to Australia throughout the fire season and the months of smoke that followed, the productivity losses from the health impacts of smoke on the working population, and the long-run GDP drag from the displacement, psychological harm, and community disruption experienced by the 80% of Australians whose lives were affected in some way.
The carbon ledger of Black Summer is one of its most jarring statistics. Burning approximately 24 million hectares of bush, forest, and parkland produced an estimated 830 million tonnes of CO₂-equivalent emissions — approximately 1.5 times Australia’s entire annual greenhouse gas output in the year before the fires. In a country whose climate policy debates are often framed in terms of national emission reduction targets, Black Summer single-handedly erased years of target progress in a matter of months. The CSIRO bushfire hazard mapping work — cited by the ABC in December 2025 — shows that the areas of Australia facing extreme fire danger have expanded significantly over the past three decades, and continue to expand in step with rising temperatures and shifting rainfall patterns. The 2025–26 season demonstrated that even outside the most extreme drought years, the compound alignment of heat, wind, and soil moisture deficit can produce crisis-level fire conditions in southeastern Australia with virtually no warning time between the deterioration of weather indicators and the ignition of catastrophic fires.
Disclaimer: This research report is compiled from publicly available sources. While reasonable efforts have been made to ensure accuracy, no representation or warranty, express or implied, is given as to the completeness or reliability of the information. We accept no liability for any errors, omissions, losses, or damages of any kind arising from the use of this report.