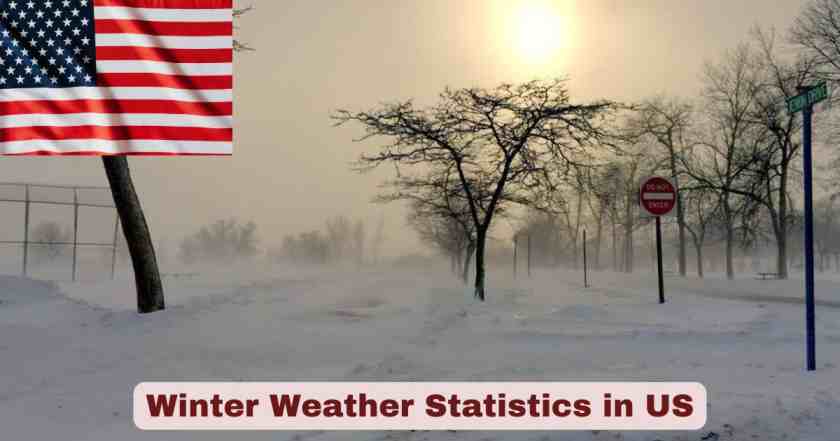
Winter Weather in US 2025
The United States continues to face severe challenges from winter weather conditions throughout the 2024-2025 season, with dramatic increases in both the frequency and intensity of cold-weather events. From devastating ice storms across the Deep South to record-breaking blizzards in the Great Plains, the nation has witnessed some of the most destructive winter conditions in recent memory. The 2024-2025 winter season has brought unprecedented snowfall totals to regions that rarely see significant accumulation, while traditional snow belts have experienced extended periods of dangerous cold that have strained infrastructure and threatened public safety across multiple states.
The economic and human toll of winter weather in the US 2025 has been staggering, with billions of dollars in damages, hundreds of thousands of power outages, and tragically, dozens of lives lost. Federal agencies including the Centers for Disease Control and Prevention, National Oceanic and Atmospheric Administration, and National Weather Service have documented extraordinary conditions that have forced states of emergency declarations, school closures, and massive disruptions to transportation networks. The convergence of climate variability, aging infrastructure, and population growth in vulnerable areas has created a perfect storm of risk factors that have made this winter season particularly dangerous for millions of Americans from coast to coast.
Key Winter Weather Facts and Statistics in the US 2025
| Winter Weather Fact Category | Statistic/Data | Source |
|---|---|---|
| Total Winter Storm Deaths (2024-25 Season) | 55 deaths reported through early 2025 | Wikipedia 2024-25 Winter Season Data |
| Billion-Dollar Winter Disasters (2024) | 2 winter storm/cold wave events exceeding $1 billion each | NOAA NCEI |
| Total Winter Storm Damages (2024-25) | At least $3.38 billion in damages (2025 USD) | NOAA/Wikipedia |
| Historical Winter Storm Events (1980-2024) | 24 winter storm events causing over $1 billion each | NOAA Billion-Dollar Disasters |
| Cold-Related Mortality Rate Increase | Deaths more than doubled from 0.44 to 0.92 per 100,000 people (1999-2022) | JAMA Study/CDC |
| Hypothermia Deaths Nationwide (2023) | Approximately 2,520 deaths from hypothermia | CDC Provisional Data |
| January 2025 Gulf Coast Storm Deaths | At least 10 deaths from unprecedented Southern winter storm | Reuters |
| January 2025 Multi-State Storm Deaths | 6+ deaths from January 3-6, 2025 winter storm | National Weather Service |
| Power Outages from Major Events | Over 400,000 customers lost power in Dallas-Fort Worth alone (March 2025) | Early March 2025 Blizzard Data |
| Average Annual Hypothermia Deaths (Historical) | Approximately 1,300 deaths per year in the United States | CDC Historical Data |
Data compiled from CDC, NOAA National Centers for Environmental Information, National Weather Service, and peer-reviewed studies published in 2024-2025
The data reveals alarming trends in winter weather statistics for the US in 2025, with mortality rates from cold-related causes experiencing unprecedented growth over the past two decades. The doubling of cold-related death rates from 0.44 per 100,000 to 0.92 per 100,000 people between 1999 and 2022 represents a significant public health crisis that has accelerated into 2025. This increase has been attributed to multiple factors including more frequent extreme winter weather events, rising homelessness rates, social isolation among vulnerable populations, and inadequate access to heating resources during severe cold snaps. The 2,520 hypothermia deaths recorded in 2023 marked one of the deadliest years on record, and preliminary data from 2024-2025 suggests this troubling trend is continuing.
The financial impact of winter weather in the US 2025 has been equally devastating, with the 2 billion-dollar winter storm events in 2024 contributing to the fourth-costliest year on record for weather disasters at $182.7 billion total. When examining the historical context, the 24 winter storm events that have exceeded $1 billion in damages since 1980 pale in comparison to the frequency and severity of events occurring in recent years. The $3.38 billion in damages from winter weather events in the 2024-2025 season alone demonstrates how quickly costs accumulate when extreme cold, heavy snow, and ice impact major population centers. States from Texas to Virginia have experienced catastrophic infrastructure failures, with the 400,000+ power outages in the Dallas-Fort Worth metroplex during the March 2025 blizzard serving as a stark reminder of grid vulnerabilities during extreme weather.
Winter Storm Mortality and Deaths in the US 2025
| Death Category | Number of Deaths | Time Period | Key Details |
|---|---|---|---|
| Total Winter Season Deaths | 55 deaths | 2024–2025 winter season | Combined fatalities linked to winter weather events |
| January Gulf Coast Storm | 10 deaths | Jan 21–23, 2025 | Rare Southern winter storm affecting TX, LA, AL, FL |
| Early January Multi-State Storm | 6–7 deaths | Jan 3–6, 2025 | Storm system from Kansas City to Washington, D.C. |
| Missouri Winter Storm Deaths | 4 deaths | January 2025 | Includes public works fatality and crash-related deaths |
| Kansas Weather-Related Deaths | 2 deaths | January 2025 | Fatal vehicle accidents near Wichita |
| 2024 Winter Storm Series | 72 deaths | January 2024 | Nine-state winter storm outbreak |
| Annual Hypothermia Deaths | 2,520 deaths | 2023 | Nationwide cold-related mortality |
| Peak Hypothermia Deaths | 3,500 deaths | 2022 | Highest recorded year for hypothermia fatalities |
| Male vs Female Deaths | 67% male / 33% female | Historical average | Significant gender disparity |
| Most Vulnerable Age Group | Age 75+ | 2021–2023 data | Highest hypothermia mortality rate |
Data sources: CDC National Vital Statistics System, National Weather Service, NOAA, State Emergency Management Agencies
The mortality data for winter weather in the US 2025 paints a sobering picture of the human cost of extreme cold events. The 55 deaths recorded during the 2024-2025 winter season represent only the direct casualties that can be immediately attributed to winter storms, cold exposure, and related accidents. The actual toll is likely much higher when accounting for indirect deaths from medical emergencies exacerbated by cold conditions, carbon monoxide poisoning from improper heating methods, and delayed emergency response times due to hazardous road conditions. The 10 deaths from the unprecedented January Gulf Coast storm alone shocked communities across Texas, Louisiana, Alabama, and Florida that had little experience with severe winter weather, highlighting how vulnerable populations in traditionally warm climates face heightened risks when rare winter events occur.
The demographic breakdown of winter weather deaths in the US 2025 reveals stark disparities that demand urgent public health interventions. The historical pattern showing 67% of hypothermia deaths occurring among males continues, though researchers attribute this to higher rates of homelessness, outdoor occupations, and risk-taking behavior among men. More concerning is the vulnerability of older adults, with people 75 years and older accounting for more than three-quarters of hypothermia deaths in recent years. The 2,520 hypothermia deaths in 2023 and record-breaking 3,500 deaths in 2022 demonstrate an upward trajectory that public health officials warn could continue without significant policy changes. States with the highest mortality rates include those with large rural populations, inadequate heating assistance programs, and growing homelessness crises, with California, Texas, and several Midwest states reporting alarming increases in cold-weather fatalities.
Economic Impact and Damages from Winter Weather in the US 2025
| Economic Impact Category | Cost/Value | Details |
|---|---|---|
| Total 2024 Winter Storm Costs | $182.7 billion | Fourth-costliest year on record for all weather disasters |
| 2024-25 Winter Season Direct Damages | $3.38 billion | Confirmed damages from winter weather events |
| Billion-Dollar Winter Events (2024) | 2 events | Two separate winter storm/cold wave events exceeded $1 billion |
| Historical Winter Storm Costs (1980-2024) | 24 events over $1 billion | Total of 24 winter storms causing billion-dollar damages |
| Winter Storm Uri (2021) Total Cost | $80-$130 billion | Texas deep freeze economic impact estimate |
| Winter Storm Uri Insured Losses | $10-$20 billion | Insurance industry payouts from 2021 event |
| Annual Snow Removal Costs (Federal) | $4 billion | Federal Highway Administration annual expenditure |
| State Daily Economic Losses | $70-$700 million | Per-day losses during winter weather shutdowns |
| Power Outage Impact per Event | 320,000+ customers | Typical major winter storm power disruption |
| Average Disaster Cost Increase | $140 billion per year | Ten-year average for all billion-dollar disasters |
Data compiled from NOAA NCEI, Federal Reserve Bank, Federal Highway Administration, State Emergency Management Reports
The economic devastation from winter weather in the US 2025 extends far beyond the immediate costs of snow removal and emergency response. The $3.38 billion in direct damages from the 2024-2025 winter season represents only a fraction of the true economic impact when factoring in business interruptions, supply chain disruptions, agricultural losses, and long-term infrastructure repair costs. The 2 billion-dollar winter events in 2024 contributed significantly to making it the fourth-costliest year on record at $182.7 billion, demonstrating how winter storms increasingly rank among the nation’s most expensive natural disasters. States across the Great Plains, Midwest, and South have reported unprecedented economic losses from events that paralyzed major metropolitan areas, forced extended school closures, and left critical industries unable to operate for days or weeks at a time.
The lessons from Winter Storm Uri in 2021 continue to inform economic impact assessments for winter weather in the US 2025, as that single event’s $80-$130 billion total cost remains the benchmark for catastrophic winter disasters. The storm exposed critical vulnerabilities in energy infrastructure, water systems, and emergency preparedness that many states have yet to fully address despite investments of billions of dollars. The $10-$20 billion in insured losses from Uri alone placed enormous strain on insurance markets and led to premium increases across multiple states. Current economic models suggest that without significant infrastructure modernization, particularly in electrical grid winterization and water system freeze protection, future winter events could easily exceed these costs. The $4 billion annual federal expenditure on snow and ice removal demonstrates the ongoing baseline cost of winter weather, while the $70-$700 million in daily state losses during severe events highlights how quickly economic damage accumulates when commerce grinds to a halt.
Power Outages and Infrastructure Failures in the US 2025
| Power Outage Statistics | Number of Customers | Event/Location |
|---|---|---|
| Dallas-Fort Worth Metroplex (March 2025) | 400,000+ customers | Early March 2025 blizzard |
| Washington and Oregon (December 2025) | 550,000+ customers | Combined outages from December storm complex |
| Multi-State January Storm (2025) | 320,000 customers | Missouri to Virginia winter storm |
| Virginia Ice Storm (January 2025) | 105,000 customers | Peak outages from freezing rain |
| Nova Scotia (December 2025) | 200,000 customers | Canadian winter storm impact |
| Quebec Province (December 2025) | 87,400 customers | Wind and ice storm outages |
| Connecticut Winter Storm | 21,000+ customers | December 2025 Northeast storm |
| Pacific Northwest (December 2025) | 227,000 customers | Combined Washington, Oregon, California |
| Winter Storm Uri (2021 Reference) | 4.5 million people | Largest controlled load shedding in US history |
| Average Major Event Duration | 12.8 hours | Average longest outage duration (2025 data) |
Data from PowerOutage.us, State Utility Companies, Emergency Management Agencies, J.D. Power Survey
The cascade of power outages from winter weather in the US 2025 has exposed critical weaknesses in the nation’s electrical infrastructure that have been decades in the making. The 400,000+ customer outages in the Dallas-Fort Worth metroplex during the March 2025 blizzard represented one of the most significant winter-related power disruptions in Texas since the catastrophic Winter Storm Uri in 2021. Despite billions of dollars invested in grid hardening and winterization following Uri’s 4.5 million person blackout, the March event demonstrated that many vulnerabilities remain unaddressed. Utility companies across affected regions reported that the combination of heavy ice accumulation, sustained high winds, and equipment failures created conditions that overwhelmed repair crews and left some customers without power for multiple days during life-threatening cold.
The geographic spread of winter weather power outages in the US 2025 has been remarkable, with major disruptions occurring from the Pacific Northwest to the Atlantic Coast. The 550,000+ combined customer outages in Washington and Oregon during December storms highlighted how even regions accustomed to winter weather struggle when events exceed normal parameters. The 320,000 customer outages during the multi-state January storm that swept from Missouri to Virginia forced governors to declare states of emergency and activate National Guard units to assist stranded motorists and conduct wellness checks on vulnerable populations. The 12.8-hour average duration for major outages in 2025 represents a significant increase from the 8.1-hour average in 2022, according to J.D. Power research, with extreme weather events now causing longer disruptions that utilities find increasingly difficult to resolve quickly due to the extent of damage and hazardous conditions that prevent safe repairs.
Hypothermia and Frostbite Statistics in the US 2025
| Cold-Weather Health Impact | Data/Statistics | Time Period/Source |
|---|---|---|
| Total Hypothermia Deaths | 2,520 deaths | 2023 (most recent full-year data) |
| Peak Hypothermia Deaths | 3,500 deaths | 2022 (record year) |
| Cold-Related Mortality Rate Increase | Doubled from 0.44 to 0.92 per 100,000 | 1999-2022 period |
| Historical Annual Average | 1,300 deaths per year | 1999-2011 CDC data |
| Peak Year Historical | 1,536 deaths | 2010 |
| Gender Disparity | 67% male, 33% female | Historical average distribution |
| Highest Risk Age Group | 75+ years old | Three-quarters of deaths in this age group |
| California Hypothermia Deaths (2023) | 166 deaths | Double the number from a decade earlier |
| Rural vs Urban Mortality Rate | 0.93 vs 0.11 per 100,000 | Noncore rural areas show 8x higher rate |
| January Percentage of Annual Deaths | Nearly 20% of annual deaths | Occur in January month alone |
Data compiled from CDC National Vital Statistics System, JAMA Network Studies, State Health Departments, MMWR Reports
The epidemic of hypothermia deaths in the US 2025 represents one of the most preventable yet rapidly growing public health crises facing the nation. The 2,520 hypothermia deaths in 2023 and record 3,500 deaths in 2022 mark a dramatic escalation from the historical annual average of 1,300 deaths, with researchers pointing to the convergence of extreme winter weather events, rising homelessness, and inadequate access to warming centers as primary drivers. The doubling of the cold-related mortality rate from 0.44 to 0.92 per 100,000 people between 1999 and 2022 has alarmed public health officials who note that this increase contradicts expectations in an era of improved weather forecasting, emergency alert systems, and general prosperity. The demographic most affected continues to be adults 75 years and older, who account for more than three-quarters of fatalities due to factors including reduced ability to sense temperature changes, limited mobility to seek shelter, social isolation, and chronic health conditions that impair thermoregulation.
The geographic disparities in hypothermia and frostbite cases in the US 2025 reveal profound inequities in access to adequate shelter and heating resources. The 166 hypothermia deaths in California during 2023, double the number from just ten years earlier, underscore how even states with relatively mild climates face severe cold-weather mortality when vulnerable populations lack access to shelter during temperature drops. The eight-fold higher mortality rate in noncore rural areas (0.93 per 100,000) compared to large central metropolitan areas (0.11 per 100,000) highlights how geographic isolation, limited emergency services, and inadequate heating infrastructure place rural Americans at dramatically elevated risk. The fact that nearly 20% of annual hypothermia deaths occur during the month of January alone points to the concentrated danger of peak winter conditions when temperatures remain dangerously low for extended periods and emergency services become overwhelmed by the volume of cold-related health crises requiring immediate intervention.
Regional Winter Weather Impacts in the US 2025
| Region | Major Impacts | Key Statistics |
|---|---|---|
| Deep South (Gulf Coast) | Historic winter storm with unprecedented snow and ice | 10 deaths, first-ever blizzard warnings in Louisiana coastal areas |
| Great Plains (Kansas/Missouri) | Record snowfall and blizzard conditions | 11 inches in Kansas City (4th highest on record), 2+ deaths |
| Mid-Atlantic (Virginia to DC) | Major ice storm with widespread power outages | 105,000 outages in Virginia alone, states of emergency declared |
| Pacific Northwest | Sustained wind and ice damage | 550,000+ power outages across Washington and Oregon |
| Texas | Multiple winter events threatening grid stability | 400,000 outages in Dallas-Fort Worth from March blizzard |
| Midwest (Illinois/Indiana/Ohio) | Heavy ice accumulation and dangerous travel | Interstate closures, 0.25+ inches of ice in southern regions |
| Northeast (New England) | Record cold and snowfall accumulations | Multiple daily snowfall records broken in major cities |
| Mountain West (Montana/Wyoming) | Hurricane-force winds and blowing snow | Gusts exceeding 100 mph, widespread hazardous conditions |
| Southeast (Alabama/Mississippi) | Severe ice storms with structural damage | Thousands of trees down, prolonged power outages |
| California | Extreme cold in normally mild areas | 166 hypothermia deaths in 2023, double previous decade |
Regional data compiled from National Weather Service offices, state emergency management agencies, local utility reports
The unprecedented scope of winter weather impacts across the US in 2025 has shattered the traditional geographic boundaries that typically define winter storm vulnerability. The historic Gulf Coast winter storm that brought the first-ever blizzard warnings to Louisiana’s coastal areas demonstrated how climate variability now threatens regions with no infrastructure or cultural preparedness for severe winter conditions. Cities like New Orleans, Mobile, and Houston experienced snowfall totals that exceeded their entire historical records, with Mobile receiving 7.5 inches that broke a 130-year-old record and Florida locations recording more than 9 inches of snow—unprecedented in state history. The 10 deaths from this single event highlighted how populations in warm-climate states lack the experience, equipment, and housing stock to safely weather extreme cold, leaving millions vulnerable when temperatures plummet below freezing for extended periods.
The Great Plains and Midwest regions bore the brunt of winter weather in the US 2025, with the 11 inches of snow in Kansas City marking the fourth-highest daily total since records began in 1888. The combination of heavy snow, ice accumulation exceeding 0.25 inches in southern portions, and sustained winds creating blizzard conditions paralyzed major transportation corridors across multiple states. Interstate highways from Missouri to Virginia experienced hundreds of accidents, multi-vehicle pileups, and complete closures that stranded motorists for hours in life-threatening cold. The 105,000 power outages in Virginia from ice storm damage and the 550,000+ outages across the Pacific Northwest demonstrated that even regions with substantial winter weather experience remain vulnerable to extreme events. The 400,000 customers who lost power in the Dallas-Fort Worth area during the March blizzard represented a significant test of Texas grid improvements implemented after Winter Storm Uri, raising ongoing concerns about infrastructure resilience as winter events grow more severe and frequent.
Winter Weather Preparedness and Safety in the US 2025
| Preparedness Category | Recommendations/Statistics | Source/Authority |
|---|---|---|
| Emergency Kit Supplies | 3-day supply of water, non-perishable food, medications, flashlights, batteries | CDC/FEMA Guidelines |
| Home Heating Safety | Never use generators, grills, or camp stoves indoors; carbon monoxide risks | National Fire Protection Association |
| Vehicle Winter Kit | Blankets, food, water, sand/salt, jumper cables, first aid kit | National Weather Service |
| Frostbite Risk Timeline | Exposed skin can develop frostbite in less than 10 minutes at -40°F wind chill | CDC Cold Weather Guidelines |
| Hypothermia Temperature Threshold | Body temperature below 95°F (35°C) constitutes hypothermia | CDC Medical Guidelines |
| Warning Centers Accessed | Over 273 million people (80% of US population) under freeze warnings (January 2025) | NOAA Data |
| Power Outage Preparation | Alternate heating sources, insulated areas, charged devices before storms | Red Cross Guidelines |
| Medication Concerns | Barbiturates, benzodiazepines, and certain antidepressants increase hypothermia risk | CDC/Medical Research |
| Rural Mortality Rate | 8 times higher in rural areas requiring enhanced preparedness | CDC Vital Statistics |
| Layering Recommendations | Multiple loose layers, moisture-wicking base layers, waterproof outer layer | National Weather Service |
Preparedness guidelines from CDC, FEMA, National Weather Service, Red Cross, state emergency management agencies
The critical importance of winter weather preparedness in the US 2025 has been reinforced by the devastating impacts observed throughout this season. With 273 million Americans (80% of the contiguous United States population) experiencing freezing temperatures during peak winter events in January 2025, the need for universal preparedness strategies has never been more urgent. The CDC’s guidance that exposed skin can develop frostbite in less than 10 minutes when wind chills reach -40°F highlights the razor-thin margin for error during extreme cold events. Emergency management officials emphasize that preparedness must be comprehensive, including not just supplies and equipment but also awareness of personal risk factors such as medications that can impair the body’s ability to maintain core temperature, with barbiturates, benzodiazepines, and tricyclic antidepressants among those that increase hypothermia vulnerability.
The eight-fold higher mortality rate in rural areas compared to urban centers underscores the need for targeted winter weather safety campaigns in the US 2025 that address the unique challenges of geographic isolation. Rural residents face longer emergency response times, greater likelihood of extended power outages, and often lack access to public warming centers that urban populations can reach during crises. The National Weather Service’s vehicle winter kit recommendations have proven life-saving during events where hundreds of motorists were stranded on highways for hours, with blankets, high-energy food, water, and sand or salt for traction making the difference between survival and tragedy. Home heating safety remains paramount, as improper use of generators, grills, or camp stoves indoors leads to carbon monoxide poisoning deaths that spike during winter power outages. Public health officials stress that the 95°F body temperature threshold for hypothermia can occur surprisingly quickly even in indoor environments if heating is lost, making early intervention and warming center access critical for vulnerable populations including the elderly, homeless individuals, and those with inadequate home heating systems.
Climate Change and Future Winter Weather Trends in the US 2025
| Climate Trend Category | Observation/Projection | Impact |
|---|---|---|
| Warming Winter Temperatures | Winters warming faster than other seasons in 245 US locations | Paradoxically enables more extreme winter events |
| Polar Vortex Disruptions | Increased frequency of stratospheric warming events | Releases Arctic air masses into mid-latitudes |
| Billion-Dollar Disaster Frequency | Average 23 events per year (2020-2024) vs 9 events historically (1980-2024) | 155% increase in disaster frequency |
| Winter Storm Intensity | More ice storms and freezing rain as temperatures fluctuate near freezing | Infrastructure damage amplified |
| Atlantic Sea Surface Temperatures | Record-to-near-record warmth fueling atmospheric instability | Enhanced moisture for winter precipitation |
| Snowfall Patterns | Traditional snow belts experiencing variable totals, new areas impacted | Geographic expansion of winter weather risk |
| Economic Cost Trajectory | $140 billion average annual disaster costs (last decade) | Projected to increase without adaptation |
| Infrastructure Age | Many components from decades ago not designed for current extremes | Vulnerability increasing faster than upgrades |
| Peak Demand Stress | Winter morning demand peaks coinciding with low renewable output | Grid reliability concerns amplified |
| Population Exposure | Growing populations in Sun Belt states with minimal winter infrastructure | Increasing vulnerability to rare events |
Climate data from NOAA NCEI, Climate Central, university research centers, energy grid operators
The relationship between climate change and winter weather extremes in the US 2025 represents one of the most counterintuitive yet well-documented phenomena in climate science. While overall winter temperatures are warming across 245 analyzed US locations, this warming paradoxically contributes to more frequent and intense winter weather events through disruption of the polar vortex and atmospheric circulation patterns. The increased frequency of stratospheric warming events causes the polar vortex to weaken and split, allowing frigid Arctic air masses that would normally remain locked over the North Pole to spill southward into the United States and affect regions as far south as Texas and Florida. This mechanism explains how record warm global temperatures coexist with devastating winter storms that bring life-threatening cold to millions of Americans.
The economic implications of future winter weather trends in the US 2025 and beyond paint a sobering picture without substantial investment in infrastructure resilience and adaptation measures. The increase from an average of 9 billion-dollar disasters per year historically to 23 per year over the past five years represents a 155% jump that shows no signs of abating. The $140 billion average annual cost of all weather disasters over the last decade includes significant winter storm contributions, with projections suggesting these costs will continue escalating as population growth places more people and property at risk. The aging electrical grid, with many components installed decades ago and not designed for the extremes now regularly occurring, faces particular vulnerability during winter when demand peaks in early morning hours and renewable energy output may be insufficient. The expansion of population centers in Sun Belt states like Texas, Arizona, and Florida creates new vulnerabilities as millions of residents lack experience with winter weather and live in homes built without cold-weather considerations, setting the stage for catastrophic impacts when rare winter events inevitably occur in these growing regions.
Disclaimer: This research report is compiled from publicly available sources. While reasonable efforts have been made to ensure accuracy, no representation or warranty, express or implied, is given as to the completeness or reliability of the information. We accept no liability for any errors, omissions, losses, or damages of any kind arising from the use of this report.