
US Territories in America 2026
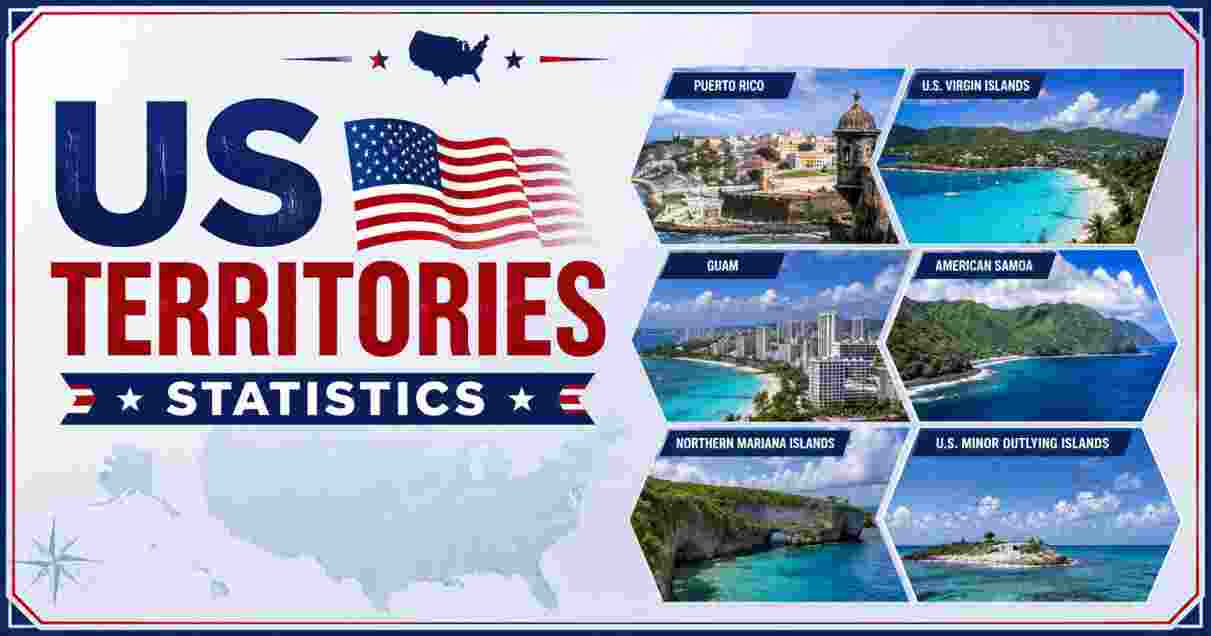
Beyond the 50 states and the District of Columbia, the United States administers 14 territories scattered across the Pacific and Caribbean, home to a combined population of roughly 3.6 to 3.7 million people. Of these, only five territories are permanently inhabited: Puerto Rico, Guam, the U.S. Virgin Islands, American Samoa, and the Commonwealth of the Northern Mariana Islands (CNMI). The remaining nine — including Wake Island, Midway Atoll, Baker Island, and several other remote Pacific outposts — are unincorporated, unorganized, and have no permanent civilian population at all.
Puerto Rico stands apart from every other territory by a wide margin, home to more than 3.2 million residents and accounting for roughly 90% of the entire US territorial population. The four smaller inhabited territories — Guam, the USVI, CNMI, and American Samoa — together held just under 339,000 people at the most recent Island Areas Census, a population smaller than that of Wyoming, the least populous US state. This report compiles the most current, verified statistics on every US territory’s population, land area, economic output, and political status, drawing on the US Census Bureau, the Bureau of Economic Analysis, and the Congressional Research Service.
Interesting Facts About US Territories in 2026
| Fact | Detail |
|---|---|
| Total US Territories | 14 |
| Permanently Inhabited Territories | 5 |
| Combined Territorial Population | ~3.6–3.7 million |
| Most Populous Territory | Puerto Rico (~3.2 million) |
| Least Populous Inhabited Territory | American Samoa (~45,000–50,000) |
| Territories Acquired in 1898–1899 | Puerto Rico and Guam |
| Only Territory in the Southern Hemisphere | American Samoa |
| Territory With No Automatic US Citizenship | American Samoa (US nationals, not citizens) |
| Number of Former Territories That Became States | 31 |
| Federal Statistical Products Covering Puerto Rico | 81 of 449 tracked |
Source: US Census Bureau; Congressional Research Service (CRS Report R48522); WorldPopulationReview; EBSCO Research Starters
The distinction between US territories and states rests on a legal concept known as sovereignty. States share sovereignty with the federal government under the Constitution; territories do not. This means the federal government retains broad authority to explore, exploit, conserve, and manage territorial land in ways it cannot with state land, and it explains why territorial residents, despite paying certain federal taxes and serving in the US military at high rates, lack full voting representation in Congress and cannot vote for president. Four of the five inhabited territories — all but American Samoa and, in certain respects, the USVI — are “organized” under an Organic Act passed by Congress, which grants their residents US citizenship and establishes a formal local government structure.
American Samoa occupies a uniquely distinct legal category among the territories. Its residents are US nationals rather than full US citizens at birth, a status that grants them the right to live and work anywhere in the US but not the right to vote in federal elections even if they relocate to a state, unless they separately naturalize. This arrangement traces back to the territory’s unique governance structure, which preserves a traditional matai (chiefly) system alongside its American-style local government, and reflects a 1929 decision by American Samoa’s own leaders to accept US administration on terms that preserved indigenous land tenure and cultural practices more fully than the citizenship-granting Organic Acts applied elsewhere.
Complete List of US Territories in 2026
| Territory | Region | Status | Inhabited? |
|---|---|---|---|
| Puerto Rico | Caribbean | Organized, unincorporated | Yes |
| Guam | Pacific | Organized, unincorporated | Yes |
| US Virgin Islands | Caribbean | Organized, unincorporated | Yes |
| Northern Mariana Islands (CNMI) | Pacific | Organized, unincorporated (Commonwealth) | Yes |
| American Samoa | Pacific | Unorganized, unincorporated | Yes |
| Baker Island | Pacific | Unorganized, unincorporated | No |
| Howland Island | Pacific | Unorganized, unincorporated | No |
| Jarvis Island | Pacific | Unorganized, unincorporated | No |
| Johnston Atoll | Pacific | Unorganized, unincorporated | No |
| Kingman Reef | Pacific | Unorganized, unincorporated | No |
| Midway Atoll | Pacific | Unorganized, unincorporated | No |
| Navassa Island | Caribbean | Unorganized, unincorporated | No |
| Palmyra Atoll | Pacific | Unorganized, incorporated | No |
| Wake Island | Pacific | Unorganized, unincorporated | No |
Source: Geography Worlds; WhereIG
Palmyra Atoll holds a unique distinction on this list: it is the only incorporated territory among the 14, meaning the full US Constitution applies there directly rather than only in part, as is the case with every unincorporated territory. Since no one lives there permanently, this legal distinction has limited practical effect, but it reflects Palmyra’s unusual administrative history as privately owned land later donated to the Nature Conservancy and federal government for conservation purposes, rather than a populated territory acquired through war or treaty like Puerto Rico and Guam.
The remaining uninhabited territories — collectively known as the US Minor Outlying Islands — serve purposes ranging from wildlife refuges to historical military waypoints. Wake Island and Johnston Atoll both played significant roles in World War II and Cold War-era military logistics, while Midway Atoll, site of the pivotal 1942 naval battle, today functions primarily as a National Wildlife Refuge. Navassa Island, the only territory in this uninhabited group located in the Caribbean rather than the Pacific, remains subject to an ongoing sovereignty dispute with Haiti, though the US has administered it since 1857 under the Guano Islands Act.
Puerto Rico Population and Economic Statistics 2026
| Metric | Data |
|---|---|
| Population (2026 estimate) | ~3.2–3.29 million |
| Land Area | 3,459–3,515 square miles (8,870–9,104 km²) |
| Population Density | ~364–372 people/km² |
| GDP (Nominal, 2026) | ~$129–137 billion |
| GDP Per Capita (Nominal, 2026) | ~$40,700 |
| Population Decline, 2010–2020 Census | -11.8% |
| Capital | San Juan |
| Manufacturing Share of GDP | ~50% (led by pharmaceuticals) |
| Pharmaceutical Sector Contribution | ~$40 billion |
| Population Below Poverty Line | ~45% |
Source: Economy of Puerto Rico (Wikipedia); WorldPopulationReview; GeoFactBook; US Census Bureau
Puerto Rico’s economy stands apart from the other territories in both scale and composition. Manufacturing, and pharmaceuticals in particular, accounts for roughly half of the island’s entire GDP, a concentration built over decades of federal tax incentives that drew major drug manufacturers to establish production facilities on the island. The pharmaceutical sector alone contributes an estimated $40 billion to Puerto Rico’s economy, making the island one of the most significant pharmaceutical manufacturing hubs under the American flag, even as manufacturing employment itself has declined relative to the sector’s outsized share of total output.
Puerto Rico’s population trajectory tells a more difficult story than its economic output alone suggests. The island’s population peaked around 2000 at roughly 3.8 million and has declined in nearly every year since, driven by a combination of low fertility, a severe and prolonged economic slump between 2006 and 2017, and sustained outmigration to the mainland United States, particularly accelerating after Hurricane Maria’s devastating 2017 landfall. The 2020 Census recorded an 11.8% population decline from 2010, one of the steepest ten-year drops recorded anywhere in the United States during that period, and the World Population by Country report notes Puerto Rico’s total fertility rate of just 0.94 children per woman now ranks among the lowest recorded anywhere in the world, a factor that continues to shape the island’s demographic future independent of migration trends.
Guam Population and Economic Statistics 2026
| Metric | Data |
|---|---|
| Population (2026) | ~170,200–170,300 |
| Land Area | 210 square miles (544 km²) |
| Population Change, 2010–2020 Census | -3.5% |
| Capital | Hagåtña |
| Largest Municipality | Dededo (~45,000) |
| Highest Point | Mount Lamlam, 406 m (1,332 ft) |
| Primary Economic Drivers | Tourism, US military presence, services |
| Distance from Honolulu | ~2,400 miles (3,800 km) |
| Rank Among 14 Territories by Population | 2nd |
Source: Geo Factbook; StatisticsTimes.com; US Census Bureau 2020 Island Areas Census
Guam functions as the most strategically significant of the smaller Pacific territories, hosting a substantial and growing US military footprint that includes both Andersen Air Force Base and Naval Base Guam. That military presence, alongside tourism drawing heavily from Japan and South Korea, forms the backbone of an economy that has weathered population pressures differently than Puerto Rico — Guam’s population declined by a comparatively modest 3.5% between the 2010 and 2020 Island Areas Censuses, the smallest decline of any of the four smaller Island Areas counted that year, even as the island’s overall population has since begun recovering toward its current estimate of roughly 170,200.
Guam’s status as the southernmost and largest island in the Mariana Islands archipelago places it geographically and administratively distinct from the Northern Mariana Islands despite their shared cultural heritage among the indigenous Chamorro people. This separation dates to the 1898 Spanish-American War, when Spain ceded Guam directly to the United States while selling the remaining Mariana Islands to Germany — a colonial-era administrative split that persists today as two entirely separate US territories rather than one unified island chain.
US Virgin Islands and Northern Mariana Islands Statistics 2026
| Metric | US Virgin Islands | Northern Mariana Islands (CNMI) |
|---|---|---|
| Population (2026 est.) | ~87,000–87,150 | ~46,000–50,255 |
| Population Change, 10-Year (Census) | -14.64% | Volatile — recent single-year swings of +10.81% |
| Median Household Income | ~$40,408 | Data limited |
| Number of Main Islands | 3 (St. Thomas, St. Croix, St. John) | 14 islands, 3 permanently populated (Saipan, Tinian, Rota) |
| Political Status Since | Purchased from Denmark, 1917 | Commonwealth covenant with US, 1978 |
| Congressional Representation | Non-voting delegate | Non-voting delegate |
Source: New York Fed Regional Economy Profile; Macrotrends; Wikipedia (Northern Mariana Islands population)
The US Virgin Islands’ population decline of 14.64% over the most recent ten-year census period represents the steepest proportional population loss of any of the five inhabited territories, driven by a combination of economic stagnation, hurricane damage — particularly from the devastating 2017 hurricane season that struck the Caribbean territories especially hard — and sustained outmigration to the mainland. The territory’s median household income of roughly $40,408 sits well below the US national median, even as it remains comparable to or slightly above Puerto Rico’s own median income levels.
The Northern Mariana Islands present a genuinely unusual demographic pattern among the territories: rather than steady decline, CNMI’s population has swung dramatically year to year, including a striking 10.81% single-year increase in 2024 following a 2.03% decline the year before. This volatility reflects the commonwealth’s small overall population base, where even modest absolute changes in labor migration, military construction activity, or return migration can produce large percentage swings. Only three of the CNMI’s 14 islands — Saipan, Tinian, and Rota — maintain permanent populations, with Saipan alone hosting the overwhelming majority of residents and the territory’s capital.
American Samoa Statistics and Southern Hemisphere Status 2026
| Metric | Data |
|---|---|
| Population (2020 Census) | 49,710 |
| Population Change, 2010–2020 | -10%+ |
| Land Area | 199 km² (77 sq mi) |
| GDP (2018 est.) | ~$636 million |
| Citizenship Status | US national, not automatic US citizen |
| Governance Structure | Matai (chiefly) system alongside elected government |
| US Administration Since | 1900 |
| Hemisphere | Only US territory in the Southern Hemisphere |
Source: US Census Bureau 2020 Island Areas Census; WhereIG; Puerto Rico Report
American Samoa recorded the steepest population decline of any Island Area in the 2020 Census, falling more than 10% from its 2010 total to 49,710 residents — though notably, the Western District of Tutuila Island, home to the territory’s main population center, was the only district to see population growth over that decade, meaning the overall decline was concentrated heavily in the territory’s more remote outer districts. American Samoa’s per-capita income remains the lowest of any US territory, a reflection of an economy historically anchored around tuna canning and public sector employment that has faced sustained competitive pressure from lower-cost processing operations elsewhere in the Pacific.
The territory’s distinctive matai governance system, in which traditional chiefs hold formal authority over communal land and village affairs alongside the territory’s elected governor and legislature, remains legally protected under American Samoa’s own constitution in ways that differentiate it sharply from the more fully Americanized governance structures found in Guam, the CNMI, and the USVI. This preserved traditional structure is directly tied to American Samoa’s unique national-but-not-citizen status, since the territory’s leaders in the early 20th century specifically negotiated terms of US administration designed to protect indigenous land rights and communal governance from the kind of full incorporation that automatic citizenship might have accelerated.
US Territories Economic Comparison Statistics 2026
| Territory | GDP | GDP Year | Primary Industries |
|---|---|---|---|
| Puerto Rico | $129.19–137 billion | 2026 | Pharmaceuticals, manufacturing, tourism |
| Guam | Growth: +2.0% (2019) | 2019 | Military, tourism, services |
| US Virgin Islands | ~$4.3–4.5B (2022 est.) | 2022 | Tourism, rum distilling, financial services |
| Northern Mariana Islands | -19.6% GDP decline | 2018 | Tourism, garment manufacturing (historical) |
| American Samoa | $636 million | 2018 | Tuna canning, government |
Source: US Bureau of Economic Analysis (BEA), States and Territories GDP data; WhereIG
The Bureau of Economic Analysis has produced official GDP figures for the territories only since a 2008 memorandum of understanding, under which the Office of Insular Affairs paid BEA roughly $786,000 annually to develop and maintain territorial GDP accounts — a relatively recent and still-evolving statistical infrastructure compared to the decades of continuous GDP tracking available for the 50 states. This funding arrangement explains why territorial economic data, especially for the four smaller territories, often lags several years behind the most current available figures for Puerto Rico or the states themselves, and why year-over-year comparisons across territories can be difficult to standardize.
Economic volatility has hit the smaller Pacific and Caribbean territories especially hard in recent economic cycles: the CNMI’s GDP fell nearly 20% in a single year (2018), driven substantially by the collapse of the territory’s garment manufacturing sector after federal minimum wage and trade preference changes eroded its cost advantages, while the USVI recorded a real GDP contraction of 1.7% in 2017 amid the same hurricane season that devastated Puerto Rico. These sharp single-year swings, occurring in economies with GDPs measured in the hundreds of millions rather than billions of dollars, illustrate how vulnerable the smaller territories remain to external shocks — a single storm, trade policy shift, or global tourism downturn can move their entire economic output by double-digit percentages in ways that would be far less visible in a larger, more diversified state economy.
US Territories Federal Statistical Coverage Statistics 2026
| Metric | Data |
|---|---|
| Total Federal Statistical Products Assessed (2023) | 449 |
| Products Including Puerto Rico | 81 |
| Products Including US Virgin Islands | 49 |
| Products Including Guam | 45 |
| Products Including American Samoa | 41 |
| Products Including CNMI | 41 |
| Combined Population, 4 Smaller Island Areas (2020 Census) | 338,021 |
| Population Comparison | Smaller than Wyoming (576,851) |
Source: Congressional Research Service (CRS Report R48522), Library of Congress
A 2025 Congressional Research Service report found that federal statistical coverage of the territories remains significantly less comprehensive than coverage of the 50 states, with Puerto Rico included in just 81 of 449 tracked federal statistical products, and the four smaller Island Areas included in fewer still — ranging from 49 products for the USVI down to 41 each for American Samoa and the CNMI. Several widely used federal surveys, including the Current Population Survey, do not cover any of the territories at all, meaning key economic indicators regularly reported for every state — from monthly unemployment rates to detailed household income breakdowns — simply do not exist in comparable form for territorial residents.
Part of this gap traces to a genuine logistical constraint: without a Master Address File for most of the territories comparable to what the Census Bureau maintains for the states, statistical agencies lack the basic infrastructure needed to deliver survey forms, manage field data collection, and conduct routine ongoing measurement the way they do domestically. The Census Bureau instead relies on periodic, standalone Island Areas Censuses — conducted separately from the decennial state census — to produce even basic population and housing counts for American Samoa, Guam, the CNMI, and the USVI, while Puerto Rico, despite its much larger population, is included directly in the standard decennial census and the American Community Survey alongside the states. This uneven infrastructure has direct downstream effects on emergency response planning, federal funding formula calculations, and the tracking of population movement between the territories and the mainland United States, a topic the US Immigration Statistics by Year report addresses in its broader discussion of citizenship and residency data — since territorial-to-mainland relocation is domestic migration rather than international immigration but is measured with far less precision than either category typically receives.
US Territories Military and Strategic Statistics 2026
| Metric | Data |
|---|---|
| Active Military Personnel, Puerto Rico | 2,193 |
| Reserve/National Guard Personnel, Puerto Rico | 16,358 |
| Total DoD-Affiliated Personnel, Puerto Rico | 21,285 |
| Major Guam Installations | Andersen Air Force Base, Naval Base Guam |
| Key Puerto Rico Facility | Fort Buchanan |
| Former Major Naval Station (Reactivating) | Roosevelt Roads (José Aponte de la Torre Airport) |
| Recent Guam Strategic Role | Forward Pacific deterrence posture |
Source: GlobalSecurity.org; Operation Military Kids, 2026 update
Military infrastructure across the territories serves markedly different strategic purposes depending on geography. In the Caribbean, Puerto Rico’s Fort Buchanan has seen renewed infrastructure investment in 2025 and 2026, including new barracks and a modernized operations center, while the former Roosevelt Roads Naval Station — a major installation shuttered in 2004 — has seen a partial reactivation of its airfield for training, staging, and joint exercises involving Marine Corps and Air Force units, including F-35 rotations. This renewed activity reflects Puerto Rico’s continued strategic relevance for Caribbean readiness and humanitarian response operations, even without the large permanent combat garrison the island hosted during the Cold War.
In the Pacific, Guam’s military significance operates on an entirely different scale, serving as a forward operating hub central to US deterrence posture in the western Pacific given its position roughly equidistant between Hawaii and mainland Asia. The territory’s dual Air Force and Navy installations support both strategic bomber rotations and submarine operations, making Guam one of the most consequential pieces of US military infrastructure anywhere outside the 50 states, a strategic weight documented further in the US Warships Statistics report covering the broader naval fleet these Pacific and Caribbean territorial bases support — a role that continues to shape both federal investment in the territory and the composition of its local economy, where military spending ranks alongside tourism as a primary economic driver documented earlier in this report.
Disclaimer: This research report is compiled from publicly available sources. While reasonable efforts have been made to ensure accuracy, no representation or warranty, express or implied, is given as to the completeness or reliability of the information. We accept no liability for any errors, omissions, losses, or damages of any kind arising from the use of this report.