Parkinson’s Disease in the United States in 2026
Parkinson’s disease (PD) is the fastest-growing neurological disorder in the world — a distinction that carries an enormous and often invisible human cost. In the United States today, an estimated 1.1 million people are living with Parkinson’s disease, making it the second most common neurodegenerative condition after Alzheimer’s disease. But the raw prevalence figure only tells part of the story. A landmark 2022 study backed by the Parkinson’s Foundation revealed that nearly 90,000 Americans are newly diagnosed with Parkinson’s every year — a figure representing a 50% increase from the previously accepted estimate of 60,000 annual diagnoses. That upward revision was not an anomaly; it was a correction of outdated assumptions, and it has forced researchers, health systems, and policymakers to confront the reality that the scale of this disease in the US has been systematically underestimated for years. By 2030, the number of Americans living with PD is projected to reach 1.2 million, and by 2050, global projections from a March 2025 BMJ study place the worldwide figure at 25 million — a 112% increase from 2021.
What makes the 2026 picture especially urgent is the economic dimension. A comprehensive report released by The Michael J. Fox Foundation for Parkinson’s Research on March 26, 2026 found that the total annual cost of Parkinson’s disease in the United States reached $82.2 billion in 2024 — already surpassing what researchers had projected for 2037, more than a decade ahead of schedule. Without meaningful intervention, that figure is projected to exceed $112 billion by 2045. The disease affects not just patients but their entire families and support networks, with the majority of costs — $58.4 billion — falling under indirect and non-medical categories: lost income, unpaid caregiver time, home modifications, and productivity loss. Parkinson’s disease is no longer a condition that can be adequately addressed through the healthcare system alone; its scale demands a coordinated national response that has, so far, not matched the pace of the disease’s spread.
Parkinson’s Disease Statistics in the US 2026 — Key Facts First
Before the data, here are the facts about Parkinson’s disease in the United States that cut through the noise.
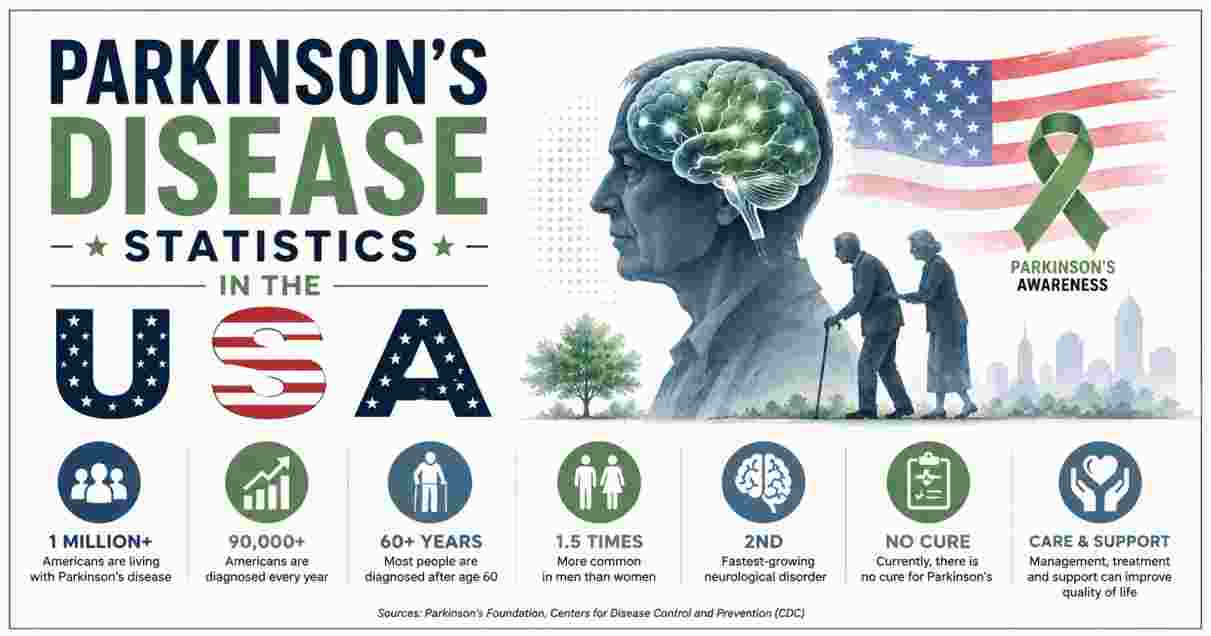
PARKINSON'S DISEASE IN THE US — FAST FACTS 2026
━━━━━━━━━━━━━━━━━━━━━━━━━━━━━━━━━━━━━━━━━━━━━━━━━━━━━━━━━
  ★  1.1 million Americans currently living with PD
  ★  ~90,000 new diagnoses every year — up 50% from prior estimates
  ★  2nd most common neurodegenerative disease in the US
  ★  Men are 1.5x more likely to develop PD than women
  ★  Total US economic cost: $82.2 billion in 2024
  ★  $58.4 billion = indirect/non-medical costs alone
  ★  Cost will exceed $112 billion by 2045 without intervention
  ★  Average age of onset: 60 years old
  ★  4% of PD cases are diagnosed before age 50
  ★  ~90% of PD patients' care is covered by Medicare
━━━━━━━━━━━━━━━━━━━━━━━━━━━━━━━━━━━━━━━━━━━━━━━━━━━━━━━━━
| Parkinson’s Disease US 2026 Key Fact | Detail |
|---|---|
| 90,000 new diagnoses per year — a 50% revision | A 2022 Parkinson’s Foundation-led study revealed annual US diagnoses are ~90,000, a 50% jump from the previously accepted 60,000 — caused by improved detection and an aging population |
| Economic cost already at 2037-projected levels | The $82.2 billion 2024 cost already surpasses what researchers projected for 2037 — arriving more than a decade ahead of schedule |
| Men 1.5x more likely to develop PD | The male-to-female incidence ratio for PD is consistent across every age group and geographic region; estrogen is believed to be a partial protective factor in women |
| Average onset age is 60 — but 4% diagnosed before 50 | While PD is strongly age-associated, early-onset PD (before age 50) affects a meaningful minority and carries distinct clinical and social challenges |
| Paraquat — a US-approved herbicide — still linked to PD | Paraquat is banned in 70+ countries including the EU and China due to its Parkinson’s link, yet remains legally approved for agricultural use in the United States |
| 90% of hereditary PD genes unknown until recently | Only ~10% of PD cases are hereditary; 90% are idiopathic (no identified single cause). Roughly 20 genes have now been linked to increased PD risk |
| Fastest-growing neurological disorder globally | PD is growing faster than Alzheimer’s disease in terms of incidence rate increase — driven primarily by aging populations and environmental chemical exposures |
| State-level death rates range from 47.7 to 102.1 per 100,000 | CDC 2024 data shows more than a 2x difference in PD mortality rates between the highest and lowest-ranking US states — reflecting geographic, occupational, and racial disparities |
| $25 billion+ cost to American taxpayers in 2024 | Social Security payments, Medicare, Medicaid, and disability programs collectively cost the US government over $25 billion attributable to PD in 2024 alone |
| Global PD cases projected to hit 25 million by 2050 | A March 2025 BMJ study projects a 112% increase in global PD cases from 2021 to 2050 — making it one of the largest coming public health crises in neurology |
Source: Parkinson’s Foundation, Michael J. Fox Foundation Economic Burden Report (March 26, 2026), CDC NCHS (March 6, 2026), Johns Hopkins Medicine, APDA, The BMJ (March 2025)
Two facts from this table deserve particular attention for anyone trying to understand the 2026 state of Parkinson’s disease in America. First, the 50% revision in annual diagnoses — from 60,000 to 90,000 — did not happen because PD suddenly got worse. It happened because the previous estimate was based on outdated methodology and excluded certain populations, including racial minorities and people in lower-income zip codes who were less likely to have received a formal diagnosis. The true incidence was always higher; data collection finally caught up. Second, the paraquat situation is a rare instance where public health science and regulatory policy are in direct, documented conflict: a herbicide that is banned in over 70 countries because of its established links to PD neurodegeneration remains in active use in American agriculture, and advocates alongside the Parkinson’s Foundation have repeatedly petitioned the EPA to revoke its approval — so far without success.
The broader picture is of a disease whose trajectory is being shaped by three converging forces: an aging US population that brings more people into peak PD risk age every year, environmental chemical exposures that are difficult to regulate and often have decade-long latency before neurological symptoms emerge, and a care system in which approximately 50% of PD patients see only a community neurologist and just 9% see a movement disorders specialist — the most equipped clinicians to manage the disease’s complexity.
Parkinson’s Disease US 2026 — Prevalence & Incidence Statistics
US PARKINSON'S DISEASE PREVALENCE — OVER TIME & PROJECTIONS
━━━━━━━━━━━━━━━━━━━━━━━━━━━━━━━━━━━━━━━━━━━━━━━━━━━━━━━━━━━━━━━━
US People Living with PD (Millions)
2014   ~0.68M   ████████████████████████████████████
2020   ~0.93M   ████████████████████████████████████████████████
2024   ~1.10M   █████████████████████████████████████████████████████████
2030   ~1.20M   ████████████████████████████████████████████████████████████ (projected)

Annual New Diagnoses (US)
Previous estimate:  60,000/year  ██████████████████████████████
Revised 2022 data:  90,000/year  ███████████████████████████████████████████████ (+50%)
━━━━━━━━━━━━━━━━━━━━━━━━━━━━━━━━━━━━━━━━━━━━━━━━━━━━━━━━━━━━━━━━
| Prevalence / Incidence Metric | Value | Source |
|---|---|---|
| Americans currently living with PD | 1.1 million | Parkinson’s Foundation, 2024 |
| Projected US PD population by 2030 | 1.2 million | Parkinson’s Foundation |
| New US diagnoses per year | ~90,000 | Parkinson’s Foundation-backed study, 2022 |
| Prior annual diagnosis estimate (revised) | 60,000 | Pre-2022 figures — now confirmed as undercount |
| Increase in annual diagnosis rate | +50% from previous estimate | Parkinson’s Foundation |
| Global PD population | ~11.8 million | UF Health, 2026 |
| Global PD projection by 2050 | 25 million+ | BMJ study, March 2025 |
| Global increase 2021–2050 | 112% projected rise | BMJ study, March 2025 |
| PD prevalence per 100,000 (over-80s) | 1,903 per 100,000 | NIH / PubMed |
| PD prevalence per 100,000 (ages 40–49) | 41 per 100,000 | NIH / PubMed |
| PD as leading cause of global disability | Yes — among all neurological disorders | WHO / GBD 2023 |
Source: Parkinson’s Foundation Prevalence & Incidence page, UF Health (April 2026), BMJ (March 2025), NIH PubMed
The prevalence data for Parkinson’s disease in 2026 makes clear that this is not a condition affecting a narrow slice of the US population — 1.1 million people is roughly equivalent to the entire population of Dallas, Texas. What is perhaps more striking is how the number is growing: the trajectory from 930,000 in 2020 to 1.1 million in 2024 represents an increase of approximately 170,000 cases in four years, driven almost entirely by demographic aging rather than any change in individual risk behaviour. As the Baby Boomer generation moves fully into the 70s and 80s — where PD prevalence reaches 1,903 per 100,000 — the 2030 projection of 1.2 million looks conservative rather than alarming. The 41 per 100,000 prevalence in the 40–49 age group versus 1,903 per 100,000 in the over-80s is a nearly 46-fold difference and illustrates why age is the single most dominant risk factor in the disease’s epidemiology.
The 50% revision in annual new diagnoses — from 60,000 to 90,000 per year — carries significant downstream consequences for health system planning. If 30,000 more Americans are being diagnosed with PD annually than the system had been calibrating for, that means neurologists, movement disorder specialists, physical therapists, occupational therapists, social workers, and caregiver support networks are all operating at greater strain than previously modelled. The Parkinson’s Foundation has explicitly noted that this revised figure underscores the need for policy makers to confront an increasing clinical services burden — a burden that is structurally worsening each year the gap between resource allocation and true patient volume goes unaddressed.
Parkinson’s Disease US 2026 — Mortality Statistics
PARKINSON'S DISEASE DEATH RATES — US TRENDS (Adults 65+)
━━━━━━━━━━━━━━━━━━━━━━━━━━━━━━━━━━━━━━━━━━━━━━━━━━━━━━━━━━━━━━━━
Deaths per 100,000 (Age-Adjusted, 65+)
2014   57.2   ████████████████████████████████████████
2019   ~70.0  ████████████████████████████████████████████████████
2021   76.3   ████████████████████████████████████████████████████████
2024   72.0   ████████████████████████████████████████████████████

State-Level Range (2024):  47.7 — 102.1 per 100,000
Males vs Females: Men consistently HIGHER across ALL age groups
Race: White non-Hispanic adults = HIGHEST death rate
━━━━━━━━━━━━━━━━━━━━━━━━━━━━━━━━━━━━━━━━━━━━━━━━━━━━━━━━━━━━━━━━
| US PD Mortality Metric | Value | Source / Date |
|---|---|---|
| Age-adjusted PD death rate (65+, 2024) | 72.0 per 100,000 | CDC NCHS / National Vital Statistics System, 2024 |
| Age-adjusted PD death rate (65+, 2021 peak) | 76.3 per 100,000 | CDC NCHS |
| Age-adjusted PD death rate (65+, 2014) | 57.2 per 100,000 | CDC NCHS |
| 2024 rate vs. 2021 peak | Declined — lower in 2024 than 2021 | CDC NCHS, March 6, 2026 |
| State-level PD death rate range (2024) | 47.7 to 102.1 per 100,000 | CDC NCHS |
| Male vs. female mortality | Men higher in ALL age groups (65–74, 75–84, 85+) | CDC NCHS, 2024 |
| Highest racial group mortality | White non-Hispanic adults | CDC NCHS, 2024 |
| White mortality rate (2019) | 9.7 per 100,000 | AAN Press Release |
| Hispanic mortality rate (2019) | 6.5 per 100,000 | AAN Press Release |
| Black / African American mortality rate (2019) | 4.7 per 100,000 | AAN Press Release |
| Total US PD-related deaths 1999–2022 | 947,272 | NIH / PubMed, NCBI |
Source: CDC NCHS Stats of the States (March 6, 2026), Medical Xpress (June 2026), AAN, NIH PubMed
The 2024 mortality data from the CDC contains one genuinely encouraging signal amid an otherwise difficult trend: the age-adjusted Parkinson’s death rate among adults 65 and older has declined from its 2021 peak of 76.3 to 72.0 per 100,000 — a meaningful reduction of 4.3 deaths per 100,000 in just three years. Researchers believe this is partly attributable to improved care protocols, wider adoption of deep brain stimulation (DBS), and better management of the complications — particularly falls, pneumonia, and cardiovascular events — that cause PD-related deaths. However, the longer trend line remains troubling: the rate in 2024 (72.0) is still 26% higher than it was in 2014 (57.2), reflecting the compounding pressure of an aging population arriving into peak PD risk age faster than clinical infrastructure can scale.
The more than 2x difference between the lowest and highest state-level death rates — from 47.7 to 102.1 per 100,000 — is one of the most under-discussed disparities in US neurology. The variation reflects a combination of factors: occupational pesticide exposure concentrated in agricultural states, access to movement disorders specialists clustered in urban academic centres, racial composition, and quality of long-term care infrastructure. The racial mortality gap — where White non-Hispanic adults carry the highest PD death rate at 9.7 per 100,000 while Black Americans record just 4.7 per 100,000 — is likely explained at least in part by differential diagnosis rates rather than differential disease prevalence. Research consistently shows that Black and Hispanic patients are less likely to see an outpatient neurologist due to socioeconomic barriers, meaning they may be dying from PD-related complications that are recorded under different primary causes of death.
Parkinson’s Disease US 2026 — Statistics by Gender & Age
PD INCIDENCE & PREVALENCE — GENDER AND AGE BREAKDOWN
━━━━━━━━━━━━━━━━━━━━━━━━━━━━━━━━━━━━━━━━━━━━━━━━━━━━━━━━━━━━━━━━
GENDER RISK RATIO
Men    1.5x more likely  ████████████████████████████████████████████████████
Women  1.0x (baseline)   ████████████████████████████████

AGE-SPECIFIC PREVALENCE (per 100,000)
Ages 40–49     41    █████
Ages 50–59    ~150   ██████████████████
Ages 60–69    ~400   ████████████████████████████████████████████████
Ages 70–79    ~900   ████████████████████████████████████████████████████████████████
Ages 80+     1,903   ████████████████████████████████████████████████████████████████████████████████
━━━━━━━━━━━━━━━━━━━━━━━━━━━━━━━━━━━━━━━━━━━━━━━━━━━━━━━━━━━━━━━━
| Gender / Age Metric | Value | Source |
|---|---|---|
| Male-to-female PD incidence ratio | Men 1.5x more likely | Parkinson’s Foundation |
| Average age of PD onset | 60 years old | Johns Hopkins Medicine |
| Early-onset PD (diagnosed before age 50) | ~4% of all PD cases | Parkinson’s Foundation |
| PD prevalence ages 40–49 | 41 per 100,000 | NIH PubMed |
| PD prevalence ages 80+ | 1,903 per 100,000 | NIH PubMed |
| Ratio: 80+ vs. 40–49 prevalence | ~46x higher in 80+ age group | NIH PubMed |
| Male age-standardised incidence rate (global) | 18.52 per 100,000 | BMJ Open, April 2025 |
| Female age-standardised incidence rate (global) | 12.92 per 100,000 | BMJ Open, April 2025 |
| Likely protective factor in women | Estrogen — linked to higher dopamine levels | Johns Hopkins / AAN |
| Age group with fastest-rising prevalence | 85+ — growing with aging demographics | CDC / Parkinson’s Foundation |
Source: Parkinson’s Foundation, Johns Hopkins Medicine, NIH PubMed, BMJ Open (April 2025), CDC
The gender disparity in Parkinson’s disease is one of the most consistent findings in the disease’s epidemiology across every country, every race, and every age group studied. Men are 1.5 times more likely to develop PD than women — a ratio that appears in virtually every major epidemiological dataset and holds across the full age distribution. The leading biological hypothesis involves estrogen, which is associated with higher dopamine levels in the parts of the brain that control motor responses, potentially offering women a degree of neuroprotection. This theory is supported by the observation that women who undergo early menopause — and therefore lose estrogen protection earlier — show higher PD rates than women who reach natural menopause. The global age-standardised incidence rate of 18.52 per 100,000 in men versus 12.92 per 100,000 in women from the April 2025 BMJ Open study confirms the gap is not a US-specific artefact.
The age-prevalence curve is perhaps the most important data set for understanding PD’s trajectory. The jump from 41 per 100,000 in the 40–49 age group to 1,903 per 100,000 in the 80+ group is a 46-fold increase in prevalence across four decades of life — a steeper age-dependency than almost any other major chronic disease. For the 4% of PD patients diagnosed before age 50 — early-onset PD — the clinical picture is meaningfully different: genetic factors play a larger role (more likely to involve LRRK2 or PINK1 gene mutations), the disease tends to progress more slowly, and the social and economic consequences are more severe because these are people in the middle of their careers and family-building years. Approximately 1.79 million of the estimated US PD population have been living with the diagnosis for an extended period, many of them in the most demanding care stages of the disease.
Parkinson’s Disease US 2026 — Economic Cost Statistics
TOTAL US COST OF PARKINSON'S DISEASE — 2024 BREAKDOWN ($82.2B)
━━━━━━━━━━━━━━━━━━━━━━━━━━━━━━━━━━━━━━━━━━━━━━━━━━━━━━━━━━━━━━━━
Direct Medical Costs           $23.8B   ██████████████████████████████
Indirect & Non-Medical Costs   $58.4B   ████████████████████████████████████████████████████████████████████████

Of the $23.8B direct medical costs:
  ~90% covered by Medicare/Medicaid   ████████████████████████████████████████████████
  Taxpayer cost (SS, Medicare etc.):  $25B+

PROJECTED TOTAL COST TRAJECTORY:
2024:  $82.2B  ████████████████████████████████████████
2025:  $84.4B  █████████████████████████████████████████
2035: $102.8B  █████████████████████████████████████████████████████
2045: $112.4B  ████████████████████████████████████████████████████████████
━━━━━━━━━━━━━━━━━━━━━━━━━━━━━━━━━━━━━━━━━━━━━━━━━━━━━━━━━━━━━━━━
| US PD Economic Cost Metric | Value | Source |
|---|---|---|
| Total US annual cost of PD (2024) | $82.2 billion | Michael J. Fox Foundation, March 26, 2026 |
| Direct medical costs (2024) | $23.8 billion | MJFF Economic Burden Report |
| Indirect & non-medical costs (2024) | $58.4 billion | MJFF Economic Burden Report |
| Share of direct costs covered by Medicare | ~90% | MJFF / Parkinson’s Foundation |
| US taxpayer cost (Social Security, Medicare, disability) | $25 billion+ | MJFF Economic Burden Report |
| Previous projected 2037 cost (now already exceeded) | $79 billion | Earlier MJFF projection |
| Projected total cost by 2025 | $84.4 billion | McKnight’s / MJFF |
| Projected total cost by 2035 | $102.8 billion | McKnight’s / MJFF |
| Projected total cost by 2045 | $112.4 billion | McKnight’s / MJFF |
| Annual medication cost per patient (average) | $2,500 | Parkinson’s Foundation |
| Therapeutic surgery (DBS) cost per patient | Up to $100,000 | Parkinson’s Foundation |
| PD cost in 2017 (previous study baseline) | $52 billion | MJFF 2019 report |
| Cost increase 2017 to 2024 | +$30.2 billion (+58%) in 7 years | Derived from MJFF reports |
Source: Michael J. Fox Foundation for Parkinson’s Research, Economic Burden Report (March 26, 2026); Parkinson’s Foundation; McKnight’s Long-Term Care News (April 2026); Parkinson’s News Today (April 2026)
The $82.2 billion economic burden of Parkinson’s disease in 2024 is a figure that reframes the disease entirely. To put it in context: $82.2 billion exceeds the entire annual GDP of several US states. It is also a figure that arrived more than a decade earlier than anticipated — the previous projection had placed $79 billion as the 2037 number. The report that revealed this was the most comprehensive economic assessment of PD ever conducted, and it deliberately included categories that previous analyses had omitted or underweighted: costs incurred before diagnosis, unpaid caregiver time, home and vehicle modifications, and the productivity loss of patients who leave the workforce years before typical retirement age. Once those categories were properly counted, the true burden was revealed to be dramatically larger than the healthcare system-centred view had suggested.
The $58.4 billion in indirect and non-medical costs — representing 71% of the total — is the figure that most clearly illustrates why Parkinson’s disease cannot be addressed as a medical problem alone. For every dollar spent on hospital stays, medications, and specialist visits, approximately $2.45 is absorbed by families through lost wages, unpaid caregiving hours, home modifications, and other out-of-pocket burdens that never appear in clinical cost analyses. The $2,500 average annual medication cost per patient and the potential $100,000 price tag for deep brain stimulation surgery are significant individual-level burdens — but they represent the visible tip of a much larger iceberg. The trajectory toward $112.4 billion by 2045 is not a worst-case scenario; it is the modelled baseline if current trends continue without significant changes in treatment, prevention, or care delivery.
Parkinson’s Disease US 2026 — Risk Factors & Causes Statistics
PARKINSON'S DISEASE RISK FACTOR OVERVIEW
━━━━━━━━━━━━━━━━━━━━━━━━━━━━━━━━━━━━━━━━━━━━━━━━━━━━━━━━━━━━━━━━
Cause Type             % of PD Cases
Idiopathic (unknown)   ~90%   ████████████████████████████████████████████████████████████████████████
Hereditary / Genetic   ~10%   ████████

KEY RISK FACTORS
  Age (60+):           Primary driver — 46x higher risk at 80+ vs 40s
  Male sex:            1.5x higher risk than women
  Family history:      ~2x increased risk with affected parent/sibling
  Pesticide exposure:  Strong established link (paraquat, rotenone)
  Head injuries:       Associated risk factor (TBI)
  Rural living:        Indirect proxy for pesticide/well water exposure
━━━━━━━━━━━━━━━━━━━━━━━━━━━━━━━━━━━━━━━━━━━━━━━━━━━━━━━━━━━━━━━━
Paraquat: banned in 70+ countries — still legal in the US
Protective factors: Smoking, coffee (observed epidemiologically)
━━━━━━━━━━━━━━━━━━━━━━━━━━━━━━━━━━━━━━━━━━━━━━━━━━━━━━━━━━━━━━━━
| PD Risk Factor / Cause | Risk Level / Detail | Source |
|---|---|---|
| Idiopathic PD (no identified cause) | ~90% of all cases | NIH PubMed / Parkinson’s Foundation |
| Hereditary / genetic PD | ~10% of all cases | NIH PubMed |
| Known PD-linked genes identified | ~20 genes | Parkinson’s Foundation |
| Family history (parent or sibling with PD) | ~2x increased lifetime risk | Johns Hopkins Medicine |
| Male sex | 1.5x higher incidence than women | Parkinson’s Foundation |
| Age (primary risk factor) | Average onset age 60; 80+ = 1,903/100K prevalence | Johns Hopkins / NIH |
| Pesticide exposure (paraquat, rotenone) | Strong established link — associated with earlier onset and faster progression | APDA / NPJ Parkinson’s Disease (June 2025) |
| Paraquat — US legal status | Still approved in the US — banned in 70+ countries | Parkinson’s Foundation |
| Traumatic brain injury (TBI) | Associated risk factor — elevated risk observed | Johns Hopkins Medicine / Parkinson’s Foundation |
| Rural living / well water | Indirect proxy for pesticide exposure — elevated risk | Parkinson’s Foundation Environmental Factors page |
| Smoking / coffee | Observed protective association — mechanism under study | Johns Hopkins Medicine |
| LRRK2 / GBA1 / PINK1 gene variants | Increase neuronal vulnerability to toxins and stress | APDA (January 2026) |
Source: Parkinson’s Foundation, Johns Hopkins Medicine, APDA (January 2026, August 2025), NPJ Parkinson’s Disease (June 2025), NIH PubMed
The 90% idiopathic rate in Parkinson’s disease — meaning nine out of ten cases have no identified single cause — is simultaneously one of the most challenging and most important facts about this disease. It means that unlike hereditary disorders with clear genetic transmission, PD cannot be predicted, screened for, or prevented through genetic testing alone in the vast majority of cases. The scientific consensus, now supported by decades of epidemiological evidence, is that most PD results from complex interactions between genetic susceptibility and environmental exposures — particularly chemical exposures with decade-long latency periods before symptoms emerge. The ~20 genes now linked to increased PD risk (including LRRK2, GBA1, and PINK1) have opened critical research pathways, but they explain only a fraction of total disease burden.
The pesticide-PD connection is arguably the most policy-consequential finding in the disease’s risk factor literature, and it has intensified significantly in recent years. Research published in NPJ Parkinson’s Disease in June 2025 found that pesticide exposure was associated with more severe motor symptoms over time in PD patients — not just as a risk factor for developing the disease but as a factor that accelerates its progression after diagnosis. The continued US legal approval of paraquat — a herbicide banned in 70+ countries including the EU and China precisely because of its neurotoxic properties — remains a significant point of advocacy for the Parkinson’s Foundation and APDA, both of which have joined legal and legislative efforts to compel EPA action. Even brief early-life pesticide exposure may prime the brain for later neurodegeneration through epigenetic mechanisms, according to APDA research published in August 2025 — adding urgency to the regulatory debate that has so far moved far more slowly than the science.
Parkinson’s Disease US 2026 — Care Access & Treatment Statistics
HOW PD PATIENTS ACCESS CARE IN THE US — 2026
━━━━━━━━━━━━━━━━━━━━━━━━━━━━━━━━━━━━━━━━━━━━━━━━━━━━━━━━━━━━━━━━
Type of Neurologist Seen:
Community Neurologist:          50%   ████████████████████████████████████████████████████████
Movement Disorders Specialist:   9%   ████████
Primary Care / Other:           41%   ████████████████████████████████████████████

Coverage:
~90% of PD patients' care covered by Medicare   ███████████████████████████████████████████████████████████████████
━━━━━━━━━━━━━━━━━━━━━━━━━━━━━━━━━━━━━━━━━━━━━━━━━━━━━━━━━━━━━━━━
DBS Surgery: Up to $100,000 per person
Annual Medication Cost (avg): $2,500 per year
━━━━━━━━━━━━━━━━━━━━━━━━━━━━━━━━━━━━━━━━━━━━━━━━━━━━━━━━━━━━━━━━
| PD Care Access / Treatment Metric | Value | Source |
|---|---|---|
| PD patients seeing a community neurologist | ~50% | Parkinson’s Foundation Care Access Study |
| PD patients seeing a movement disorders specialist | ~9% | Parkinson’s Foundation Care Access Study |
| PD patients’ care covered by Medicare | ~90% | Parkinson’s Foundation |
| Average annual medication cost per patient | $2,500 | Parkinson’s Foundation |
| Deep brain stimulation (DBS) surgery cost | Up to $100,000 per person | Parkinson’s Foundation |
| US taxpayer burden (SS, Medicare, disability) for PD | $25 billion+ annually | MJFF Economic Burden Report, 2026 |
| NIH Parkinson’s research funding | Advocated increase; underfunded relative to burden | MJFF / Parkinson’s Foundation |
| Cost increase 2017–2024 | +58% in 7 years ($52B → $82.2B) | MJFF 2019 + 2026 reports |
| Black/Hispanic patients less likely to see neurologist | Documented barrier — socioeconomic access | AAN |
Source: Parkinson’s Foundation, Michael J. Fox Foundation Economic Burden Report (March 26, 2026), AAN
The care access data for Parkinson’s disease in 2026 reveals a system that is providing adequate but not optimal care to the majority of the 1.1 million Americans living with the disease. Only 9% of PD patients see a movement disorders specialist — the type of neurologist with the deepest expertise in PD’s complex, evolving symptom management. These specialists are concentrated in major academic medical centres and urban areas, creating a structural access barrier for rural patients, low-income patients, and those in states with lower healthcare infrastructure. The 50% who see a community neurologist receive competent care for straightforward PD management, but community neurologists typically have less exposure to the full range of advanced therapies — including deep brain stimulation, advanced levodopa formulations, and emerging neuroprotective treatments currently in clinical trials.
The 90% Medicare coverage rate among PD patients reflects the disease’s strong demographic concentration in the 65+ population, but it also means that the financial sustainability of PD care is tightly linked to the long-term solvency of Medicare itself. With PD costs projected to reach $102.8 billion by 2035 and $112.4 billion by 2045, and with Medicare already covering the large majority of those direct medical costs, the federal government’s fiscal exposure to this disease will grow significantly over the next two decades. The most cost-effective intervention — accelerating research toward disease-modifying treatments that slow or halt neurodegeneration rather than managing symptoms — remains chronically underfunded relative to the disease’s total economic burden. The Michael J. Fox Foundation remains the world’s largest non-profit funder of PD research, but advocates consistently note that federal NIH funding for PD research does not reflect the disease’s scale, cost, or growth trajectory.
Disclaimer: This research report is compiled from publicly available sources. While reasonable efforts have been made to ensure accuracy, no representation or warranty, express or implied, is given as to the completeness or reliability of the information. We accept no liability for any errors, omissions, losses, or damages of any kind arising from the use of this report.