
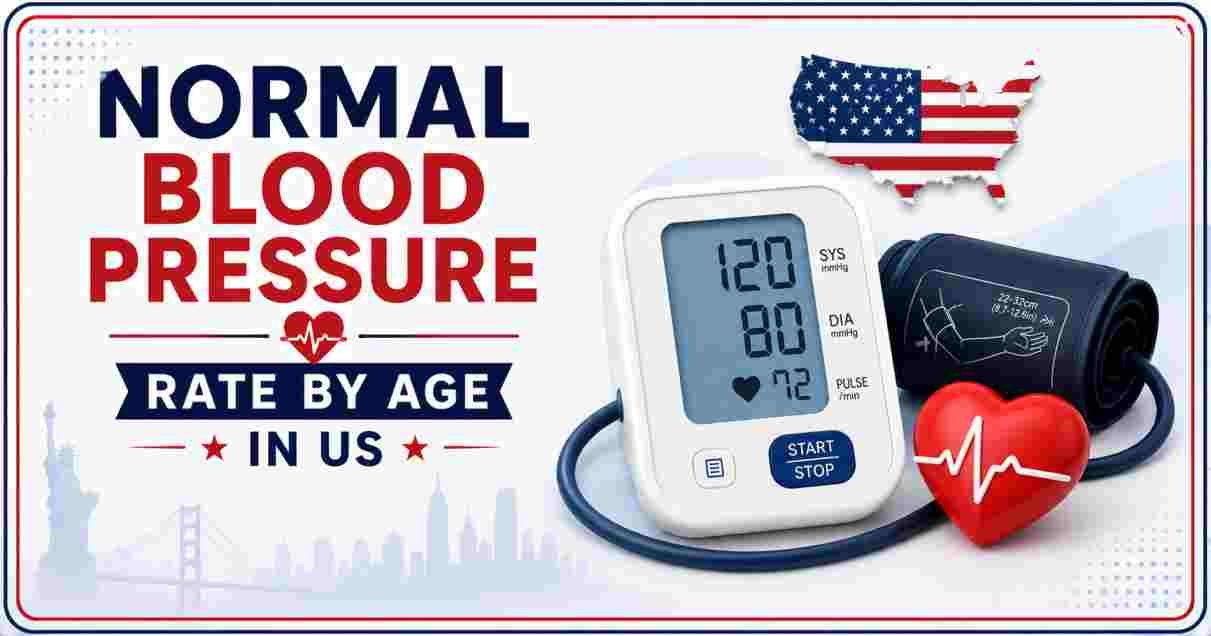
A normal blood pressure reading for every adult, regardless of age, stays below 120/80 mmHg, according to the 2025 AHA/ACC multisociety guideline that reaffirmed the 2017 thresholds. Average readings still climb decade by decade — from roughly 114/74 mmHg in the 20s to 138/76 mmHg by the 60s — but the healthy target itself never moves.
Normal Blood Pressure Rate by Age in US 2026
Normal Blood Pressure Rate by Age in US is one of the most searched medical baselines of 2026, and for good reason. Nearly half of American adults now live with hypertension, and the number climbs sharply once a person passes 60. Blood pressure is written as two numbers — systolic over diastolic — and it tells you how hard your heart is working and how much resistance your arteries are pushing back with. The confusion most readers run into is simple: average readings rise with age, but the medical target does not. A 120/80 mmHg ceiling applies to a 25-year-old and a 75-year-old alike.
This baseline matters more in 2026 than it did a decade ago. The August 2025 AHA/ACC guideline update kept the five original categories intact but added a universal treatment target below 130/80 mmHg for adults already diagnosed with hypertension, plus a new PREVENT risk calculator that factors in kidney function and metabolic markers. Doctors across the US are converging on similar numbers, even though each country still runs its own screening schedule. The rest of this report breaks down exactly where you should sit at every age, what the numbers mean by gender, and how US baselines compare with the other three countries searching this topic most.
Interesting Facts about Blood Pressure Rate
| Fact | Data Point (2026) |
|---|---|
| Adults with hypertension (US) | 47.7% of all US adults age 18+ |
| Age-adjusted hypertension rate | 44.5% (men 48.8%, women 40.1%) |
| Hypertension in adults 60+ | Roughly 7 in 10 adults |
| Hypertension control rate (18–39) | Only 4.5% achieve full control |
| Hypertension control rate (60+) | 29.2% achieve full control |
| Global 2025 guideline update sponsors | 13 medical societies, led by AHA/ACC |
| Lowest average BP decade | Ages 18–24 |
| New universal treatment target | Below 130/80 mmHg |
The table above captures why Normal Blood Pressure Rate by Age in US searches spike every January and September, when annual physicals and back-to-school health screenings cluster. Nearly 48% of the adult population technically qualifies as hypertensive under the 2017/2025 threshold of 130/80 mmHg, a number that would look far smaller under the older 140/90 cutoff. That single definitional shift, made almost a decade ago and preserved in the 2025 update, reshaped how doctors and patients talk about “normal” blood pressure.
Control rates tell the more uncomfortable story. Younger adults with high blood pressure are the least likely group to have it under control, largely because symptoms are silent and screening is inconsistent before age 40. Older adults, by contrast, get checked constantly and still end up with the highest raw prevalence. Both patterns point to the same conclusion: normal blood pressure is not something that happens automatically as people age — it is something people have to actively protect.
AHA Blood Pressure Categories for US Adults 2026
Blood Pressure Category Ladder (AHA/ACC 2025)
Normal        [<120/<80]      ████░░░░░░░░░░░░░░░░
Elevated      [120-129/<80]   ████████░░░░░░░░░░░░
Stage 1 HTN   [130-139/80-89] ████████████░░░░░░░░
Stage 2 HTN   [≥140/≥90]      ████████████████░░░░
Crisis        [>180/>120]     ████████████████████
| Category | Systolic (mmHg) | Diastolic (mmHg) |
|---|---|---|
| Normal | Below 120 | Below 80 |
| Elevated | 120–129 | Below 80 |
| Stage 1 Hypertension | 130–139 | 80–89 |
| Stage 2 Hypertension | 140 or higher | 90 or higher |
| Hypertensive Crisis | Above 180 | Above 120 |
Data source: American Heart Association / American College of Cardiology 2025 multisociety guideline, based on the 2017 classification framework.
These five categories apply uniformly across every adult age bracket in the United States — there is no separate “senior” scale, despite what many outdated charts suggest. A reading is classified by whichever number, systolic or diastolic, falls into the higher category, so a person reading 135/76 mmHg is Stage 1, not Elevated, because the systolic number governs. The 2025 update specifically reaffirmed this structure rather than replacing it, which means the categories your doctor uses today are the same ones introduced back in 2017.
What changed in 2025 is what happens after diagnosis, not the diagnosis itself. The guideline now recommends a single universal treatment target below 130/80 mmHg for anyone already being treated for hypertension, replacing a patchwork of age-adjusted goals that used to give older adults more leeway. It also introduced the PREVENT calculator, which estimates 10- and 30-year cardiovascular risk using kidney function markers alongside the traditional cholesterol and blood pressure inputs. For readers researching Normal Blood Pressure Rate by Age in US 2026, the practical takeaway is this: the definition of “normal” has not shifted, but the urgency to reach it earlier in life has increased. A detailed breakdown of related cardiovascular numbers is available in our coverage of heart disease statistics across the United States, which pairs well with this age-based dataset.
Average Blood Pressure by Age and Gender in US 2026
Average Systolic Pressure by Decade (mmHg)
18-24  ███████████░░░░░░░░  114
30s    ████████████░░░░░░░  119
40s    █████████████░░░░░░  122
50s    ███████████████░░░░  128
60s    █████████████████░░  135
70s    █████████████████░░  138
80+    ██████████████████░  142
| Age Group | Men – Avg. BP (mmHg) | Women – Avg. BP (mmHg) |
|---|---|---|
| 18–24 | 117/72 | 110/68 |
| 25–39 | 122/76 | 116/72 |
| 40–49 | 124/78 | 120/76 |
| 50–59 | 128/78 | 126/78 |
| 60–69 | 135/78 | 134/76 |
| 70–79 | 138/74 | 137/74 |
| 80+ | 142/72 | 140/70 |
Data source: National Center for Health Statistics, National Health and Nutrition Examination Survey (NHANES), CDC.
Notice the pattern running down both columns: systolic pressure — the top number — rises steadily and consistently with age, while diastolic pressure levels off in midlife and then quietly declines after 60. This happens because large arteries stiffen and accumulate plaque over decades, which forces the heart to generate more peak pressure with every beat even as resting pressure between beats drops. The gap between the two numbers, called pulse pressure, widens noticeably in the 70s and 80s, and doctors treat a widening pulse pressure as its own warning sign of arterial aging.
Men run consistently higher than women through their 20s, 30s, and 40s, sometimes by six or seven points of systolic pressure. That gap narrows through the 50s and largely disappears by 60, partly because women’s blood pressure trajectories steepen after menopause as estrogen’s protective vascular effect fades. None of these averages are targets — they describe what people typically measure, not what is medically desirable. A 68-year-old reading 138/78 mmHg is statistically ordinary, but it still sits inside Stage 1 hypertension by AHA/ACC classification, and the below-120/80 target still applies to them exactly as it does to a 25-year-old. Readers comparing this pattern against related cardiovascular datasets can cross-reference the full cardiovascular disease statistics in the United States for additional context on how these averages translate into long-term risk.
Hypertension Prevalence by Age in US 2026
Hypertension Prevalence by Age Bracket
18-39  ████░░░░░░░░░░░░░░░░  ~22%
40-59  ██████████░░░░░░░░░░  ~52%
60+    ██████████████░░░░░░  ~70%
| Age Bracket | Hypertension Prevalence | Control Rate (BP <130/80) |
|---|---|---|
| 18–39 | ~22% | 4.5% |
| 40–59 | ~52% | 18.1% |
| 60 and older | ~70% | 29.2% |
| All adults (crude) | 47.7% | ~21.4% |
| All adults (age-adjusted) | 44.5% | — |
Data source: NCHS Data Brief No. 511, Centers for Disease Control and Prevention, August 2021–August 2023 cycle.
Prevalence climbs almost in a straight line from young adulthood into the senior years, roughly tripling between the 18–39 bracket and the 60-plus bracket. That climb is not surprising on its own — arterial stiffening is a near-universal part of aging — but the control-rate column is the more telling metric for anyone trying to gauge personal risk. Fewer than 5 in 100 adults under 40 with hypertension actually have it under control, largely because younger patients are diagnosed less often, treated less aggressively, and monitored less frequently than older patients.
Control improves substantially with age, not because the condition gets easier to manage biologically, but because older adults interact with the healthcare system far more consistently. Someone in their 60s typically has more prescriptions, more specialist visits, and more routine blood pressure checks than someone in their 20s, which naturally pushes control rates higher even though prevalence is also higher. The practical lesson for younger readers researching normal blood pressure rate by age in US is that waiting for symptoms is the wrong strategy — hypertension is silent in the vast majority of cases until it isn’t. The full hypertension statistics report for the United States breaks these figures down further by state and demographic group.
Normal Blood Pressure by Age in US 2026 vs UK, Canada, and Australia
Diagnostic Threshold Comparison (Stage 1 / Treatment Trigger)
US (AHA/ACC 2025)             130/80
UK (NICE NG136)               140/90 clinic*
Canada (Hypertension Canada)  130/80
Australia (Heart Foundation)  140/90
*UK uses ambulatory averages ~135/85 for diagnosis confirmation
| Country | Guideline Body | Normal BP Target | Diagnostic Threshold |
|---|---|---|---|
| United States | AHA/ACC 2025 | Below 120/80 | 130/80 (Stage 1) |
| United Kingdom | NICE NG136 | Below 120/80 | 140/90 clinic, ~135/85 home |
| Canada | Hypertension Canada | Below 120/80 | 130/80 |
| Australia | National Heart Foundation | Below 120/80 | 140/90 |
Data source: NICE guideline NG136, Hypertension Canada 2025 primary-care guideline, National Heart Foundation of Australia.
All four countries agree on what a genuinely healthy reading looks like — below 120/80 mmHg — but they disagree on the number that triggers a formal diagnosis and medication conversation. The United States and Canada both moved to the lower 130/80 mmHg threshold, meaning more patients in those two countries get flagged and treated earlier. The UK and Australia have stayed closer to the older 140/90 mmHg clinic threshold, though the UK adjusts that figure downward to roughly 135/85 mmHg when confirming a diagnosis with home or ambulatory monitoring, which narrows the practical gap.
For someone splitting time between these healthcare systems, or reading results from a US-based device while living under NHS or Medicare Australia guidance, the difference is genuinely confusing. A reading of 132/84 mmHg would prompt a treatment discussion in the US or Canada but likely just a “monitor and revisit” recommendation in the UK or Australia. The healthy target itself, however, never changes across borders — it is only the point at which doctors intervene that varies, and that variation reflects differing philosophies about over-treatment risk rather than any disagreement about human physiology.
How to Monitor Blood Pressure Accurately by Age in 2026
Recommended Home-Monitoring Frequency
Normal BP        Annual check         █░░░░░░░░░░
Elevated BP      Every 3-6 months     ████░░░░░░░
Stage 1 HTN      Monthly to weekly    ███████░░░░
Stage 2 HTN      Weekly to daily      ██████████░
| BP Category | Recommended Monitoring | Best Time to Measure |
|---|---|---|
| Normal (<120/80) | Once per year | Morning, before caffeine |
| Elevated (120–129/<80) | Every 3–6 months | Morning and evening |
| Stage 1 (130–139/80–89) | Weekly at home | Same time daily |
| Stage 2 (≥140/90) | Daily home log | Morning and evening, seated |
| Hypertensive Crisis (>180/120) | Immediate medical care | Not applicable |
Data source: American Heart Association home blood pressure monitoring recommendations, reviewed 2025.
Accurate readings depend heavily on technique, and this is where a lot of home-monitoring data gets skewed without the person realizing it. Sit with your back supported, feet flat on the floor, arm resting at heart height, and stay silent for the full measurement — talking alone can add several points to a systolic reading. Caffeine, nicotine, and exercise in the 30 minutes before a reading also push numbers upward temporarily, which is why the AHA recommends taking two readings one minute apart and averaging them, rather than trusting a single number.
Age changes how often monitoring should happen, not how it’s done. A 25-year-old with a consistently normal reading only needs an annual check at a routine physical, while a 65-year-old with Stage 1 hypertension benefits from a home cuff and a simple daily log shared with their doctor at each visit. Digital cuffs with Bluetooth logging have made this dramatically easier since 2020, and most primary care providers in the US, UK, Canada, and Australia now accept home-logged data as part of an official diagnosis, provided the device has been validated against a clinical standard.
Frequently Asked Questions
What is a normal blood pressure rate by age in the US in 2026?
Normal blood pressure stays below 120/80 mmHg for every adult age group, from 18 through 80 and beyond. There is no age-adjusted “normal” range under current AHA/ACC guidance — average readings rise with age, but the healthy target does not move.
What is a normal blood pressure for a 60-year-old?
The target is the same as any adult: below 120/80 mmHg. In practice, the average 60-year-old measures closer to 135/78 mmHg, which falls into Stage 1 hypertension, meaning roughly seven in ten people in this age bracket are technically outside the normal range.
Is 130/80 blood pressure normal for my age?
No, regardless of age. A reading of 130/80 mmHg meets the definition of Stage 1 hypertension under the 2025 AHA/ACC guideline. It is common, especially past age 50, but “common” and “normal” are not the same classification.
Does blood pressure naturally increase with age?
Yes. Average systolic pressure rises fairly consistently from the 20s into the 80s because arteries stiffen and accumulate plaque over time. Diastolic pressure typically peaks in midlife and then declines slightly after 60, widening the gap between the two numbers.
What is considered high blood pressure for seniors in the US?
The same threshold applies to seniors as younger adults: 130/80 mmHg or higher counts as hypertension. Some frail or very elderly patients with limited life expectancy may be given a more flexible personal target by their physician, but the general population threshold has not changed.
How does US blood pressure guidance compare to the UK, Canada, and Australia?
The US and Canada both diagnose hypertension at 130/80 mmHg. The UK and Australia generally use a 140/90 mmHg clinic threshold, though the UK narrows that to roughly 135/85 mmHg using home or ambulatory monitoring before finalizing a diagnosis.
What is a dangerously high blood pressure reading regardless of age?
A reading above 180/120 mmHg is classified as a hypertensive crisis and requires immediate medical attention, particularly if it comes with chest pain, shortness of breath, vision changes, or confusion.
Can blood pressure be too low at any age?
Yes. Readings consistently below 90/60 mmHg are considered low blood pressure, or hypotension, and can cause dizziness, fainting, or reduced blood flow to organs, though what counts as symptomatic varies significantly from person to person.
Why do men and women have different average blood pressure readings by age?
Men typically run higher than women through their 20s, 30s, and 40s. That gap narrows through the 50s and largely closes by 60, a shift linked to declining estrogen levels after menopause, which reduces one of the natural protective effects on blood vessel elasticity.
How often should someone check their blood pressure based on age and category?
Adults with a normal reading only need an annual check. Anyone in the Elevated or Stage 1 category benefits from checking every few months to weekly, while Stage 2 hypertension generally calls for daily home monitoring alongside regular physician follow-up.
What is normal blood pressure for a teenager or young adult in their early 20s?
Teenagers and young adults typically show the lowest readings of any age group, often averaging close to 110–117/68–72 mmHg. Pediatric and adolescent blood pressure is judged against percentile charts rather than the flat adult thresholds, since normal ranges vary by height, age, and sex until growth is complete.
Does losing weight lower blood pressure at any age?
Weight loss is one of the most consistent non-drug interventions across every age bracket studied in the 2025 guideline. Even a modest reduction in body weight is associated with measurable drops in both systolic and diastolic pressure, which is why lifestyle changes are recommended before medication for adults with borderline Stage 1 readings and low overall cardiovascular risk.
Is isolated systolic hypertension common after 60?
Yes. Past age 60, it becomes common to see a high systolic number paired with a normal or low diastolic number — a pattern called isolated systolic hypertension. It reflects stiffened arteries rather than an overworked heart, and it still carries real cardiovascular risk even though only one of the two numbers is elevated.
What should I bring to a doctor’s visit to discuss my blood pressure by age?
A short log of home readings, taken at consistent times over one to two weeks, gives a physician far more useful information than a single clinic reading. Note the date, time, reading, and anything unusual, such as caffeine intake or stress, since a single office visit can be skewed by so-called white-coat anxiety.
Disclaimer: This research report is compiled from publicly available sources. While reasonable efforts have been made to ensure accuracy, no representation or warranty, express or implied, is given as to the completeness or reliability of the information. We accept no liability for any errors, omissions, losses, or damages of any kind arising from the use of this report.