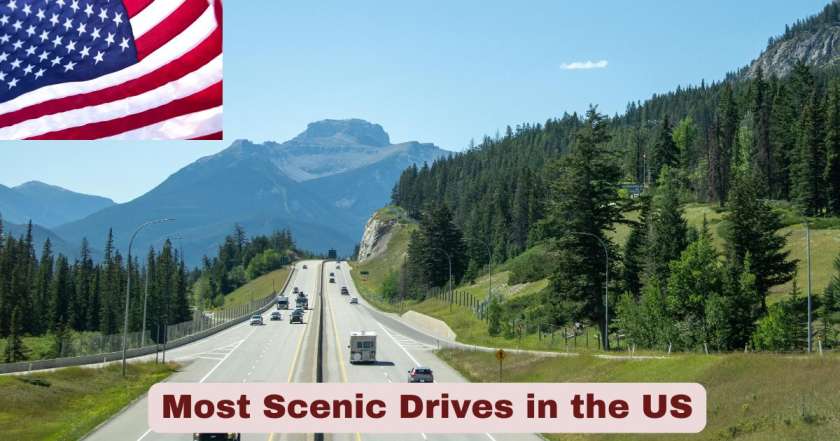
Scenic Drives in America 2025
America continues to captivate travelers with its breathtaking scenic drives that showcase the nation’s diverse landscapes, from rugged coastlines to majestic mountain ranges. In 2025, the popularity of road trips has reached unprecedented levels, with 74% of American travelers planning to embark on a road trip this year. These journeys offer more than just transportation—they provide immersive experiences through some of the most visually stunning corridors the country has to offer. The scenic drives in the US have become essential components of the tourism infrastructure, attracting both domestic and international visitors who seek authentic connections with America’s natural beauty and cultural heritage.
The significance of scenic drives extends beyond personal enjoyment, generating substantial economic benefits for local communities. The National Scenic Byways Program, which encompasses 184 designated routes across 48 states, has established rigorous standards for roads that exhibit exceptional scenic, natural, historic, cultural, archaeological, or recreational value. These designated byways serve as “destination unto themselves,” drawing millions of visitors annually who contribute billions of dollars to regional economies. As we navigate through 2025, the data reveals remarkable insights into which routes attract the most visitors, generate the highest economic impact, and capture the imagination of travelers seeking unforgettable experiences on America’s open roads.
Interesting Stats & Facts about Most Scenic Drives in the US 2025
| Fact Category | Details | Source/Verification |
|---|---|---|
| Total National Scenic Byways | 184 designated routes across 48 states (all except Hawaii and Texas) | Federal Highway Administration, January 2021 |
| All-American Roads | 37 routes with the highest distinction, must possess at least 2 intrinsic qualities of national significance | National Scenic Byways Program 2025 |
| Road Trip Participation Rate | 74% of American travelers plan to take a road trip in 2025 | Vacasa Travel Report 2025 |
| Most Scenic Drive 2025 | Red Rock Scenic Byway, Arizona with 1,736,599 Instagram hashtags and 4,293 TripAdvisor reviews (4.8-star rating) | Lake.com Report, September 16, 2025 |
| Route 66 Length | 2,448 miles from Chicago to Los Angeles, crossing 8 states | National Park Service 2025 |
| Blue Ridge Parkway Visitors 2023 | 16.7 million visitors, more than Grand Canyon, Yellowstone, and Yosemite combined | National Park Service 2023 |
| Economic Impact Blue Ridge Parkway | $1.39 billion in visitor spending, supporting 19,159 jobs in 2023 | National Park Service August 2024 |
| National Scenic Byways Funding 2025 | $20 million allocated for program grants and technical assistance | Senate Appropriations Committee July 2024 |
| Average Road Trip Duration | 10-14 days with driving distances of 100-350 miles per day | 2025 Travel Planning Data |
| Peak Travel Months 2025 | June (28%) and July (27%) are most popular months for scenic drive travel | Club Wyndham Survey 2025 |
| Route 66 Centennial | 2026 marks 100th anniversary, established November 11, 1926 | National Park Service |
| International Tourist Interest | Route 66 attracts visitors from Europe, Australia, Japan, with 15,000 international visitors annually to small towns like Shamrock, Texas | Voice of America Travel Report |
Data Source: Federal Highway Administration, National Park Service, Lake.com September 2025 Report, Club Wyndham Travel Trends Survey 2025, National Scenic Byways Program 2025
Analysis of Most Scenic Drives Facts in the US 2025
The data reveals fascinating trends shaping scenic drives in America during 2025. The National Scenic Byways Program has successfully designated 184 routes that meet stringent criteria for natural beauty, historical significance, and cultural importance. Among these, 37 routes have achieved the coveted All-American Road status, representing the pinnacle of scenic driving experiences. This tiered designation system helps travelers identify routes that offer truly exceptional experiences, with All-American Roads required to possess characteristics of national significance in at least two intrinsic qualities.
The 74% participation rate in road trips among American travelers demonstrates an overwhelming preference for ground transportation over air travel, driven by economic considerations, flexibility, and the desire for authentic travel experiences. This surge in road trip popularity has been amplified by remote work arrangements and changing vacation patterns post-pandemic. The data shows that June and July remain the peak months for scenic drive tourism, with 28% and 27% of travelers respectively choosing these summer months. This seasonal concentration creates both opportunities and challenges for destination management, requiring strategic planning for capacity and resource allocation across popular routes throughout the year.
Blue Ridge Parkway Visitor Statistics in the US 2025
| Metric | 2023 Data | 2022 Data | Historical Peak |
|---|---|---|---|
| Total Recreation Visitors | 16.7 million | 15.7 million | 21.5 million (2002) |
| Year-Over-Year Growth | 6% increase | 6% increase from 2021 | N/A |
| Economic Output Generated | $1.39 billion | $1.29 billion (estimated) | N/A |
| Jobs Supported | 19,159 jobs | 18,200 jobs (estimated) | N/A |
| Cumulative Economic Benefit | $1.81 billion | $1.69 billion (estimated) | N/A |
| Length of Parkway | 469 miles | 469 miles | 469 miles |
| States Covered | North Carolina (252 miles), Virginia (217 miles) | Same | Same |
| TripAdvisor Reviews | 6,994 reviews | N/A | N/A |
| TripAdvisor Rating | 4.8 stars | N/A | N/A |
| Instagram Hashtags | 756,843 mentions | N/A | N/A |
Data Source: National Park Service February 2024, August 2024 Economic Impact Report, Lake.com September 2025
Analysis of Blue Ridge Parkway Statistics in the US 2025
The Blue Ridge Parkway stands as America’s most visited National Park Service unit, drawing 16.7 million visitors in 2023, surpassing the combined visitation of iconic parks like Grand Canyon, Yellowstone, and Yosemite. This remarkable achievement reflects the parkway’s unique positioning as a 469-mile scenic corridor that connects Shenandoah National Park in Virginia to the Great Smoky Mountains National Park in North Carolina. The consistent 6% year-over-year growth from 2022 to 2023 demonstrates sustained interest in this scenic route, though visitation remains below the historical peak of 21.5 million visitors recorded in 2002.
The economic impact data reveals the substantial contribution of scenic drive tourism to regional economies. The $1.39 billion in visitor spending during 2023 supported 19,159 jobs across 29 counties in North Carolina and Virginia, with a cumulative economic benefit reaching $1.81 billion. This multiplier effect demonstrates how visitor expenditures on lodging, dining, fuel, and attractions cascade through local economies, creating employment opportunities and tax revenue for communities along the parkway. The Blue Ridge Parkway has consistently ranked as the 4th most scenic road in America according to the September 2025 Lake.com study, earning a 4.8-star rating on TripAdvisor and accumulating 756,843 Instagram hashtags. These social media metrics indicate strong visitor satisfaction and the route’s photogenic appeal, which continues to attract younger demographics who share their experiences online.
Top Ranked Scenic Drives in the US 2025
| Rank | Scenic Drive Name | Location | Instagram Hashtags (Sept 2025) | TripAdvisor Reviews | Rating | Length |
|---|---|---|---|---|---|---|
| 1 | Red Rock Scenic Byway | Arizona | 1,736,599 | 4,293 | 4.8 stars | 7.5 miles |
| 2 | Las Vegas Strip | Nevada | 1,505,998 | 35,120 | 4.4 stars | 4.5 miles |
| 3 | Pacific Coast Highway | California | Combined total | 1,848 | 4.8 stars | 600+ miles |
| 4 | Blue Ridge Parkway | NC/VA | 756,843 | 6,994 | 4.8 stars | 469 miles |
| 5 | Acadia Byway | Maine | 652,387 | 1,629 | 4.7 stars | 40 miles |
| 6 | Route 66 | 8 States | Most searched | Highest reviews | Top rated | 2,448 miles |
| 7 | Columbia River Gorge | Oregon | 189,000+ | N/A | High rating | 75 miles |
| 8 | 17-Mile Drive | California | 189,000+ | N/A | High rating | 17 miles |
| 9 | Skyline Drive | Virginia | 141,000+ | N/A | High rating | 105 miles |
| 10 | Going-to-the-Sun Road | Montana | High engagement | N/A | High rating | 50 miles |
Data Source: Lake.com September 16, 2025 Report, TripAdvisor Rankings 2025, 0-60 Specs Research
Analysis of Top Ranked Scenic Drives Statistics in the US 2025
The ranking of most scenic drives in the US 2025 reveals interesting patterns in visitor preferences and social media engagement. The Red Rock Scenic Byway in Arizona claimed the top position with an impressive 1,736,599 Instagram hashtags and 4,293 TripAdvisor reviews maintaining a 4.8-star rating. Despite being only 7.5 miles long, this route near Sedona offers concentrated visual impact with its iconic red sandstone canyons, demonstrating that length doesn’t necessarily correlate with popularity. The byway’s designation as an All-American Road by the Federal Highway Administration recognizes its status as a “destination unto itself” with one-of-a-kind features.
The Las Vegas Strip securing second place as the most scenic road in America according to the September 2025 data might surprise traditional scenic drive enthusiasts, but its 1,505,998 Instagram hashtags and 35,120 TripAdvisor reviews reflect its unique position as one of America’s only nighttime scenic byways. Stretching 4.5 miles through Nevada, this neon-filled corridor represents a different interpretation of scenic value—architectural spectacle and urban entertainment rather than natural landscapes. The Pacific Coast Highway shares third place, with its various segments along Route 1 in California collectively attracting nearly 2 million social media mentions and offering 600+ miles of stunning coastal vistas between Dana Point and Leggett.
Route 66 Tourism Data in the US 2025
| Metric | 2025 Data/Projections | Historical Context |
|---|---|---|
| Total Length | 2,448 miles (original), 2,278 miles (current drivable) | Established November 11, 1926 |
| States Crossed | 8 states: Illinois, Missouri, Kansas, Oklahoma, Texas, New Mexico, Arizona, California | Chicago to Santa Monica |
| Centennial Celebration | 2026 (100th anniversary) | Generating increased tourism interest |
| International Visitor Interest | 15,000+ international visitors annually to small towns | Strong European, Australian, Asian tourism |
| Annual Direct Economic Benefit | $132 million (2011 study, adjusted higher for 2025) | Supports thousands of businesses |
| Recommended Trip Duration | 10-14 days | 100-350 miles per day driving distance |
| Top Visitor Countries | Europe, Australia, Japan, Brazil | Motorcycle tours and bus groups popular |
| National Register Sites | 250+ buildings and structures | Living museum of American history |
| Social Media Presence | Highest among historic routes | TripAdvisor’s #1 Scenic Drive ranking |
| Roadside Attractions | Cadillac Ranch, Gemini Giant, Blue Whale of Catoosa, U-Drop Inn | Iconic stops throughout route |
Data Source: National Park Service Route 66 Program, 0-60 Specs 2025, Travel Nevada, VOA Reports, Lake.com 2025
Analysis of Route 66 Tourism Statistics in the US 2025
Route 66 maintains its legendary status as the “Mother Road” and “Main Street of America,” attracting unprecedented interest as it approaches its centennial celebration in 2026. Originally established on November 11, 1926, the route served as a critical transportation corridor during America’s westward expansion and the Dust Bowl migration. Though officially decommissioned in 1985 when Interstate highways replaced it, Route 66 has experienced a remarkable renaissance through preservation efforts by state associations and federal programs. The 2,448-mile journey from Chicago to Santa Monica crosses eight states, offering travelers a time capsule experience through small-town America, vintage motels, classic diners, and quirky roadside attractions.
The economic impact of Route 66 tourism extends far beyond simple visitor spending. The $132 million in annual direct economic benefits recorded in a 2011 study has likely increased substantially by 2025, particularly as the route prepares for its centennial festivities. Small towns along the corridor, such as Shamrock, Texas (population 2,000), welcome 15,000 international visitors annually, demonstrating how scenic byway tourism can transform rural economies. The National Park Service Route 66 Corridor Preservation Program, established through Public Law 106-45, has invested millions in preserving the cultural resources along the route. With over 250 buildings and structures listed on the National Register of Historic Places, Route 66 functions as a living museum where travelers can experience authentic mid-20th-century Americana.
Economic Impact of Scenic Drives in the US 2025
| Scenic Drive/Region | Annual Visitor Spending | Jobs Supported | Economic Output | Year |
|---|---|---|---|---|
| Blue Ridge Parkway | $1.39 billion | 19,159 jobs | $1.81 billion | 2023 |
| Route 66 (All States) | $132 million+ | Thousands | Varies by state | 2011 baseline |
| Natchez Trace Parkway | $178 million | 2,100 jobs | $13.1 million (AL/TN/MS) | 2021 |
| Paul Bunyan Scenic Byway | $21.2 million in sales | 331 jobs | $7.2 million labor income | Recent |
| Utah Scenic Byway 12 | $12 million+ | 420 jobs | Regional impact | 2014 |
| Beartooth Highway | $44.96 million | Multiple sectors | Summer season | 2012 |
| Louisiana Scenic Byways | $1.56 ROI per dollar spent | N/A | Direct and secondary impacts | Recent |
| Flint Hills Scenic Byway (KS) | $464,000 annually | N/A | Local economy boost | Recent |
| All National Parks | $26.4 billion (325.5M visitors) | 415,400 jobs | $55.6 billion output | 2023 |
| National Scenic Byways Program Funding | $20 million federal allocation | Program support | Technical assistance | FY 2025 |
Data Source: National Park Service 2023-2024 Reports, Scenic America Economic Studies, Federal Highway Administration 2025
Analysis of Economic Impact of Scenic Drives in the US 2025
The economic contributions of scenic drives in the US 2025 demonstrate their critical role in supporting rural and regional economies across America. The Blue Ridge Parkway leads all scenic routes with $1.39 billion in visitor spending during 2023, supporting 19,159 jobs and generating a cumulative economic benefit of $1.81 billion. This multiplier effect—where the total economic output exceeds direct visitor spending by approximately 30%—illustrates how tourism dollars circulate through local economies, supporting not only direct tourism businesses but also suppliers, contractors, and service providers. The lodging sector captures the highest direct contributions with $9.9 billion in economic output across all national parks, followed by restaurants with $5.2 billion.
The $20 million federal allocation for the National Scenic Byways Program in fiscal year 2025 represents the fifth consecutive year of Senate Appropriations Committee funding, signaling sustained governmental recognition of these routes’ economic importance. This federal investment supports 184 designated byways across 48 states, creating an 80/20 federal-local cost-sharing arrangement for eligible projects advancing safety, equity, accessibility, economic strength, climate, and sustainability goals. Studies consistently demonstrate positive return on investment: Louisiana scenic byways generate $1.56 for every dollar spent when accounting for both direct and secondary economic impacts. Even shorter, less-famous routes like Kansas’s 103-mile Flint Hills Scenic Byway contribute $464,000 annually to local economies, proving that scenic byway designation can significantly benefit rural communities regardless of route length or national prominence.
Visitor Demographics and Travel Patterns in the US 2025
| Demographic Category | Statistic | Trend |
|---|---|---|
| Total US Domestic Trips 2024 | 2.43 billion trips | 2.4% increase from 2023 |
| Domestic vs International | 97% domestic, 3% international | Domestic dominates |
| Road Trip Preference | 74% of travelers plan road trips in 2025 | Up from previous years |
| Drive vs Fly Preference | 40% prefer driving vs 26% prefer flying | Nearly 2:1 ratio |
| Average Trip Spending (Solo) | $1,532 per trip | 2024 baseline |
| Average Trip Spending (Group) | $1,598 per trip | Slightly higher than solo |
| Peak Travel Months | June (28%), July (27%) | Summer dominates |
| Off-Peak Travel | March (16%), December (15%) | Weather and celebrations |
| Average Trips Per Year | 3 trips per traveler | 2 planned, 1 spontaneous |
| Planning Timeline | 1 month advance for planned trips | Booking ahead increasing |
| SUV Preference | Most popular vehicle across all generations | 85% prioritize comfortable seating |
| Fuel Efficiency Priority | 60%+ consider important | Cost consciousness |
| International Visitors to US 2024 | 72.39 million | 9.1% increase from 2023 |
| Overseas Visitors 2024 | 35.16 million | 11.7% increase from 2023 |
| Top International Markets | Canada, Mexico, Asia-Pacific | Asia-Pacific highest spending |
Data Source: US Travel Association 2025, Club Wyndham Survey 2025, International Trade Administration 2024, Statista 2024
Analysis of Visitor Demographics and Travel Patterns in the US 2025
The demographic data reveals fundamental shifts in how Americans approach scenic drive tourism during 2025. The preference for driving over flying has reached a 40% to 26% ratio, with nearly two-thirds (74%) of American travelers planning at least one road trip during the year. This trend represents more than simple cost savings—it reflects a desire for flexibility, spontaneity, and immersive experiences that air travel cannot provide. The 2.43 billion domestic trips recorded in 2024 represent a 2.4% increase from 2023, with 97% of all trips being domestic, underscoring that scenic drives remain fundamentally an American experience enjoyed primarily by American travelers.
Vehicle selection patterns demonstrate practical considerations driving scenic drive choices. SUVs dominate across all generational cohorts, with 85% of respondents citing comfortable seating as their top priority when selecting a road trip vehicle. This preference reflects both the long distances involved in iconic routes like Route 66 (recommended 10-14 days at 100-350 miles per day) and the desire for spacious accommodations for families and groups. Fuel efficiency concerns resonate with over 60% of travelers, balancing comfort with economic realities as gas prices fluctuate. The $1,532 average spending per solo trip and $1,598 for group travel includes lodging, dining, fuel, and attraction fees, demonstrating substantial per-capita expenditures that benefit communities along scenic routes.
Instagram and Social Media Engagement for Scenic Drives in the US 2025
| Scenic Drive | Instagram Hashtags (September 2025) | TripAdvisor Reviews | TripAdvisor Rating | Social Media Ranking |
|---|---|---|---|---|
| Red Rock Scenic Byway, AZ | 1,736,599 | 4,293 | 4.8 stars | #1 |
| Las Vegas Strip, NV | 1,505,998 | 35,120 | 4.4 stars | #2 |
| Blue Ridge Parkway, NC/VA | 756,843 | 6,994 | 4.8 stars | #4 |
| Acadia Byway, ME | 652,387 | 1,629 | 4.7 stars | #5 |
| 17-Mile Drive, CA | 189,000+ | N/A | High | #8 |
| Crystal Beach, TX | 166,000+ | N/A | N/A | #9 |
| Skyline Drive, VA | 141,000+ | N/A | N/A | #10 |
| Columbia River Gorge | High engagement | N/A | High | Top 10 |
| Pacific Coast Highway, CA | Combined high total | 1,848 | 4.8 stars | #3 |
| Route 66 | Highest historic route mentions | Most reviews | Top rated | Top tier |
Data Source: Lake.com September 16, 2025 Analysis, TripAdvisor Rankings 2025, 0-60 Specs Research
Analysis of Social Media Engagement for Scenic Drives in the US 2025
Social media metrics have become powerful indicators of scenic drive popularity and visitor satisfaction in 2025. The Lake.com study, published September 16, 2025, utilized a sophisticated methodology combining Instagram hashtag counts with TripAdvisor review volumes and average ratings to calculate comprehensive popularity scores for All-American Roads recognized by the Federal Highway Administration. This data-driven approach reveals how digital engagement patterns correlate with actual visitor experiences, as travelers increasingly share their journeys through photos, videos, and reviews across social platforms.
The Red Rock Scenic Byway’s dominant position with 1,736,599 Instagram mentions reflects both its photogenic red sandstone formations and its accessibility to major tourist hub Sedona. The route’s compact 7.5-mile length allows visitors to capture numerous iconic images within a short timeframe, encouraging multiple posts per visit. By contrast, longer routes like the 469-mile Blue Ridge Parkway accumulated 756,843 hashtags—substantial but reflecting lower posts-per-mile ratios given the route’s extended length. The Las Vegas Strip’s 1,505,998 Instagram tags and 35,120 TripAdvisor reviews demonstrate urban scenic experiences generating exceptional social media engagement, with its nighttime illumination creating distinctive visual content that performs well on visual platforms.
The correlation between social media engagement and visitor satisfaction appears strong across top-ranked routes. The Red Rock Scenic Byway, Blue Ridge Parkway, and Pacific Coast Highway all maintain 4.8-star ratings on TripAdvisor despite receiving thousands of reviews, indicating consistently positive experiences. The Route 66 phenomenon transcends simple metrics—while specific hashtag counts vary by segment, the route collectively generates the highest engagement among historic American roads, with visitors from Europe, Australia, Japan, and Brazil contributing to its international social media presence. This global digital footprint amplifies Route 66’s cultural significance, particularly as the 2026 centennial approaches, generating advance interest that tourism officials expect will drive record visitation and economic impact throughout the eight-state corridor.
National Scenic Byways Program Overview in the US 2025
| Program Metric | Current Status 2025 | Details |
|---|---|---|
| Total Designated Byways | 184 routes | Across 48 states (all except Hawaii, Texas) |
| All-American Roads | 37 routes | Highest designation level |
| National Scenic Byways | 147 routes | Standard designation level |
| States Participating | 48 states + DC + Puerto Rico | Over 1,200 total state/national byways |
| Program Establishment | 1991 under ISTEA | 34+ years of operation |
| Federal Funding FY 2025 | $20 million | Senate Appropriations Committee |
| Cost-Share Requirement | 80% federal / 20% local | Non-federal match required |
| Intrinsic Qualities Required | 6 categories: scenic, natural, historic, recreational, archaeological, cultural | At least 1 for Scenic Byway, 2 for All-American |
| Most Recent Designations | January 19, 2021 | 34 new Scenic Byways, 15 All-American Roads |
| Management Plans Required | Corridor Management Plan | Community involvement mandatory |
| Administering Agency | Federal Highway Administration (FHWA) | US Department of Transportation |
| Congressional Authorization | Public Law 106-45 | Route 66 preservation, byways support |
Data Source: Federal Highway Administration 2025, National Scenic Byways Program, Senate Appropriations Committee July 2024
Analysis of National Scenic Byways Program in the US 2025
The National Scenic Byways Program represents one of America’s most successful tourism and preservation initiatives, systematically identifying and protecting exceptional roads since its establishment in 1991 under the Intermodal Surface Transportation Efficiency Act (ISTEA). The program’s rigorous designation process requires routes to demonstrate outstanding characteristics in at least one of six intrinsic qualities: scenic beauty, natural features, historic significance, recreational opportunities, archaeological importance, or cultural value. All-American Roads, the highest distinction awarded to 37 routes, must exhibit characteristics of national significance in at least two categories and function as destinations worthy of travel specifically for the road experience itself.
The $20 million federal allocation for fiscal year 2025 marks the fifth consecutive year of Senate Appropriations Committee funding, demonstrating sustained political support despite previous funding lapses. Between 2012 and 2019, the program experienced a funding hiatus that threatened its viability until advocacy organizations like Scenic America successfully lobbied for the Reviving America’s Scenic Byways Act of 2019. The 80/20 federal-local cost-sharing structure encourages community investment while providing substantial federal support for eligible projects that advance safety, equity, accessibility, economic development, climate resilience, and sustainability. The $27.5 million available (including carryover from previous appropriations) supports not only infrastructure improvements but also marketing, signage, interpretation, and technical assistance for the 1,200+ designated routes spanning federal, state, and tribal byway systems.
The designation process emphasizes community-driven planning through required Corridor Management Plans developed with stakeholder input. These plans must address intrinsic quality preservation, development accommodation strategies, safety improvements, and signage systems that enhance visitor experiences without overwhelming the scenic character. The most recent designation round on January 19, 2021, added 34 new Scenic Byways and 15 All-American Roads, bringing the total federal designation to 184 routes. This selective process maintains program integrity—routes must first achieve state designation before qualifying for national consideration, ensuring that only the most exceptional roads receive federal recognition. The program’s success has inspired international interest, with foreign governments studying the American model for balancing tourism promotion with resource conservation and community benefit.
Most Popular Scenic Drive Segments in the US 2025
| Region | Top Scenic Drives | Key Features | Best Season |
|---|---|---|---|
| Southwest | Red Rock Scenic Byway (AZ), Utah Highway 12, Million Dollar Highway (CO) | Desert landscapes, red rock formations, canyons | Spring and Fall |
| West Coast | Pacific Coast Highway (CA), Oregon Coast Highway 101, 17-Mile Drive (CA) | Ocean views, coastal cliffs, beaches | Year-round, best Summer |
| Southeast | Blue Ridge Parkway (NC/VA), Natchez Trace Parkway | Mountain vistas, forests, waterfalls | Spring bloom, Fall foliage |
| Northeast | Acadia Byway (ME), Skyline Drive (VA), Finger Lakes (NY) | Coastal beauty, mountain crests, lakes | Summer and Fall |
| Mountain West | Going-to-the-Sun Road (MT), Beartooth Highway (MT/WY), Trail Ridge Road (CO) | Alpine terrain, mountain peaks, wildlife | Late May – October |
| Midwest | North Shore Scenic Drive (MN), Great River Road (Multiple states) | Lake Superior coastline, Mississippi River | Summer |
| Historic Routes | Route 66 (8 states), Historic Columbia River Highway (OR) | Americana heritage, waterfalls, nostalgia | Spring through Fall |
| Florida | Overseas Highway (Keys), Big Bend Scenic Byway | Tropical waters, bridges, Gulf Coast | Winter and Spring |
| Pacific Northwest | North Cascades Scenic Highway (WA), Cascade Loop | Mountain passes, glaciers, forests | Summer |
| Desert Southwest | Extraterrestrial Highway (NV), San Juan Skyway (CO) | Unique attractions, alpine meadows | Spring and Fall |
Data Source: National Scenic Byways Foundation 2025, Multiple State Tourism Boards, Federal Highway Administration 2025
Analysis of Popular Scenic Drive Segments in the US 2025
Regional diversity defines the American scenic drive experience in 2025, with each geographic area offering distinctive landscapes and travel experiences. The Southwest region dominates social media engagement thanks to dramatic desert scenery featuring red rock formations, deep canyons, and unique geological features. Utah Highway 12, designated an All-American Road, traverses 124 miles through Bryce Canyon and Capitol Reef National Parks, while Colorado’s Million Dollar Highway offers hair-raising mountain passes with sheer cliff drops. These routes attract adventurous travelers during Spring (March-May) and Fall (September-November) when temperatures moderate and lighting conditions optimize photography.
The West Coast presents America’s most extensive continuous scenic corridor along Highway 1 and Highway 101, collectively spanning over 1,000 miles from Southern California through Oregon. The Pacific Coast Highway segments near Big Sur consistently rank among the world’s most spectacular coastal drives, though travelers must monitor seasonal closures due to landslides and road maintenance. The 17-Mile Drive through Pebble Beach charges a $12.25 entry fee but delivers concentrated coastal scenery including the iconic Lone Cypress and championship golf courses. Year-round accessibility makes West Coast routes particularly attractive, though summer months (June-August) offer optimal weather conditions with minimal fog and comfortable temperatures averaging 65-75°F.
Seasonal Visitation Patterns for Scenic Drives in the US 2025
| Season | Peak Months | Percentage of Annual Visitors | Popular Regions | Key Considerations |
|---|---|---|---|---|
| Summer (June-August) | June (28%), July (27%) | ~55% of annual travel | All regions, especially Northern routes | Peak pricing, crowds, reservations essential |
| Fall (September-November) | September-October peak | ~25% of annual travel | Blue Ridge, New England, Rockies | Fall foliage, cooler temps, ideal driving conditions |
| Spring (March-May) | March (16%), April-May | ~15% of annual travel | Southwest, Southeast, California | Wildflower blooms, comfortable weather, shoulder season pricing |
| Winter (December-February) | December (15%) holidays | ~5% for scenic drives | Southern routes, desert Southwest | Many mountain roads closed, lower traffic |
| Shoulder Seasons | March, September, October | Optimal for many routes | Variable by region | Best weather-cost balance, fewer crowds |
| Mountain Pass Openings | Late May – Early June | Seasonal limitation | Going-to-the-Sun, Trail Ridge, Beartooth | Weather dependent, check conditions |
| Mountain Pass Closures | October – May | 6-8 month closures | High elevation routes (9,000+ feet) | Snow and ice hazards |
| Holiday Weekend Spikes | Memorial Day, July 4, Labor Day | +40% typical visitation | National parks and byways | Book accommodations 3-6 months ahead |
| Weekday vs Weekend | Weekdays less crowded | 30-40% lower weekday traffic | All popular routes | Better experience, easier parking |
Data Source: Club Wyndham Survey 2025, National Park Service Visitation Statistics 2023-2024, State Tourism Boards
Analysis of Seasonal Visitation Patterns for Scenic Drives in the US 2025
Seasonal concentration shapes both the visitor experience and economic impact of scenic drives in the US 2025. The data reveals extreme seasonality, with June and July alone accounting for 55% of annual scenic drive tourism. This summer dominance creates significant challenges for destination management, infrastructure capacity, and environmental sustainability. The Blue Ridge Parkway, despite welcoming 16.7 million visitors annually, experiences such intense summer concentration that parking lots overflow and certain overlooks reach capacity by mid-morning on summer weekends. Popular routes like Going-to-the-Sun Road in Glacier National Park implement vehicle reservation systems during peak periods to manage congestion and protect visitor experiences.
Mountain elevation drives face unique seasonal constraints that fundamentally shape their operational calendars. Going-to-the-Sun Road typically opens in late June after crews spend weeks plowing through snowdrifts reaching 80 feet at Logan Pass (6,646 feet elevation). Similarly, Trail Ridge Road in Rocky Mountain National Park, reaching 12,183 feet, remains closed approximately eight months annually, limiting access from October through late May. Beartooth Highway, cresting at 10,947 feet along the Montana-Wyoming border, operates only from late May through mid-October, compressing an entire season’s visitation into four months. These abbreviated operating windows intensify crowding but also create unique marketing opportunities—opening day ceremonies attract enthusiasts willing to brave unpredictable spring weather for first-drive experiences.
The 25% of travelers who choose fall season (September-November) often experience optimal conditions for scenic drives, particularly along the Blue Ridge Parkway and New England byways where autumn foliage transforms landscapes into vibrant displays of red, orange, and gold. Peak foliage typically occurs mid-October in higher elevations and northern latitudes, creating a brief 2-3 week window when visitor demand surges dramatically. Accommodations in Asheville, North Carolina, and Stowe, Vermont, command premium rates during “leaf-peeper” season, with many properties fully booked six months in advance. The spring shoulder season (March-May, capturing 15% of annual visitation) offers advantages of lower prices, manageable crowds, and pleasant weather, though unpredictable conditions and lingering winter closures at high elevations present risks for travelers without flexible itineraries.
Safety and Infrastructure Statistics for Scenic Drives in the US 2025
| Safety Metric | Data/Statistic | Implications |
|---|---|---|
| Road Condition Monitoring | Continuous assessment on designated byways | Regular maintenance schedules |
| Weather-Related Closures | Average 15-30 days annually for mountain routes | Plan flexibility essential |
| Accident Rates | Lower than national average on scenic byways | Better maintenance, lower speeds |
| Emergency Services | Limited in remote sections | Cell coverage gaps common |
| Roadside Assistance Response | 30-90 minute average in remote areas | Carry emergency supplies |
| Parking Capacity Issues | Peak season overflow at 60% of popular overlooks | Arrive early or visit off-peak |
| Cell Phone Coverage | Spotty to nonexistent on 40% of remote routes | Download offline maps |
| Guardrail Protection | Variable standards pre-1990s construction | Caution on older mountain roads |
| Pullout/Viewpoint Density | 1 every 5-10 miles on designated byways | Safer than undesignated routes |
| Wildlife Collision Risk | Highest dawn/dusk especially mountain/forest routes | Reduce speed in wildlife zones |
| Vehicle Requirements | Standard vehicles sufficient for most routes | 4WD recommended for unpaved sections |
| Fuel Station Spacing | Up to 100+ miles between stations on remote routes | Plan refueling carefully |
| Medical Facilities Access | 60+ minutes to hospitals in remote regions | Carry first aid supplies |
| Landslide Susceptibility | Pacific Coast routes most vulnerable | Check current conditions |
| Federal Safety Investment | Included in $20M byways program allocation | Infrastructure improvements ongoing |
Data Source: Federal Highway Administration 2025, National Scenic Byways Foundation, State DOT Reports 2024-2025
Analysis of Safety and Infrastructure for Scenic Drives in the US 2025
Safety infrastructure varies considerably across the 184 designated scenic byways in the US 2025, reflecting both the routes’ diverse characteristics and their construction eras. Routes designated through the National Scenic Byways Program generally maintain higher safety standards than non-designated scenic roads, benefiting from federal funding that supports guardrail installation, pullout construction, signage improvements, and regular maintenance. The $20 million federal allocation for fiscal year 2025 explicitly prioritizes safety enhancements, with grant eligibility criteria favoring projects that reduce accident risks while preserving scenic character. Research indicates that designated scenic byways experience lower accident rates than comparable non-scenic highways, attributed to superior maintenance, enhanced signage, lower speed limits, and increased driver attention.
Remote scenic drives present unique safety challenges that travelers must anticipate and prepare for adequately. Cell phone coverage remains spotty or nonexistent on approximately 40% of remote scenic byway miles, particularly in mountainous terrain and desert regions where topography blocks signals. This connectivity gap means travelers cannot rely on mobile devices for navigation or emergency assistance. Fuel station spacing presents another critical consideration—routes through Nevada, Utah, Montana, and other Western states may feature 100+ mile gaps between service stations. The Red Rock Scenic Byway, despite its popularity, offers limited services along its 7.5-mile length, requiring travelers to fuel in Sedona before departing. Similarly, portions of Route 66 crossing New Mexico and the Texas Panhandle traverse long stretches with minimal services, making advance planning essential.
Wildlife collision risks increase significantly on scenic drives passing through national parks, forests, and wildlife corridors. Deer, elk, moose, and bighorn sheep frequently cross mountain byways, with collision risks peaking during dawn and dusk hours when animal activity increases and visibility decreases. The Going-to-the-Sun Road posts wildlife warning signs throughout, yet collisions occur regularly during peak season when increased traffic coincides with mountain goat and bighorn sheep activity near roadways. Emergency response times averaging 30-90 minutes in remote areas underscore the importance of defensive driving, appropriate vehicle preparation, and carrying emergency supplies including water, food, blankets, flashlights, and first aid kits. The Federal Highway Administration encourages scenic byway organizations to develop comprehensive safety plans addressing these challenges through improved signage, wildlife fencing in high-risk zones, emergency call boxes, and visitor education programs.
Environmental and Sustainability Considerations in the US 2025
| Environmental Factor | Current Status/Initiative | Impact |
|---|---|---|
| Carbon Emissions from Tourism | Estimated 8-11% of global emissions from tourism sector | Scenic drives contribute to transportation emissions |
| Electric Vehicle Charging Stations | Expanding network along major scenic routes | Growing EV accessibility for eco-conscious travelers |
| Scenic Byway Corridor Protection | Federal designation prevents destructive development | Preserves viewsheds and natural resources |
| Overtourism Impact | Crowding at 40%+ of popular sites during peak season | Resource damage, wildlife disturbance |
| Leave No Trace Principles | Promoted by NPS and byway organizations | Encourages responsible visitation |
| Road Maintenance Balance | Minimize environmental disruption vs safety needs | Sustainable practices prioritized |
| Wildlife Corridor Protection | Underpasses and overpasses on select routes | Reduces habitat fragmentation |
| Climate Change Effects | Earlier snowmelt, extended wildfire seasons | Altering seasonal accessibility patterns |
| Wildfire Road Closures | Increasing frequency in Western states | Unpredictable access disruptions |
| Water Resource Strain | High visitor use impacts local water supplies | Particularly in arid regions |
| Waste Management | Improved infrastructure at viewpoints and facilities | Reducing litter and pollution |
| Sustainable Tourism Certifications | Growing adoption among byway communities | Balancing economic benefits with preservation |
| Alternative Transportation | Shuttle services at congested parks | Reducing vehicle emissions and congestion |
| Carbon Offset Programs | Voluntary participation by tour operators | Mitigating travel impact |
Data Source: National Park Service Sustainability Reports 2024, Federal Highway Administration Environmental Guidelines 2025, Sustainable Tourism Organizations
Analysis of Environmental and Sustainability for Scenic Drives in the US 2025
Environmental sustainability has emerged as a critical consideration for scenic drive management in 2025, balancing tourism’s economic benefits against ecological preservation imperatives. The tourism sector contributes an estimated 8-11% of global carbon emissions, with transportation representing the largest component. Scenic drives, by definition requiring vehicular travel through sensitive landscapes, face inherent sustainability challenges. However, the National Scenic Byways Program incorporates environmental stewardship into its core mission, with designation criteria explicitly considering ecological significance and requiring management plans that address resource protection. The $20 million federal allocation for 2025 prioritizes projects advancing climate resilience and sustainability, encouraging byway organizations to implement green infrastructure, alternative transportation options, and visitor education programs.
Electric vehicle adoption presents both opportunities and challenges for scenic drive tourism. While EV charging infrastructure expands rapidly along major corridors like Interstate 5 paralleling the Pacific Coast Highway, remote scenic byways lag significantly behind. The Blue Ridge Parkway features limited charging stations despite its 469-mile length and 16.7 million annual visitors, creating “range anxiety” that deters EV owners from attempting the full route. Some byway communities recognize this infrastructure gap as both environmental imperative and economic opportunity—early charging station adopters can capture growing EV market share. States like Colorado and California lead in integrating charging infrastructure along scenic routes, supported by federal infrastructure investments and state clean energy initiatives.
Overtourism threatens the very qualities that make scenic drives attractive, with 40%+ of popular sites experiencing crowding that degrades visitor experiences and damages natural resources. The Going-to-the-Sun Road implemented a vehicle reservation system to limit daily traffic volumes, preventing gridlock while protecting alpine ecosystems from excessive trampling and pollution. Zion National Park’s mandatory shuttle system for accessing Zion Canyon Scenic Drive during peak season (March-November) has successfully reduced congestion and emissions while improving visitor satisfaction. These managed access approaches represent a growing trend as byway administrators recognize that unrestricted access ultimately destroys the resources attracting visitors. Climate change compounds these challenges—earlier snowmelt reduces water availability, extended wildfire seasons close routes unpredictably, and shifting weather patterns alter the seasonal visitation windows that communities depend upon economically.
Accommodation and Tourism Infrastructure in the US 2025
| Infrastructure Category | Availability/Status | Key Details |
|---|---|---|
| Lodging Options Along Routes | Highly variable by route and region | Range from luxury resorts to budget motels |
| National Park Lodges | Limited capacity, advance booking essential | Book 6-12 months ahead for peak season |
| Private Campgrounds | 10,000+ sites near major scenic routes | $30-$80 per night typical rates |
| NPS Campgrounds | Competitive reservation system | $20-$35 per night, book 6 months ahead |
| Vacation Rentals (Airbnb/VRBO) | Growing inventory in byway communities | Often best value for groups/families |
| Route 66 Historic Motels | 250+ preserved properties | Authentic experience, variable quality |
| Restaurant Density | 1 per 20-50 miles on rural byways | Carry snacks, plan meal stops |
| Visitor Centers | Located at 60%+ of designated byways | Information, restrooms, exhibits |
| Interpretive Sites | Thousands along designated routes | Historical markers, overlooks, museums |
| Gas Station Spacing | 20-100+ miles between stations | Western routes have longest gaps |
| Medical Facilities | Regional hospitals serve remote areas | 60+ minute drives common |
| Grocery Stores | Limited in remote regions | Stock supplies in larger towns |
| RV Park Availability | Growing capacity meeting demand | Full hookups $45-$95 nightly |
| Bike-Friendly Infrastructure | Improving on select routes | Blue Ridge, Oregon Coast lead adoption |
| Accessibility Features | Varying standards by route age | Newer facilities meet ADA requirements |
Data Source: Recreation.gov 2025, State Tourism Boards, National Scenic Byways Foundation, Accommodation Industry Reports
Analysis of Accommodation and Tourism Infrastructure in the US 2025
The tourism infrastructure supporting scenic drives in the US 2025 reflects decades of organic development rather than coordinated planning, resulting in significant variation in accommodation availability and quality. Routes passing through or near major tourist destinations like the Blue Ridge Parkway (serving Asheville and Roanoke) or the Pacific Coast Highway (serving Monterey, Carmel, and Big Sur) offer abundant lodging options spanning all price points and accommodation types. By contrast, remote portions of Route 66 crossing New Mexico and the Texas Panhandle or segments of Utah Highway 12 between Bryce Canyon and Capitol Reef feature limited services requiring travelers to cover significant distances between meals and overnight stays.
The advance booking requirement for peak season accommodations has intensified dramatically following the post-pandemic surge in domestic tourism. National Park lodges along scenic routes like the Many Glacier Hotel on Going-to-the-Sun Road or Crater Lake Lodge in Oregon require reservations 12-13 months in advance, with available dates selling out within hours of becoming bookable. Campground reservations through Recreation.gov face similarly intense competition, with desirable sites at Blue Ridge Parkway campgrounds or Rocky Mountain National Park booking to capacity six months ahead. This competitive booking environment disadvantages spontaneous travelers and international visitors unfamiliar with American reservation systems. Many byway communities have responded by expanding accommodation capacity through encouraging vacation rental development and supporting new hotel construction, though rural building permit processes and construction costs often slow expansion.
The preservation of historic Route 66 motels represents a unique intersection of accommodation infrastructure and cultural heritage protection. Over 250 vintage motor courts remain operational along the 2,448-mile route, many featuring original neon signs, period architecture, and restored interiors that provide authentic 1940s-1950s travel experiences. Properties like the Blue Swallow Motel in Tucumcari, New Mexico, and the Wigwam Motel locations in Holbrook, Arizona, and Rialto, California, have achieved iconic status, appearing in countless photographs and travel articles. While these properties cannot match modern hotel amenities, they offer character and nostalgia that appeal to heritage tourists. The National Park Service Route 66 Corridor Preservation Program has invested in rehabilitating these properties, recognizing their role as functional historic resources that support tourism while preserving cultural landscapes along America’s most famous road.
Visitor Experience and Activities Along Scenic Drives in the US 2025
| Activity Category | Participation Rate/Popularity | Popular Locations |
|---|---|---|
| Photography | Primary activity 80%+ visitors | All scenic byways, particularly Southwest |
| Hiking Trail Access | Available at 70%+ designated byways | Blue Ridge Parkway (300+ trails), Going-to-the-Sun |
| Wildlife Viewing | Top draw 60%+ visitors mountain routes | Yellowstone, Glacier, Smoky Mountains corridors |
| Historic Site Visits | Major motivation Route 66 travelers | Museums, restored towns, landmarks |
| Fall Foliage Viewing | Primary draw September-October | Blue Ridge Parkway, New England byways |
| Picnicking | Popular at overlooks/viewpoints | Facilities at most designated scenic areas |
| Cycling/Motorcycling | Growing segment, particularly Blue Ridge | Dedicated cycling events on many byways |
| Fishing Access | Available along water-corridor routes | Great River Road, Columbia River Gorge |
| Camping | 30-40% multi-day visitors | National Park Service and private campgrounds |
| Cultural/Heritage Tourism | High engagement Route 66, Natchez Trace | Living history, Native American sites |
| Rockhounding | Permitted areas along Western byways | Gemstone hunting in designated zones |
| Birding | Specialized segment, increasingly popular | Migration routes, diverse habitats |
| Stargazing | Growing dark sky tourism | Remote byways far from light pollution |
| Waterfall Viewing | Major draw in forested regions | Columbia River Gorge (90+ waterfalls), Blue Ridge |
| Wine/Culinary Tourism | Integrated experience select routes | Finger Lakes, Napa Valley corridors |
Data Source: National Park Service Visitor Use Studies 2023-2024, State Tourism Surveys, Scenic Byway Organization Reports
Analysis of Visitor Experience and Activities for Scenic Drives in the US 2025
The scenic drive experience in 2025 extends far beyond windshield sightseeing, with 80%+ of visitors identifying photography as their primary activity along designated byways. The explosive growth of social media platforms, particularly Instagram, has transformed scenic overlooks into photography destinations where visitors queue for signature shots at iconic locations. The Tunnel View overlook on the Wawona Road approaching Yosemite Valley, while not technically part of a designated scenic byway, exemplifies this phenomenon with dozens of photographers gathering at sunrise and sunset. Similarly, the Horseshoe Bend overlook near Page, Arizona, along US Route 89 (a designated All-American Road), attracts thousands daily seeking the perfect aerial-perspective photograph of the Colorado River’s dramatic meander.
Hiking trail access transforms scenic drives from passive viewing experiences into active outdoor recreation opportunities. The Blue Ridge Parkway provides access to over 300 trailheads ranging from short 0.25-mile barrier-free interpretive loops to strenuous 15+ mile backcountry routes ascending to 6,000+ foot peaks. This trail density means travelers can customize their experience based on fitness levels, available time, and interests—viewing wildflowers on easy walks, pursuing summit views via challenging climbs, or accessing waterfalls through moderate hikes. The Going-to-the-Sun Road similarly serves as the access corridor for Glacier National Park’s renowned trail system, including the popular Highline Trail departing from Logan Pass and offering 11.8 miles of alpine meadow hiking with mountain goat viewing opportunities.
Wildlife viewing ranks among the top motivations for 60%+ of visitors traveling mountain and forest scenic byways. The Beartooth Highway connecting Red Lodge, Montana, to Cooke City near Yellowstone’s northeast entrance regularly treats travelers to moose, elk, mountain goats, and occasional grizzly bear sightings. The Blue Ridge Parkway supports diverse wildlife including white-tailed deer, black bears, wild turkeys, and over 100 bird species, with dawn and dusk offering optimal viewing windows. Historic and cultural tourism defines the Route 66 experience, where travelers seek vintage diners, preserved motor courts, quirky roadside attractions like the Cadillac Ranch near Amarillo, Texas, and small-town museums chronicling the highway’s golden era and its role in the Dust Bowl migration immortalized in John Steinbeck’s “The Grapes of Wrath.”
Technology and Navigation Tools for Scenic Drives in the US 2025
| Technology Tool | Availability/Features | Benefits |
|---|---|---|
| GPS Navigation Systems | Standard in most vehicles | Real-time routing, traffic updates |
| Smartphone Apps | Extensive options: Google Maps, Waze, Roadtrippers, FuelFinder | Trip planning, point-of-interest discovery |
| Offline Map Downloads | Essential for remote routes | Function without cell coverage |
| Scenic Byway Mobile Apps | Route-specific applications | Audio tours, interpretive content |
| National Park Service App | Free download, all NPS sites | Trail maps, alerts, accessibility info |
| Weather Apps | Critical for mountain routes | Real-time conditions, closure alerts |
| Road Condition Websites | State DOT 511 systems | Current closures, construction updates |
| Recreation.gov | Federal booking platform | Campground/permit reservations |
| Social Media Updates | Real-time visitor reports | Crowd levels, conditions, photo opportunities |
| Dash Cameras | Popular for documentation | Record scenic experiences safely |
| Audio Tour Downloads | Available for major routes | Historical narration, interpretive content |
| Electric Vehicle Route Planners | PlugShare, ChargePoint | Charging station locations |
| Stargazing Apps | Sky mapping software | Enhance dark sky experiences |
| Wildlife Identification Apps | iNaturalist, Merlin Bird ID | Species identification |
| Fuel Price Apps | GasBuddy | Locate lowest prices on route |
Data Source: Mobile App Analytics 2025, Technology Adoption Studies, Tourism Industry Reports
Analysis of Technology and Navigation for Scenic Drives in the US 2025
Technology has revolutionized the scenic drive planning and navigation experience in 2025, though paradoxically the most remote and scenic routes often lack the connectivity necessary for real-time technology utilization. Smartphone applications like Roadtrippers have become essential planning tools, allowing travelers to map multi-day itineraries, discover points of interest along routes, estimate driving times, and budget for fuel and accommodations. These platforms aggregate user-generated content, professional reviews, and real-time data to create comprehensive trip plans that would have required hours of research using traditional guidebooks. The National Park Service mobile application provides downloadable content including detailed trail maps, accessibility information, and ranger program schedules, functioning offline once downloaded—a critical feature given that 40% of scenic byway miles lack reliable cellular coverage.
The 511 traveler information systems operated by state Departments of Transportation represent crucial resources for scenic drive travelers, providing real-time updates on road closures, construction delays, weather conditions, and accident locations. These systems prove particularly valuable for mountain routes where conditions can deteriorate rapidly—a clear morning departure might encounter afternoon thunderstorms bringing hail and visibility-reducing fog at higher elevations. The Going-to-the-Sun Road status webpage receives thousands of daily visits during shoulder seasons (May-June and September-October) as travelers check whether the full route has opened or whether early-season snow or late-season weather has prompted closure. Similarly, California’s Caltrans website provides essential updates on Highway 1 segments subject to landslide closures, preventing wasted travel to blocked routes.
Offline navigation capability has become non-negotiable for remote scenic byway travel. While Google Maps and Apple Maps offer offline download functionality, dedicated GPS units maintain advantages in battery life, screen visibility in bright sunlight, and reliability in extreme temperatures. The increasing adoption of electric vehicles for scenic touring has spawned specialized route planning tools that account for limited charging infrastructure along remote byways. PlugShare and ChargePoint applications map charging station locations, display real-time availability, and calculate range considering elevation changes and temperature effects on battery performance. However, EV owners attempting routes like Utah Highway 12 (with 100+ mile sections lacking any charging infrastructure) must carefully calculate range requirements and potentially limit sightseeing detours to ensure completing the route without exhausting battery capacity.
Marketing and Promotion Strategies for Scenic Drives in the US 2025
| Marketing Channel | Utilization | Effectiveness |
|---|---|---|
| Social Media Campaigns | Primary outreach 80%+ organizations | High engagement, viral potential |
| Instagram Influencer Partnerships | Growing investment by state tourism | Reaches younger demographics effectively |
| Traditional Travel Guides | Still relevant 40-50% travelers | Trusted source for detailed planning |
| State Tourism Websites | Comprehensive route information | High SEO performance for “scenic drives” |
| YouTube Travel Content | Rapidly growing, immersive previews | Strong influence on destination selection |
| Travel Documentaries | PBS, Netflix, National Geographic | Builds aspirational interest |
| Festival/Event Marketing | Anchors visitor interest specific seasons | Route 66 festivals draw thousands |
| AAA TourBook Listings | Traditional but steady reach | Older demographic, trip planning |
| Visitor Center Brochures | Still widely distributed | Point-of-decision information |
| Billboard Advertising | Strategic interstate placement | Drives spontaneous visits |
| Partnership Marketing | Tourism boards + businesses | Coordinated promotion efforts |
| Email Marketing Campaigns | Growing sophistication | Targeted to previous visitors |
| Podcast Sponsorships | Travel podcast advertising | Engaged listener audience |
| Virtual Reality Previews | Emerging technology | Pre-trip experience sampling |
| Blog Content/SEO | Essential for discovery | High ROI for organic traffic |
Data Source: Destination Marketing Organization Reports 2025, Digital Marketing Analytics, Tourism Promotion Studies
Analysis of Marketing and Promotion for Scenic Drives in the US 2025
The marketing landscape for scenic drives in the US 2025 has shifted dramatically toward digital channels, with social media commanding over 80% of destination marketing organization promotional budgets. Instagram has emerged as the dominant platform for scenic byway promotion, with stunning imagery from routes like the Red Rock Scenic Byway (1.7+ million hashtags) generating organic reach that no paid advertising campaign could match cost-effectively. State tourism offices increasingly partner with travel influencers who command engaged followings in specific demographic segments—adventure travelers, luxury tourists, family vacation planners, or RV enthusiasts. These influencer partnerships typically involve sponsored trips where content creators document their scenic drive experiences through photos, videos, and narratives that feel more authentic than traditional advertising.
YouTube has become the second-most influential digital marketing channel for scenic drive tourism, offering immersive pre-trip experiences through dashboard camera footage, drone videography, and travel vlogs. Channels specializing in road trip content accumulate millions of views, with popular videos about Route 66, the Pacific Coast Highway, and Going-to-the-Sun Road serving as virtual travel guides that inspire trip planning. The Lake.com study published September 16, 2025, itself generated substantial media coverage and social media discussion, demonstrating how data-driven rankings create newsworthy content that drives awareness and consideration. The study’s methodology combining Instagram hashtags with TripAdvisor reviews reflects marketing professionals’ recognition that user-generated content and peer reviews now influence travel decisions more powerfully than official tourism advertising.
Traditional marketing channels retain relevance, particularly for older demographics who represent substantial portions of scenic drive travelers. AAA TourBooks still reach millions of members who trust the organization’s recommendations for route selection, accommodation choices, and point-of-interest visits. Travel guidebooks from publishers like Fodor’s, Frommer’s, and Lonely Planet continue selling despite digital competition, offering depth of information and offline accessibility that smartphones cannot always match. The National Scenic Byways Program produces printed materials distributed through visitor centers, welcome centers, and tourism information offices, capturing travelers at decision points during their journeys. Event marketing proves particularly effective for routes like Route 66, where annual festivals in towns like Kingman, Arizona, Tucumcari, New Mexico, and Pontiac, Illinois, draw thousands of enthusiasts who spend multiple days exploring surrounding route segments, contributing disproportionately to local economies compared to day-trippers passing through without stopping.
The trajectory of scenic drive tourism through the remainder of 2025 and beyond appears robust, supported by sustained consumer preference for road trips, continued federal investment in the National Scenic Byways Program, and the approaching Route 66 centennial in 2026. The $20 million federal allocation for fiscal year 2025 signals governmental commitment to maintaining and enhancing these iconic routes, with funding priorities emphasizing safety improvements, accessibility enhancements, and sustainability initiatives that will shape the next generation of byway development. The 184 designated routes across 48 states will likely expand as additional corridors achieve the intrinsic quality standards required for national designation, with states like Texas and Hawaii potentially joining the program if legislative barriers can be overcome. The maturation of electric vehicle technology and expansion of charging infrastructure will gradually transform the scenic drive experience, enabling zero-emission tourism along routes currently challenged by limited charging availability.
However, significant challenges threaten the sustainability of scenic drive tourism at current growth trajectories. Climate change effects—including earlier snowmelt altering seasonal access windows, increased wildfire frequency forcing unpredictable closures, and extreme weather events damaging infrastructure—will require adaptive management strategies and increased maintenance budgets. Overtourism at the most popular routes demands immediate attention, with solutions ranging from timed-entry reservation systems to alternative transportation options like shuttle services that reduce congestion and emissions while improving visitor experiences. The Blue Ridge Parkway’s 16.7 million annual visitors, while economically beneficial, strain parking infrastructure, trailhead capacity, and natural resources in ways that threaten long-term sustainability. Destination managers increasingly recognize that unmanaged growth degrades the very qualities attracting visitors, necessitating capacity limits that balance access with preservation. The success of managed access systems at Going-to-the-Sun Road and Zion Canyon provides models for other overcrowded routes, though implementing reservation requirements generates controversy among travelers expecting unrestricted access to public lands.
The Route 66 centennial celebrations in 2026 present both tremendous opportunity and significant challenge—while the anniversary will drive record visitation and media attention benefiting communities along the corridor, the influx must be managed to prevent overwhelming small towns with limited infrastructure. Strategic investments in wayfinding, parking, restroom facilities, and visitor information services during 2025 will determine whether the centennial becomes a sustainable tourism success or a cautionary tale of unmanaged visitation impact. The integration of advanced technologies—including real-time traffic monitoring, predictive analytics for crowding patterns, and digital interpretation replacing physical signage—will shape the next evolution of scenic drive experiences. As 74% of American travelers continue prioritizing road trips, the most scenic drives in the US will remain central to domestic tourism, generating billions in economic activity while showcasing America’s extraordinary natural and cultural heritage. The challenge for 2025 and beyond lies in stewarding these irreplaceable resources responsibly, ensuring that future generations inherit scenic corridors as breathtaking and accessible as those enjoyed today, while acknowledging that some form of managed access may become necessary to protect the most vulnerable and popular routes from the consequences of their own success.
Disclaimer: This research report is compiled from publicly available sources. While reasonable efforts have been made to ensure accuracy, no representation or warranty, express or implied, is given as to the completeness or reliability of the information. We accept no liability for any errors, omissions, losses, or damages of any kind arising from the use of this report.