Largest Gas Field in the World 2026
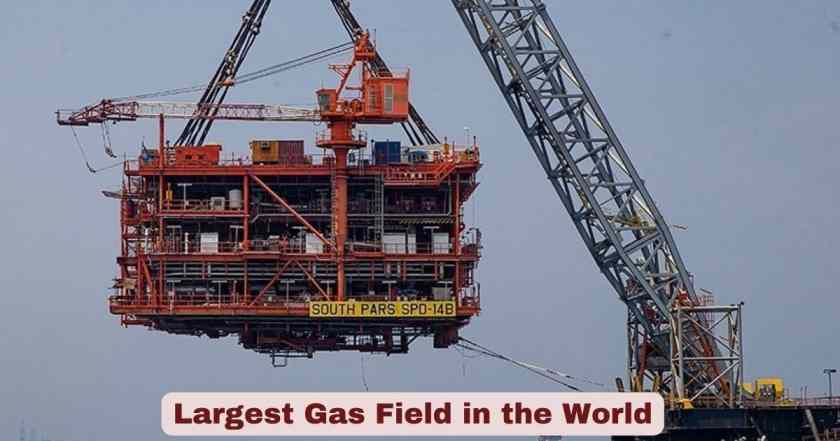
When energy analysts, geologists, and policymakers talk about the single most consequential piece of real estate in global energy, they consistently point to one place: the South Pars/North Dome Gas-Condensate Field, straddling the Persian Gulf between Iran and Qatar. This is, by a massive margin, the largest natural gas field ever discovered on Earth. According to the International Energy Agency (IEA), it holds an estimated 1,800 trillion cubic feet (51 trillion cubic metres) of in-situ natural gas and approximately 50 billion barrels of natural gas condensates — a figure so large that it rivals the recoverable reserves of virtually every other gas field on the planet combined. The field spans a total area of 9,700 square kilometres, with 3,700 sq km falling within Iranian territorial waters (known as South Pars) and 6,000 sq km in Qatari waters (called the North Dome or North Field). First discovered by National Iranian Oil Company (NIOC) in 1990, and confirmed to extend into Qatari waters where an earlier discovery was made in 1971, this single offshore formation has fundamentally shaped the energy strategies of two nations and the global LNG trade for decades.
As of March 2026, the South Pars/North Dome remains the undisputed number one largest gas field in the world by recoverable reserves, production capacity, and geopolitical significance. The field accounts for approximately 19% of the world’s total recoverable gas reserves, making it a cornerstone of global energy security. Qatar’s side of the field, developed with tens of billions of dollars in infrastructure investment and partnerships with international energy majors, was producing approximately 18.5 billion cubic feet per day (bcf/d) as of early 2026 — supplying around 20% of all global LNG. Iran’s side, constrained for decades by international sanctions, underinvestment, and aging infrastructure, was producing an estimated 2 bcf/d — a fraction of its geological potential. The contrast between the two sides of the same reservoir tells a story about how geopolitics, investment, and technology determine whether vast natural resources translate into economic power.
Interesting Key Facts About the Largest Gas Field in the World 2026
The table below brings together the most striking verified statistics about the world’s largest natural gas field and the broader global gas field landscape, drawn from confirmed international energy sources.
| Key Fact | Detail / Statistic |
|---|---|
| World’s #1 largest gas field | South Pars/North Dome, Persian Gulf (Iran & Qatar) |
| Total area of the field | 9,700 square kilometres |
| Estimated in-situ natural gas reserves | 1,800 trillion cubic feet (51 trillion cubic metres) |
| Natural gas condensate reserves | ~50 billion barrels |
| Share of world’s recoverable gas reserves | ~19% of total global recoverable gas |
| Qatar’s North Dome daily production (early 2026) | ~18.5 billion cubic feet per day |
| Iran’s South Pars daily production (early 2026) | ~2 billion cubic feet per day |
| Qatar’s share of global LNG supply from this field | ~20% of all global LNG |
| Contribution to Qatar’s government revenues | ~80% of all Qatari government revenues |
| World’s #2 largest gas field | Urengoy, Russia (recoverable reserves ~286 trillion cubic feet) |
| World’s #3 largest gas field | Galkynysh, Turkmenistan |
| World’s #4 largest gas field | Hassi R’Mel, Algeria (~123 trillion cubic feet) |
| World’s largest gas field in Europe | Groningen, Netherlands (original reserves ~95–99 trillion cubic feet) |
| Global natural gas demand in 2024 | ~4,354 billion cubic metres (bcm) — a new all-time high |
| Year global gas demand hit all-time high | 2024 (grew by 2.7% or 115 bcm year-on-year) |
| Gas recovery factor of South Pars/North Dome | ~70% — equating to ~1,260 trillion cubic feet of total recoverable gas |
| Total investment in South Pars development (to 2010) | Over $30 billion |
Source: International Energy Agency (IEA), IEA Global Energy Review 2025; IEA Gas Market Report Q3-2025; Britannica – Natural Gas Major Fields; Wikipedia – South Pars/North Dome (updated March 2026); IEA Global Gas Security Review 2024
The sheer scale of these numbers is hard to fully absorb. The South Pars/North Dome field alone holds enough gas — at the world’s current consumption pace — to supply global needs for approximately 13 years. When you compare its estimated recoverable reserves to those of the #2 field (Urengoy at ~286 trillion cubic feet), the gap is staggering: South Pars/North Dome holds roughly four to five times more recoverable gas than the second-largest field on the planet. Qatar has translated its share of this geological jackpot into an LNG export empire, with the North Dome underpinning long-term contracts with energy majors including TotalEnergies, Shell, Sinopec, Petronet, and Eni, while generating revenues that have funded one of the world’s highest GDP-per-capita economies.
The contrast between the Qatar and Iran sides of the same reservoir is the most instructive data point in global energy economics. Both countries sit above identical geological formations. Yet Qatar’s daily production of ~18.5 bcf/d dwarfs Iran’s ~2 bcf/d — a ratio of nearly 9:1. The difference is almost entirely attributable to international sanctions, decades of underinvestment, technical challenges (including high concentrations of mercaptans, which are sulfur compounds), and restricted access to international capital and technology on the Iranian side. It is a stark reminder that natural resource endowment alone does not determine energy wealth — governance, investment climate, and geopolitical context matter enormously.
South Pars / North Dome Field Key Statistics in the US 2026 — The World’s Largest Gas Field
South Pars / North Dome: Core Field Data in 2026
| Parameter | South Pars (Iran) | North Dome (Qatar) | Combined Field |
|---|---|---|---|
| Area (sq km) | 3,700 | 6,000 | 9,700 |
| Recoverable gas reserves (Tcf) | ~360 Tcf | ~900 Tcf | ~1,260 Tcf |
| Share of country’s proven reserves | ~36% of Iran’s reserves | ~99% of Qatar’s reserves | — |
| Share of world proven gas reserves | ~5.6% | ~14% | ~19% |
| Daily production (early 2026) | ~2 bcf/d | ~18.5 bcf/d | ~20.5 bcf/d |
| Discovery year | 1990 (South Pars) | 1971 (North Dome) | — |
| Development phases (Iranian side) | 24 phases | Phased + expansion | — |
| Gas use — primary purpose | Domestic consumption | LNG export | — |
| Contribution to national revenue | Critical but constrained | ~80% of govt revenue | — |
Source: IEA; Wikipedia – South Pars/North Dome Gas-Condensate field (updated March 2026); WION News; The National News, March 2026
The fundamental asymmetry within the South Pars/North Dome reservoir is one of the most consequential energy facts of the 21st century. On the Qatari side, the North Dome accounts for virtually the entirety (approximately 99%) of Qatar’s national proven gas reserves, making it the backbone of the entire Qatari economy, state, and society. QatarEnergy has invested decades of capital and expertise in developing the field through a phased expansion strategy, including a moratorium on new development projects that was placed in 2005 to protect long-term reservoir pressure and extended through a careful study period before production was cautiously expanded again. On the Iranian side, South Pars represents roughly 36% of Iran’s total proven gas reserves and the majority of its domestic gas supply — with approximately 70% of Iran’s domestic natural gas coming from South Pars — yet it has been repeatedly hampered by the inability to access advanced drilling technology, capital markets, and international technical partnerships.
From a geological standpoint, the gas recovery factor of the combined field stands at approximately 70%, meaning that out of the estimated 1,800 trillion cubic feet of gas in place, around 1,260 trillion cubic feet is considered ultimately recoverable. This figure alone — the recoverable portion of one field — equals roughly 19% of the entire world’s total recoverable natural gas reserves. To put it another way: if every other gas field on Earth were somehow exhausted simultaneously, South Pars/North Dome could independently supply global consumption for years. The field’s condensate reserves of approximately 50 billion barrels add further economic value, making it one of the world’s most significant combined hydrocarbon accumulations beyond just gas.
Top 10 Largest Natural Gas Fields in the World 2026
Top 10 Largest Gas Fields by Recoverable Reserves — World 2026
| Rank | Gas Field | Country | Recoverable Reserves (Tcf) | Status |
|---|---|---|---|---|
| #1 | South Pars / North Dome | Iran / Qatar | ~1,260 | Active / Expanding |
| #2 | Urengoy | Russia | ~286 | Active / Maturing |
| #3 | Yamburg | Russia | ~166 | Active |
| #4 | Galkynysh (South Yolotan) | Turkmenistan | ~120–200+ | Active / Expanding |
| #5 | Hassi R’Mel | Algeria | ~123 | Active / Mature |
| #6 | Groningen | Netherlands | ~95–99 | Decommissioning |
| #7 | Hugoton | USA (Kansas/Oklahoma/Texas) | ~75+ | Mature |
| #8 | Orenburg | Russia | ~64 | Active |
| #9 | Bovanenkovo | Russia | ~95+ | Active / Expanding |
| #10 | Dauletabad | Turkmenistan | ~60+ | Active |
Source: Britannica – Natural Gas Major Fields; WorldAtlas – Largest Natural Gas Fields; IEA data; Enerdata Global Energy Yearbook 2025
The global ranking of the largest natural gas fields in the world reveals a striking geographic concentration of reserves: Russia alone claims four fields in the top ten (Urengoy, Yamburg, Orenburg, and Bovanenkovo), underlining why Russia’s proven national gas reserves of approximately 37–38 trillion cubic metres remain the largest of any country on Earth. Turkmenistan, despite being a landlocked Central Asian nation, secures two spots with Galkynysh and Dauletabad — fields that have made it the holder of the world’s fourth-largest proven gas reserves. The Galkynysh field, formerly known as South Yolotan, was a game-changing discovery that dramatically elevated Turkmenistan’s global energy significance, though the country has struggled to monetize its resources at scale due to limited pipeline export routes beyond China.
One of the most significant stories in this top-ten list is the Groningen field in the Netherlands — the largest natural gas field in Europe — which is in the process of decommissioning production following years of induced seismic events (earthquakes) caused by extraction. The Netherlands government ordered the field closed, representing the first major example of a world-class gas field being deliberately wound down for social and safety reasons rather than resource exhaustion. Meanwhile, Russia’s Bovanenkovo field on the Yamal Peninsula has been aggressively developed to compensate for declining output from mature fields like Urengoy, with Gazprom investing heavily in Arctic infrastructure. At the same time, the Hugoton field in the United States remains one of the oldest continuously producing gas fields in the world, covering parts of Kansas, Oklahoma, and Texas, and representing a foundation of mid-continental U.S. gas production for over a century.
Global Natural Gas Reserves by Country in the US 2026 — Nations Powering the World
Top 10 Countries by Proven Natural Gas Reserves — 2025/2026
| Rank | Country | Proven Reserves (Trillion Cubic Metres) | % of World Total | Key Fields |
|---|---|---|---|---|
| #1 | Russia | ~37–38.2 Tcm | ~19–20% | Urengoy, Yamburg, Bovanenkovo |
| #2 | Iran | ~32.1 Tcm | ~17.1% | South Pars, Kish |
| #3 | Qatar | ~24.7 Tcm | ~13.1% | North Dome (North Field) |
| #4 | Turkmenistan | ~17.5–20 Tcm | ~9–10% | Galkynysh, Dauletabad |
| #5 | United States | ~12.6–13.2 Tcm | ~6.7% | Marcellus, Permian, Haynesville |
| #6 | Saudi Arabia | ~10.6 Tcm | ~5.6% | Ghawar (assoc.), North Field |
| #7 | China | ~8.4 Tcm | ~4.5% | Sichuan, Ordos, Tarim |
| #8 | Venezuela | ~6.3 Tcm | ~3.3% | Various associated fields |
| #9 | UAE | ~5.9 Tcm | ~3.1% | Khuff, offshore fields |
| #10 | Nigeria | ~5.5 Tcm | ~2.9% | Niger Delta, offshore |
Source: IEA; Enerdata Global Energy Yearbook 2025; digitalphablet.com citing IEA (September 2025); Streetsofkante citing IEA data (2024)
The global distribution of proven natural gas reserves is heavily skewed toward a handful of nations — the top three countries alone (Russia, Iran, and Qatar) control approximately 50% of all the world’s proven gas reserves. This level of concentration has profound implications for global energy security, pricing, and geopolitics. Russia’s position at the top, with approximately 37–38.2 trillion cubic metres, has historically given it enormous leverage over European energy markets — leverage that was dramatically disrupted when Russia’s full-scale invasion of Ukraine in 2022 accelerated European energy diversification and pushed European nations toward record LNG imports. The resulting global gas market rebalancing shifted power toward Qatar and the United States, the world’s two largest LNG exporters.
Iran’s position as the second-largest holder of proven gas reserves makes its sustained underproduction one of the great paradoxes of global energy. Despite holding reserves equivalent to approximately 17.1% of global totals, Iran remains unable to export LNG at all and exports only modest volumes via pipeline to Iraq and Turkey. The country’s chronic domestic gas shortages — which have caused rolling power outages and industrial disruptions — are all the more striking given this geological endowment. If Iran were ever to fully develop South Pars under favorable investment conditions, it could become one of the world’s largest LNG exporters overnight. Turkmenistan, ranked fourth, faces a different challenge: its reserves are vast but its landlocked geography and dependence on a single major export route — the Central Asia-China pipeline — limits both its pricing power and market diversification.
Global Natural Gas Production & Demand Statistics in the US 2026
Global Natural Gas Demand and Production — Key Metrics 2023–2025
| Indicator | 2023 | 2024 | 2025 (Forecast) |
|---|---|---|---|
| Global natural gas demand (bcm) | ~4,239 bcm | ~4,354 bcm | ~4,440+ bcm (forecast) |
| Year-on-year demand growth | ~1% (post-crisis slowdown) | +2.7% (+115 bcm) | +2.3% (~100 bcm) |
| USA — largest gas producer share | ~24% of world output | ~24% | Stable |
| USA gas demand (2023) | 948 bcm | Grew ~1.9% | Growing |
| Russia production change (2024) | — | +7% | — |
| China gas demand growth (2024) | — | +7% (30 bcm) | Slowed to ~−1% (H1 2025) |
| India gas demand growth (2024) | — | +10% | Declined ~7% (H1 2025) |
| Europe gas demand (H1 2025) | — | — | +6.5% y-o-y |
| Natural gas share of global energy growth (2024) | — | 28% | — |
| Global LNG supply growth (2024) | — | +2% (10 bcm) | +6% (30 bcm, forecast) |
Source: IEA Global Energy Review 2025 (published 2025); IEA Gas Market Report Q3-2025; IEA Global Gas Security Review 2024; APERC Gas Report 2024
Global natural gas demand hit a new all-time high in 2024, rising by 2.7% or approximately 115 billion cubic metres — a growth rate above both the 2% average from 2010 to 2019 and well above the sluggish 1% average between 2019 and 2023, which was weighed down by the COVID-19 pandemic and the 2022–2023 energy crisis. According to the IEA Global Energy Review 2025, natural gas accounted for 28% of the growth in global energy supply in 2024, making it the second-largest contributor to energy supply expansion after renewables (38%). The biggest demand drivers were industry and electricity generation, which together accounted for approximately 75% of incremental gas demand. Extreme heat waves across China, India, and the United States drove up gas-fired power generation in 2024, with the U.S. power sector’s gas share reaching an all-time high of 43% of electricity generation.
From a supply perspective, 2024 saw notable production growth from Russia (+7%), China (+6%), and Norway (+8% to a record high, largely for EU export). The United States, the world’s largest individual gas producer at approximately 24% of global output, held production roughly stable in 2024 after strong growth in 2023. LNG supply growth was disappointingly slow at just +2% (10 bcm) in 2024 — its slowest rate since 2020 — due to project delays and feed gas issues at legacy producers. However, the IEA forecast a meaningful acceleration to approximately +6% (30 bcm) in 2025, driven by the ramp-up of new U.S. LNG export facilities including Plaquemines LNG in Louisiana, which began operations in late 2024. Looking into 2026, the IEA projected global gas demand to reach a new all-time high, supported by stronger LNG supply availability and Asia’s price-sensitive markets finding more accessible supply.
LNG Market and Qatar North Field Expansion Statistics 2026
Qatar LNG Production and North Field Expansion — Key Data 2026
| Indicator | Figure |
|---|---|
| Qatar’s current LNG production capacity | ~77 million tonnes per annum (mtpa) |
| Qatar’s LNG target capacity by 2030 (NF East + NF South expansion) | ~142 mtpa |
| Qatar’s share of global LNG supply | ~20% |
| North Dome daily gas production (early 2026) | ~18.5 bcf/d |
| QatarEnergy’s proven reserves (confidential forecast, 2023) | ~110 Tcf proven + 85 Tcf contingent |
| Qatar as LNG exporter ranking | 2nd globally (after the United States) |
| Key LNG buyers — long-term contracts | France (TotalEnergies), UK (Shell), India (Petronet), China (Sinopec), Italy (Eni) |
| Oryx GTL plant capacity | 34,000 barrels/day (operational since 2007) |
| Iran’s planned investment to sustain South Pars pressure | $7 billion (launched March 2025) |
| Iran’s scheduled investment plan (2024) | $70 billion plan to maintain gas pressure and production |
Source: IEA Global Gas Security Review 2024; QatarEnergy public disclosures; Wikipedia – South Pars/North Dome (March 2026 update); S&P Global Market Intelligence, March 2025; The National News, March 2026
The Qatar North Field Expansion is arguably the most consequential single energy infrastructure programme in the world right now. QatarEnergy is executing a massive production ramp-up — the North Field East (NFE) and North Field South (NFS) expansion projects — that will take Qatar’s LNG capacity from approximately 77 million tonnes per annum (mtpa) to a targeted ~142 mtpa by 2030, representing a near-doubling of output. This expansion was launched after Qatar lifted its own 2005 self-imposed moratorium on new North Field development, following comprehensive reservoir studies that confirmed sustainable production at higher rates. The scale of investment required — which involves six new LNG trains and extensive offshore infrastructure — demanded partnerships with the world’s largest energy companies, who were willing to commit because the North Dome’s geology is uniquely low-risk, high-productivity, and long-lived.
Iran’s position represents a stark contrast. While Qatar is almost doubling its LNG capacity, Iran launched a $7 billion initiative in March 2025 — later contextualized within a $70 billion overall plan — to simply maintain gas pressure in the aging South Pars reservoir and prevent production decline. The challenge Iran faces is one of deferred maintenance compounded by the inability to access international capital, technology, and expertise. Each of South Pars’ 24 development phases was designed to extract a specific volume of gas, but aging infrastructure and declining reservoir pressure threaten long-term output. Economic analyses from Iranian sources noted that the development of each South Pars phase was expected to add approximately 1% to Iran’s GDP, with Phase 12 alone projected to add more than 3% of GDP — figures that illustrate just how much Iran’s economy depends on, yet falls short of fully utilizing, this extraordinary geological asset.
Natural Gas Field Economics and Global Market Impact in the World 2026
Global Natural Gas Market — Key Economic Indicators 2024–2026
| Indicator | Data Point |
|---|---|
| Global natural gas market size (2024) | ~$2.5–2.8 trillion in traded value annually |
| Henry Hub benchmark price (H1 2023 low) | ~$2.18/MMBtu (June 2023 — multi-year low) |
| European TTF price surge (June 2025, Iran-Israel conflict) | Rose 18% to ~$14/MMBtu within 9 days |
| Asian LNG spot price (JKM) surge (June 2025) | Rose 16% to ~$14.8/MMBtu |
| Global gas demand growth forecast — 2025 | +2.3% (~100 bcm) |
| Natural gas share of global electricity generation | ~23% globally |
| Gas share of U.S. electricity generation (2024) | 43% — all-time high |
| Global LNG trade growth (2025 forecast) | +6% (~30 bcm) |
| U.S. LNG export capacity target by 2027 | ~169 mtpa |
| North America’s share of incremental LNG supply (2025) | ~85% of new global supply |
| Gulf countries’ oil/gas output decline (early 2026, due to conflict) | Fell from 30 mbd to ~20 mbd (IEA estimate) |
Source: IEA Global Gas Security Review 2024; IEA Gas Market Report Q3-2025; IEA Global Energy Review 2025; EIA Short-Term Energy Outlook; Enerdynamics Global Natural Gas Outlook 2024–2034
The economics of global natural gas are inseparable from the geopolitical realities surrounding the world’s largest gas fields, and 2025–2026 has driven that lesson home with particular force. When escalating conflict in the Middle East caused fears of disruption to South Pars/North Dome production and Persian Gulf shipping in June 2025, European gas benchmark prices (TTF) surged 18% in under two weeks, and Asian LNG spot prices jumped 16% — demonstrating that a single field’s operational status can move global energy markets. The IEA’s Global Gas Security Review 2024 explicitly flagged the geopolitical vulnerability of Gulf LNG infrastructure as a key risk to global supply security, noting that the Strait of Hormuz — through which approximately 20% of the world’s global oil and LNG supply passes — remains one of the most consequential energy chokepoints on Earth.
From a broader market perspective, natural gas saw the strongest demand growth among all fossil fuels in 2024, with demand up 2.7% against oil’s modest 0.8% and coal’s 1%. The IEA projects that global gas demand will peak around 2030, after which growth trajectories diverge sharply depending on climate policy pathways. In scenarios aligned with net-zero targets, gas demand falls rapidly after 2030; in scenarios that prioritize energy security and affordability, gas demand remains elevated well beyond that date. Regardless of scenario, the South Pars/North Dome field will remain the single most important natural gas asset on Earth for the foreseeable future, and its ownership, productivity, and stability will continue to shape energy prices, geopolitical leverage, and climate outcomes for billions of people across four continents.
Disclaimer: This research report is compiled from publicly available sources. While reasonable efforts have been made to ensure accuracy, no representation or warranty, express or implied, is given as to the completeness or reliability of the information. We accept no liability for any errors, omissions, losses, or damages of any kind arising from the use of this report.