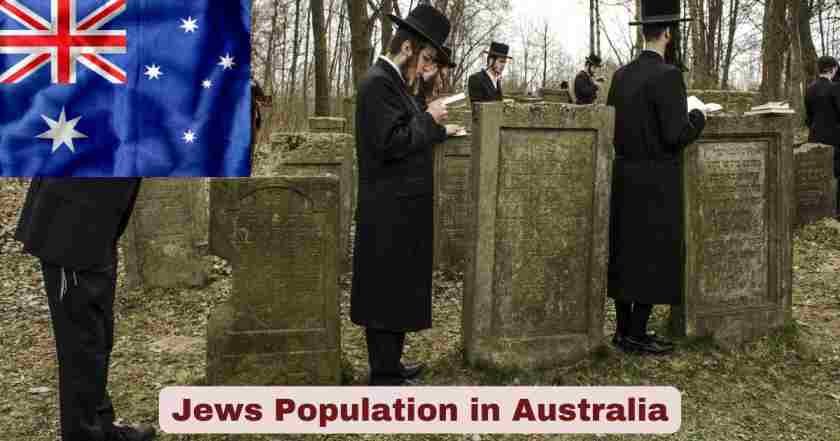
Jews in Australia 2025
The Jewish community in Australia represents one of the most established and integrated minority populations in the nation, with a history dating back to the First Fleet in 1788. As of 2025, Australia is home to an estimated Jewish population that has evolved significantly over recent decades, shaped by migration patterns, demographic shifts, and changing community dynamics. The community maintains a strong presence particularly in Melbourne and Sydney, where the vast majority of Jews in Australia reside.
Understanding the current state of the Jewish population in Australia 2025 requires examining comprehensive census data, primarily from the 2021 Australian Census conducted by the Australian Bureau of Statistics, along with updated estimates and projections. This article presents verified statistics and facts about Jews in Australia, covering population distribution, demographics, education, employment, income, and community characteristics based on reputable Australian sources including the Jewish Communal Appeal, Executive Council of Australian Jewry, and academic research from institutions like Monash University.
Interesting Facts About Jews in Australia 2025
| Category | Fact | Details |
|---|---|---|
| Total Population | 99,956 | Jews who identified by religion in 2021 Census |
| Estimated Population | 116,967 | Adjusted estimate accounting for undercount in 2021 |
| Percentage of Total | 0.46% | Jews as percentage of Australian population |
| Peak Population | 117,903 | Estimated peak reached around 2016 |
| Melbourne Concentration | 53,373 | Estimated Jewish population in Melbourne (2021) |
| Sydney Concentration | 43,738 | Estimated Jewish population in Sydney (2021) |
| Urban Concentration | 84% | Live in Melbourne or Sydney combined |
| Median Age | 44 years | Six years older than national median of 38 |
| Population Growth | 1.2% | Growth rate from 2011 to 2021 (vs 19% national growth) |
| Median Personal Income | $59,800 | 43% higher than national average |
| Median Household Income | $134,900 | Significantly above national median |
| Home Ownership | 38% | Own homes outright (vs 31% nationally) |
| Volunteering Rate | 27% | Nearly double the national rate |
| Jewish School Attendance | 48% | Of Jewish children (declined from 54% in 2011) |
| Apartment Living | 29% | Vs 14% nationally – twice as likely |
Data Source: Australian Bureau of Statistics 2021 Census; Jewish Communal Appeal (JCA) Reports 2024; Dr. David Graham demographic analysis
The table above reveals several striking characteristics about the Jewish community in Australia 2025. The enumerated figure of 99,956 Jews from the 2021 Census represents those who actively identified Judaism as their religion, while demographic experts estimate the true population at approximately 116,967 when accounting for secular Jews, Holocaust survivors who prefer not to disclose, and census undercount. This means roughly 17,000 additional Jews live in Australia beyond those who ticked the Judaism box on census forms. The community’s concentration is remarkable, with 84% residing in just two cities – Melbourne and Sydney – making it one of the most geographically concentrated ethnic groups in Australia.
Financial indicators demonstrate the community’s economic success, with the median personal income of $59,800 representing a substantial 43% premium over the national average. This prosperity extends to household income levels at $134,900, significantly exceeding typical Australian households. The volunteering rate of 27% – nearly double the national average – reflects strong civic engagement and community participation. Perhaps most concerning for community leaders is the declining Jewish school attendance rate, which dropped from 54% in 2011 to 48% in 2021, potentially indicating changing priorities around Jewish education or financial pressures from rising school fees. The aging demographic is evident in the median age of 44 years, six years above the national median, signaling future challenges in aged care provision and community sustainability.
Jewish Population Distribution in Australia 2025
| State/Territory | 2021 Population | 2016 Population | Change (%) | % of State |
|---|---|---|---|---|
| Victoria | 46,645 | 42,241 | +10.4% | 0.71% |
| New South Wales | 40,249 | 36,888 | +9.1% | 0.49% |
| Western Australia | 5,669 | 5,425 | +4.5% | 0.21% |
| Queensland | 4,815 | 4,388 | +9.7% | 0.09% |
| South Australia | 1,145 | 1,030 | +11.2% | 0.07% |
| Australian Capital Territory | 886 | 647 | +36.9% | 0.21% |
| Tasmania | 376 | 250 | +50.4% | 0.07% |
| Northern Territory | 163 | 118 | +38.1% | 0.07% |
| TOTAL AUSTRALIA | 99,956 | 91,023 | +9.8% | 0.40% |
Data Source: Australian Bureau of Statistics 2021 Census; Executive Council of Australian Jewry; The Australian Jewish News
Victoria maintains its position as the most populous Jewish state in Australia with 46,645 Jews, representing a robust 10.4% increase from 2016. This makes Victoria home to approximately 47% of Australia’s Jewish population, with the vast majority concentrated in Melbourne’s southeastern suburbs. The state’s Jewish population represents 0.71% of Victoria’s total population, the highest proportion of any Australian state. Melbourne’s appeal stems from its established Jewish infrastructure, including numerous synagogues, Jewish schools, kosher facilities, and the densely Jewish neighborhoods of Caulfield North, St Kilda East, and Bentleigh East.
New South Wales follows with 40,249 Jews, a 9.1% increase from 2016, representing approximately 40% of the national Jewish population. The state’s Jewish community comprises 0.49% of NSW’s total population. Sydney’s Jewish population concentrates in the eastern suburbs (Bondi, Dover Heights, Rose Bay, Vaucluse) and the Upper North Shore (St Ives region). Notably, smaller states and territories experienced dramatic percentage increases: the Australian Capital Territory saw 36.9% growth, Tasmania recorded 50.4% growth, and the Northern Territory increased by 38.1%, though these remain small populations in absolute terms. The 9.8% overall national increase from 2016 to 2021 represents the largest intercensal growth since the 1950s, though demographers note this partly corrects the anomalous 2016 census which likely undercounted Jews.
Major Jewish Neighborhoods in Australia 2025
| Suburb | City | Jewish Population | % of Suburb | 2011-2021 Change |
|---|---|---|---|---|
| Caulfield North | Melbourne | 16,170 | 49% | Stable |
| Caulfield South | Melbourne | 8,040 | 43% | Moderate growth |
| St Kilda East | Melbourne | 6,500+ | 31% | -16% |
| Bentleigh East | Melbourne | 4,000+ | 12% | +12% |
| Dover Heights | Sydney | 3,500+ | 41% | Stable |
| Bondi Beach-North Bondi | Sydney | 3,000+ | 23% | +9% |
| Rose Bay-Vaucluse-Watsons Bay | Sydney | 3,000+ | 23% | Stable |
| St Ives | Sydney | 2,500+ | Lower | -27% |
Data Source: JCA NSW 2021 Census Report; JCCV Victoria 2021 Census Report; Dr. David Graham demographic analysis
Caulfield North stands as Australia’s most Jewish neighborhood, with 49% of the suburb’s population identifying as Jewish in 2021. This single suburb contains more Jews than the combined total of Western Australia, Queensland, South Australia, ACT, Tasmania, and Northern Territory. The area features dense Jewish infrastructure including multiple synagogues, kosher shops and restaurants, Jewish schools, and community centers. Neighboring Caulfield South follows with 8,040 Jews comprising 43% of the population, creating a contiguous highly Jewish area in Melbourne’s inner southeast.
The most significant demographic shift occurred in St Ives, a suburb on Sydney’s Upper North Shore, which experienced a 27% decline in Jewish population between 2011 and 2021. This represents an exodus of approximately 1,000 Jews from the area, likely driven by families relocating to Sydney’s eastern suburbs to be closer to Jewish amenities and community. Conversely, Bentleigh East in Melbourne recorded the strongest growth at 12%, attracting young families seeking more affordable housing while remaining within reach of Jewish institutions. Bondi Junction-Waverly grew 9%, maintaining the eastern suburbs’ position as Sydney’s Jewish heartland. Demographer Dr. David Graham notes Jews demonstrate a “very interesting tendency to congregate in very small urban areas” with community members preferring to “live near other Jews and communities,” resulting in dense concentration within specific neighborhoods.
Age Structure of Jews in Australia 2025
| Age Group | Jewish Population | % of Jewish Total | National % | Notable Trends |
|---|---|---|---|---|
| 0-4 years | 7,200 | 6.2% | 6.3% | Declined 1,400 from 2011 |
| 5-9 years | 8,500 | 7.3% | 6.5% | School-age cohort |
| 10-14 years | 8,000 | 6.8% | 6.3% | Secondary school age |
| 15-19 years | 7,500 | 6.4% | 6.2% | University entry age |
| 20-29 years | 12,000 | 10.3% | 13.5% | Below national average |
| 30-39 years | 15,000 | 12.8% | 14.0% | Family formation age |
| 40-49 years | 16,500 | 14.1% | 13.1% | Peak working years |
| 50-59 years | 17,000 | 14.5% | 12.8% | Pre-retirement |
| 60-69 years | 14,000 | 12.0% | 11.0% | Early retirement |
| 70-79 years | 13,000 | 11.1% | 8.3% | Significantly elevated |
| 80+ years | 8,000 | 6.8% | 4.6% | Aged care needs |
| Median Age | 44 years | – | 38 years | 6 years older |
Data Source: JCA 2021 Census Report; Australian Bureau of Statistics
The age structure of Jews in Australia 2025 reveals a significantly older population compared to the national average, with a median age of 44 years versus 38 years for all Australians. This six-year gap represents one of the most important demographic challenges facing the community. The 70-74 age cohort increased by 4,320 people between 2011 and 2021, reflecting the aging of the large baby boomer generation within the Jewish community. This cohort is now entering their late 70s and early 80s, when care needs dramatically increase.
The declining number of young children presents long-term sustainability concerns. The 0-4 age group decreased by 1,400 children over the decade, indicating lower birth rates or smaller family sizes. The 20-29 age bracket shows under-representation at 10.3% of the population compared to 13.5% nationally, potentially reflecting emigration for education or career opportunities, including moves to Israel. Population modeling predicts that in the next decade, the number of Jews in their 80s will dramatically increase, bringing “significant challenges” according to demographer Dr. David Graham. Over half of Jews requiring “assistance with core activities” – an estimated 3,688 people – were already aged 75 and above in 2021, placing substantial demands on Jewish aged care facilities and community support services.
Education and Jewish Schools in Australia 2025
| Education Metric | Jewish Students | National Average | Details |
|---|---|---|---|
| Total Jewish School-Age Children | 18,289 | – | Aged 5-17 in 2021 |
| Jewish School Attendance Rate | 48% | – | Down from 54% in 2011 |
| Non-Jewish School Attendance | 52% | – | Attend government/private schools |
| Primary School Enrollment | 8,000+ | – | Modest growth |
| Secondary School Enrollment | 6,500+ | – | 19% increase 2011-2021 |
| University Qualification Rate | High | Lower | Significantly above national |
| Bachelor Degree or Higher | 45%+ | 28% | Well above national |
| Number of Jewish Day Schools | 20+ | – | Across Australia |
| Victorian Jewish Schools | 11 | – | Enrolling 5,500 students K-12 |
| NSW Jewish Schools | 5+ | – | Major schools in Sydney |
Data Source: Australian Council of Jewish Schools; JCA Reports 2024; Australian Curriculum Assessment and Reporting Authority
The Jewish school attendance rate of 48% in 2021, down from 54% in 2011, represents one of the most significant educational trends in the community. This 6 percentage point decline means that for the first time, a majority of Jewish children now attend non-Jewish schools – either government schools or secular private schools. Demographer Dr. David Graham suggests this decline “may be driven by financial factors or changing family preferences,” noting that Jewish day schools are considerably more expensive than government schools, with annual fees often exceeding $20,000-30,000 per child.
Secondary school enrollment showed strong growth with a 19% increase from 2011 to 2021, reflecting a demographic wave as the primary school boom of the mid-2010s moved into high school. However, Dr. Graham cautions these aren’t permanent changes: “the number of kids will shrink, not because of any demand change, because there are simply fewer kids” due to declining birth rates. The Jewish community maintains exceptional educational attainment levels, with over 45% holding Bachelor degrees or higher compared to approximately 28% nationally. Major Jewish schools include Mount Scopus Memorial College and Leibler Yavneh College in Melbourne (both exceeding 1,000 students), and Moriah College in Sydney (1,405 students). The Australian Council of Jewish Schools represents 16 member schools across Australia, operating independently but sharing common challenges around affordability, security costs, and maintaining Jewish identity alongside academic excellence.
Employment and Occupation of Jews in Australia 2025
| Occupation Category | Jewish Workers (%) | National (%) | Over/Under Representation |
|---|---|---|---|
| Professionals | 38% | 24% | Significantly over-represented |
| Managers | 20% | 14% | Over-represented |
| Clerical/Administrative | 12% | 14% | Slightly under-represented |
| Sales Workers | 10% | 9% | Similar to national |
| Community/Personal Services | 8% | 12% | Under-represented |
| Technicians/Trade Workers | 5% | 13% | Significantly under-represented |
| Labourers | 3% | 9% | Significantly under-represented |
| Machinery Operators/Drivers | 1% | 6% | Significantly under-represented |
Data Source: JCA 2021 Census Reports; JCCV Victoria Census Analysis; Australian Bureau of Statistics
The occupational profile of Jews in Australia reveals dramatic over-representation in professional and managerial roles. A striking 38% work as professionals – including doctors, lawyers, accountants, engineers, and teachers – compared to just 24% nationally. This represents nearly a 60% higher concentration in professional occupations. When combined with the 20% working as managers, approximately 58% of employed Jews hold professional or managerial positions compared to 38% of all Australians.
Conversely, Jews are significantly under-represented in manual labor, trades, and machinery operation. Only 5% work as technicians or trade workers compared to 13% nationally, and just 3% work as labourers versus 9% nationally. This occupational distribution partly explains the community’s elevated income levels and educational attainment patterns. Within professional categories, Jews show particular strength in legal services, accounting and financial services, medical practice, and education. The Jewish employment rate remains high, with strong workforce participation even among older workers. Men are more likely to work as managers (25%) compared to women (14%), while women show higher representation in clerical and administrative roles (17%) versus men (7%), reflecting broader gendered employment patterns that persist within the Jewish community despite overall high educational achievement for both sexes.
Income Levels of Jews in Australia 2025
| Income Measure | Jewish Community | National Average | Difference |
|---|---|---|---|
| Median Personal Income | $59,800 | $41,900 | +43% |
| Median Household Income | $134,900 | $93,800 | +44% |
| Households Earning $260,000+ | 24% | 8% | 3x higher |
| Men’s Median Weekly Income | $1,500-1,999 | Lower | Higher bracket |
| Women’s Median Weekly Income | $1,000-1,999 | Lower | Higher bracket |
| Home Ownership (Outright) | 38% | 31% | +7 points |
| Home Ownership (Mortgage) | 32% | 34% | Similar |
| Renting | 24% | 30% | Lower |
| Victorian Jewish Median | $131,000 (household) | $91,000 | +44% |
Data Source: JCA 2021 Census Report; JCCV Victoria 2021 Census Report; ABS Census 2021
The Jewish community’s median personal income of $59,800 represents a substantial 43% premium over the national median of $41,900, reflecting the concentration in professional and managerial occupations. This income advantage extends to household level, where the Jewish median of $134,900 exceeds the national figure by 44%. Perhaps most striking is that 24% of Jewish families earn $260,000 or more annually – triple the national rate of 8%. This places nearly one-quarter of Jewish households in the top income brackets.
Income levels vary significantly by household composition within the Jewish community. Couple households with children show the highest median income at $210,000, while single-parent families earn considerably less, highlighting economic disparities within the community. The higher income levels translate into elevated home ownership rates, with 38% of Jews owning homes outright compared to 31% nationally. However, 32% are purchasing with mortgages (similar to the national 34%), and 24% rent (below the national 30%). Geographic differences exist, with Sydney Jews twice as likely to live in apartments as Melbourne Jews, partly reflecting different housing markets and preferences. Despite overall prosperity, the Jewish community does include economically disadvantaged members, with the 2021 census recording 220 homeless or marginally housed Jews nationwide, underscoring that wealth is not universal within the community.
Migration Patterns of Jews in Australia 2025
| Migration Source | Trend 2011-2021 | Historical Pattern | Current Status |
|---|---|---|---|
| Israel | Largest source | Historically modest | Now #1 source of Jewish migrants |
| South Africa | Declining | Traditionally large 1980s-2000s | Continues but reduced |
| Former Soviet Union | Declining | Major source 1990s-2000s | Minimal recent arrivals |
| United Kingdom | Modest | Consistent small numbers | Ongoing |
| United States | Small numbers | Limited historically | Small but steady |
| Net Migration | Near zero | Previously positive | Arrivals balanced by departures |
| Internal Migration | Sydney→Melbourne | Historical reverse pattern | First time net flow to Melbourne |
Data Source: JCA 2021 Census Report; Dr. David Graham demographic analysis; The Australian Jewish News
A historic shift has occurred in Jewish migration to Australia, with Israel now representing the largest source of new Jewish arrivals for the first time in Australian history. This marks a dramatic change from previous decades when South Africa and the Former Soviet Union dominated Jewish immigration. Israeli migration reflects multiple factors including young Israelis seeking economic opportunities, families desiring lifestyle changes, and some Israelis pursuing education in Australian universities who then remain permanently.
However, the overall migration picture has reached a “net zero” scenario, where arrivals roughly equal departures. The Jewish population gain from immigration is now balanced by emigration, primarily of young adults moving to Israel, the United States, and the United Kingdom for education, career opportunities, or aliyah (immigration to Israel). Within Australia, internal migration patterns show Jews leaving Sydney for Melbourne for the first time, reversing historical trends. Dr. David Graham notes this shift is “driven by all sorts of different factors internally” including “bang for buck, extra space for young families” with Melbourne’s more affordable housing attracting Sydney families priced out of eastern suburbs neighborhoods. Migration to Queensland’s Gold Coast shows retirement-driven movement, with retirees seeking warmer climates and lower costs. Small Jewish communities are emerging in regional areas, though the overwhelming trend remains toward metropolitan concentration in Melbourne and Sydney’s established Jewish neighborhoods where community infrastructure, schools, and services provide critical support networks.
Jewish Community Organizations in Australia 2025
| Organization Type | Number | Key Examples | Primary Function |
|---|---|---|---|
| Peak Bodies | 3+ | ECAJ, JCCV, JCA | Representation and coordination |
| Synagogues | 150+ | Great Synagogue Sydney, various | Religious services and community |
| Jewish Schools | 20+ | Mount Scopus, Moriah College | Education K-12 |
| Universities with Jewish Studies | 2 | Monash, University of Sydney | Higher education and research |
| Aged Care Facilities | 10+ | Jewish Care Victoria, Emanuel | Elder care services |
| Community Centers | 5+ | Hakoah Club Sydney, various | Social and cultural activities |
| Security Organizations | 1 | Community Security Group | Protection and safety |
| Welfare Organizations | 15+ | Jewish Care, various | Social services |
Data Source: Jewish Communal Appeal; Jewish Community Council of Victoria; Australian Council of Jewish Schools
The Executive Council of Australian Jewry (ECAJ) serves as the peak representative body for Australian Jewry, providing a unified voice on national issues, combating antisemitism, and liaising with government. Co-CEO Peter Wertheim noted the 2021 census figure of 99,956 Jews represents an all-time record and “falls in line with projections based on the last 40 years of Census figures.” State-level bodies include the Jewish Community Council of Victoria (JCCV) and the Jewish Communal Appeal (JCA) in NSW and ACT, which coordinate services across their regions.
The community operates over 150 synagogues representing diverse religious movements including Orthodox (the majority), Conservative, Reform/Progressive, and Humanistic streams. Melbourne’s Caulfield area alone hosts dozens of congregations. Jewish Care organizations in both Victoria and NSW provide comprehensive aged care, disability services, mental health support, and social work to community members in need. The Community Security Group (CSG) coordinates security for Jewish institutions, schools, and events, operating with increased intensity following global antisemitic incidents. Cultural institutions include the Sydney Jewish Museum, the Jewish Museum of Australia in Melbourne, and Kadimah Cultural Centre preserving Yiddish heritage. Radio stations 2EA (Sydney) and 3EA (Melbourne) broadcast in multiple languages including Hebrew and Yiddish. The Australian Jewish News, published in both cities, serves as the community’s primary newspaper, while The Jewish Report provides monthly coverage and various online platforms have emerged as traditional print media declines.
Health and Disability in the Jewish Community 2025
| Health Measure | Jewish Community | National | Notes |
|---|---|---|---|
| Mental Health Conditions | 10,694 people (9.4%) | Lower % | Most common health condition |
| Requiring Care Assistance | 3,688 people | – | Over half aged 75+ |
| Living in Aged Care | 1,300+ | – | Nursing homes nationwide |
| Aged Care (NSW) | 494+ undercount | – | 2021 Census data gap |
| Disability Support Needs | Growing | – | Aging population impact |
| Unpaid Care Providers | High numbers | – | Family caregivers |
| Volunteering for Health | 27% | 14% | Nearly double national rate |
Data Source: JCA 2021 Census Report; Australian Bureau of Statistics
Mental health emerges as the most prevalent health condition among Jews in Australia, with an estimated 10,694 people (9.4% of the community) reporting mental health conditions in the 2021 census. This figure likely understates the true prevalence given stigma around mental health disclosure. The Jewish community has responded by expanding mental health services, with organizations like Jewish Care offering specialized counseling, support groups, and crisis intervention.
The aging demographic creates substantial care challenges, with over 3,688 Jews requiring assistance with core activities, and more than half of these individuals aged 75 or above. The 2021 census revealed a significant undercount: at least 494 Jewish residents of aged care facilities in NSW were omitted from census data due to COVID-19 restrictions preventing proper enumeration in these settings. An estimated 1,300+ Jews live in nursing homes nationwide, served by dedicated Jewish aged care facilities that provide culturally appropriate care including kosher food, Jewish holiday observances, and Hebrew-speaking staff. The dramatic increase projected for Jews in their 80s over the next decade will strain these facilities’ capacity. Demographer Dr. David Graham warns this aging trend “will bring significant challenges” requiring “proactive planning.” The Jewish community demonstrates exceptional civic engagement with a 27% volunteering rate – nearly double the 14% national average – with many volunteers providing unpaid care to family members, friends, and community members facing disability, illness, or age-related needs.
Languages Spoken by Jews in Australia 2025
| Language | Number of Speakers | % of Jewish Community | Context |
|---|---|---|---|
| English Only | 75,000+ | 75.1% | Primary language |
| English + Other Language | 21,900 | 21.9% | Bilingual households |
| English “Very Well” | 16,900 | 16.9% | Non-native high proficiency |
| Hebrew | 11,504 | 11.5% | 52% increase since 2006 |
| Russian | 9,964 | 10.0% | Former Soviet Union migrants |
| Yiddish | 3,000+ | 3.0% | Primarily Haredi community |
| Other Languages | Several thousand | Various | French, Hungarian, Polish, etc. |
Data Source: Australian Bureau of Statistics 2021 Census; JCA Reports; Wikipedia
The linguistic profile of Jews in Australia 2025 reflects the community’s diverse origins and integration patterns. An overwhelming 75.1% speak only English, demonstrating high integration into Australian society. Among the 24.9% who speak another language, the distribution reveals migration history and communal subcultures. Hebrew speakers number 11,504 as of 2021, representing a remarkable 52% increase since 2006. This growth reflects Israeli immigration, families raising children with Hebrew, and educational efforts in Jewish day schools where Modern Hebrew is taught.
Russian speakers at 9,964 represent the legacy of large-scale immigration from the Former Soviet Union during the 1990s and 2000s, when tens of thousands of Jews fled post-Soviet states seeking stability and opportunity. Yiddish, the historic language of Ashkenazi Jewry, is spoken by approximately 3,000+ Jews, primarily within Haredi (ultra-Orthodox) communities in Melbourne and Sydney where Yiddish remains the daily vernacular. Several thousand Hassidic and Haredi Jews in Melbourne speak Yiddish as their everyday language, maintaining this linguistic heritage across generations. Other languages represented include French (from North African Jewish communities), Hungarian and Polish (from Holocaust survivors and their descendants), and Ladino (from the small Sephardic community). The 21.9% who are bilingual tend to maintain heritage languages while demonstrating strong English proficiency, with 16.9% rating their English as “Very Well” and another 5.0% as “Well”. This linguistic diversity enriches communal life through multilingual services, cultural programs, and intergenerational knowledge transmission, even as English dominates as the community’s primary language.
Country of Birth for Jews in Australia 2025
| Country of Birth | Number | Wave/Period | Notes |
|---|---|---|---|
| Australia | 60,000+ | Native-born | Majority of community |
| Israel | 8,000+ | Recent waves | Now largest migrant source |
| South Africa | 12,000+ | 1980s-2010s | Major historical source |
| Former Soviet Union | 10,000+ | 1990s-2000s | Post-Soviet migration |
| United Kingdom | 5,000+ | Various periods | Consistent small flow |
| Poland/Hungary | 4,000+ | Holocaust survivors | Declining elderly cohort |
| North Africa/Middle East | 7,668 | Various periods | Including Iran, Turkey, Egypt |
| United States | 2,000+ | Various periods | Small but steady |
Data Source: ABS 2021 Census; JCA Migration Analysis; The Jerusalem Post
The majority of Jews in Australia 2025 – over 60,000 – are now Australian-born, representing approximately 51% of the community. This native-born majority marks a significant milestone in community development, as Australian Jewish identity solidifies across generations. Among the 49% born overseas, migration sources have shifted dramatically in recent years. Israel has emerged as the largest source of recent Jewish migration, with over 8,000 Israeli-born Jews now residing in Australia, primarily arriving in the 2010s and 2020s.
South African Jews remain a substantial presence at over 12,000, primarily arriving during the 1980s through 2010s as political instability, crime, and economic concerns drove emigration from South Africa. Sydney’s Jewish population shows particularly strong South African influence, with over two-thirds of Sydney’s Jewish population originating from South Africa, Hungary, the Former Soviet Union, and Israel. The Former Soviet Union contribution exceeds 10,000, representing the wave of Jewish refugees who fled during the 1990s following the USSR’s collapse. Holocaust survivors born in Poland, Hungary, and other Eastern European countries form a declining cohort of approximately 4,000, now in their 80s and 90s. The 2021 census recorded 7,668 Jews born in North Africa and the Middle East, including Israel and Muslim-majority countries like Iran, Egypt, Turkey, and Iraq. British-born Jews number around 5,000, representing consistent if modest immigration from the UK across decades. Migration within Australia shows internal movement, with some Jews relocating between states, particularly from Sydney to Melbourne in recent years, seeking more affordable housing.
Disclaimer: This research report is compiled from publicly available sources. While reasonable efforts have been made to ensure accuracy, no representation or warranty, express or implied, is given as to the completeness or reliability of the information. We accept no liability for any errors, omissions, losses, or damages of any kind arising from the use of this report.