
Hispanic Latino People in the US 2026
The Hispanic and Latino population in the United States has crossed a historic threshold in 2026, representing one of the most consequential demographic shifts in the nation’s history. With more than 70.1 million people identifying as Hispanic or Latino, this community now comprises approximately 21% of the total U.S. population, cementing its position as the nation’s largest and fastest-growing minority group. This milestone reflects decades of sustained growth driven by both natural increase and migration, with Hispanic families contributing substantially to the country’s demographic vitality through a notably younger age structure.
The influence of Hispanic Latino Americans now extends into nearly every dimension of national life, from a $4.1 trillion contribution to U.S. GDP to a rapidly expanding electorate of 39 million eligible voters heading into the 2026 midterms. From major metropolitan hubs to small rural communities, Hispanic Latino communities continue reshaping the cultural, economic, and political landscape of the country. Understanding the current state of the Hispanic Latino population in 2026 is essential for policymakers, educators, and business leaders navigating an increasingly diverse American future.
Interesting Stats & Facts About Hispanic Latino Americans in US 2026
| Fact Category | Statistic | Significance |
|---|---|---|
| Total Population | 70.1 million people | Represents 21% of total U.S. population |
| Median Age | 31 years | 8 years younger than the national median of 39 |
| Youth Population | 29% under age 18 | Well above the national average of 21% |
| Eligible Voters (2026) | 39 million | Up 16% from the prior midterm cycle |
| Poverty Rate (2025) | 13.9% | Historic low, down 1.2 points from 2024 |
| Median Household Income (2025) | $73,260 | No statistically significant change from 2024 |
| Homeowner Households (2025) | 10.2 million | Record high; 441,000 net new households |
| GDP Contribution | $4.1 trillion | Reflects growing economic footprint |
| Unemployment Rate | 4.6% (July 2026) | Bureau of Labor Statistics |
| Largest Origin Group | Mexican Americans | Comprise the majority of all Hispanic Americans |
Data Source: U.S. Census Bureau, Pew Research Center, Bureau of Labor Statistics, National Association of Hispanic Real Estate Professionals
The data presented in this table reveals a demographic group whose scale and economic weight have both reached new highs in 2026. The 70.1 million Hispanic Americans now recorded by the Census Bureau mark the first time this population has crossed the 70 million threshold, a milestone reached as of July 2025 and confirmed in Census figures released in August 2026. The median age of 31 years continues to position the Hispanic population as significantly younger than the overall U.S. population, creating a demographic dividend that will sustain workforce growth for decades. That youthfulness is even more pronounced than previously recorded, with 29% of the Hispanic population now under 18, compared to just 21% nationally.
Perhaps the most striking figures this year are economic. The Hispanic poverty rate fell to 13.9% in 2025, the lowest level recorded since the Census Bureau began tracking Hispanic poverty in 1973, even as it remains disproportionately high relative to the national rate of 10.2%. At the same time, Hispanic homeownership hit a record 10.2 million households, with a net gain of 441,000 owner-households in a single year, the largest annual increase ever recorded for any racial or ethnic group. Combined with an electorate that has grown 16% to 39 million eligible voters and a $4.1 trillion contribution to GDP, these figures illustrate a community whose weight continues to expand even amid persistent structural gaps.
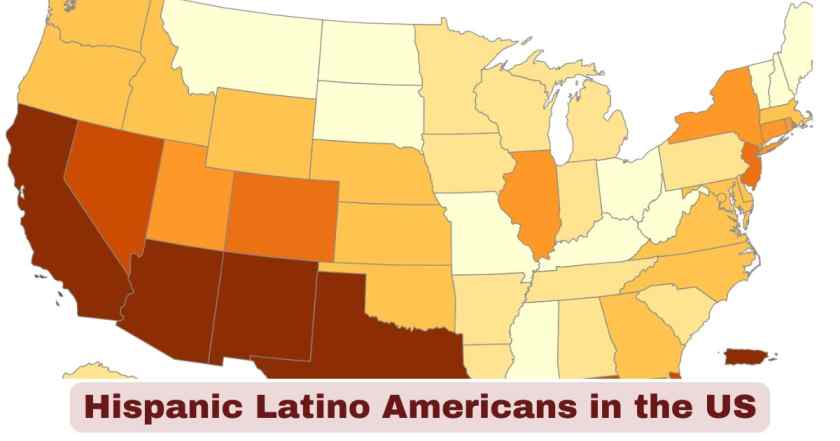
Hispanic Latino Population Growth and Distribution in US 2026
| State | Hispanic Population | Percentage of State Population | Rank |
|---|---|---|---|
| California | 15.5 million | 39.4% | 1 |
| Texas | 12 million | 39.8% | 2 |
| Florida | 6 million | 26.5% | 3 |
| New York | 3.7 million | 19.0% | 4 |
| Arizona | 2.3 million | 31.6% | 5 |
| Illinois | 2.2 million | 17.4% | 6 |
| New Jersey | 2 million | 22.7% | 7 |
| Colorado | 1.3 million | 22.7% | 8 |
| New Mexico | 1 million | 49.3% | 9 |
| Georgia | 1.1 million | 10.3% | 10 |
Data Source: U.S. Census Bureau Population Estimates, World Population Review 2026
The geographic distribution of Hispanic Latino Americans across U.S. states in 2026 demonstrates both entrenched concentration patterns and expanding demographic reach nationwide. California remains the epicenter of the Hispanic population with 15.5 million residents, though New Mexico continues to lead in percentage terms at 49.3%, the only state where Hispanics constitute nearly half the total population. Texas follows closely behind in raw numbers at 12 million residents, or 39.8% of the state’s population, reflecting its continuing role as a primary gateway for Hispanic migration.
At least 15 states now hold over 1 million Hispanic residents each, illustrating how thoroughly this demographic transformation extends beyond California and Texas. Florida’s 6 million Hispanic residents reflect substantial Caribbean communities, particularly Cuban, Puerto Rican, and Venezuelan populations, while continued growth in Colorado, Nevada, and Arizona shows how the Mountain West has been reshaped by sustained Hispanic population growth. Nationally, growth has consistently outpaced the non-Hispanic rate for over two decades, with natural increase, more births than deaths, remaining the primary driver even as net international migration adds smaller but meaningful annual gains.
Educational Attainment Among Hispanic Latino Americans in US 2026
| Education Level | Hispanic Latino Percentage | National Average | Growth Trend |
|---|---|---|---|
| High School Graduation | 88.5% (ages 25-29) | 93.0% | Up from 58.2% in 1996 |
| Bachelor’s Degree or Higher | 22% (ages 25+) | 39% | Nearly doubled in two decades |
| College Enrollment | 18.4% of undergraduates | N/A | Over 3.6 million students |
| First-Generation College Students | 70% | 33% national average | Highest among ethnic groups |
| Hispanic-Serving Institutions | 67% attend HSIs | N/A | 465+ institutions nationwide |
Data Source: U.S. Census Bureau Current Population Survey, National Center for Education Statistics
Educational attainment among Hispanic Latino Americans has shown sustained improvement over the past three decades, though meaningful gaps persist relative to other demographic groups. The high school graduation rate of 88.5% for Hispanics ages 25-29 represents dramatic progress from the 58.2% recorded in 1996, a more than 30-percentage-point increase reflecting expanded educational access and sustained family commitment to schooling. The 22% bachelor’s degree attainment rate among Hispanics ages 25 and older continues to trail the 39% national average, though enrollment of over 3.6 million Hispanic students in postsecondary institutions makes this the largest minority group in American higher education.
The concentration of 70% of Hispanic students as first-generation college attendees highlights the educational mobility underway within Hispanic families, alongside the distinctive challenges these students face navigating higher education without parental guidance through the system. The fact that 67% of Hispanic students attend Hispanic-Serving Institutions, colleges where at least a quarter of undergraduate enrollment is Hispanic, underscores the critical role these specialized institutions play in providing accessible education pathways for a population still working to close degree-completion gaps.
Employment and Labor Force Participation of Hispanic Latino Americans in US 2026
| Employment Metric | Hispanic Latino Statistics | Comparison Detail |
|---|---|---|
| Unemployment Rate | 4.6% (July 2026) | Bureau of Labor Statistics series |
| Labor Force Participation Rate | ~67% | Consistently above national average |
| Self-Employment Rate | 10.0% | Higher entrepreneurial activity than national rate |
| Median Weekly Earnings | $920 (Q2 2025) | Below the national median |
| Share of U.S. Labor Force | ~20% | Growing steadily since 2003 |
Data Source: U.S. Bureau of Labor Statistics Current Population Survey
The Hispanic Latino workforce remains an indispensable component of the American economy, with a labor force participation rate that consistently exceeds the national average, driven largely by a population concentrated in prime working ages. The unemployment rate of 4.6% as of July 2026 sits modestly above the overall national rate, reflecting persistent occupational segregation and educational attainment gaps even as Hispanic workforce participation continues to climb. Unemployment fluctuated through 2026, briefly rising above 5% in spring before easing back toward 4.6% by midsummer, tracking broader softening in the national labor market.
The 10.0% self-employment rate among Hispanic workers, higher than the comparable non-Hispanic rate, showcases sustained entrepreneurial initiative across the community. Hispanic workers remain concentrated in construction, food services, administrative support, and manufacturing, with continued underrepresentation in higher-paying professional occupations contributing to the persistent median weekly earnings gap. The Bureau of Labor Statistics continues to project a steadily rising Hispanic share of the overall workforce through the next decade.
Income and Poverty Among Hispanic Latino Households in US 2026
| Economic Indicator | Hispanic Latino Data (2025) | National Comparison |
|---|---|---|
| Median Household Income | $73,260 | $87,460 nationally |
| Poverty Rate | 13.9% | 10.2% nationally |
| Poverty Rate Change from 2024 | -1.2 percentage points | Historic low for Hispanics |
| Uninsured Rate (ages 19-64) | 21.8% | Highest of major racial/ethnic groups |
| National Poverty Rate Change | 10.7% to 10.2% | Third straight year of decline |
Data Source: U.S. Census Bureau, Income, Poverty and Health Insurance Coverage in the United States: 2025
The economic status of Hispanic Latino households showed a genuinely mixed picture in the Census Bureau’s newest release, covering the 2025 calendar year. Median household income for Hispanic families stood at $73,260, showing no statistically significant change from 2024, even as the overall national median climbed to a record $87,460, the highest level recorded since the Bureau began tracking this measure in 1967. That divergence left the income gap largely unchanged from the prior year, even as most other major racial groups saw measurable gains.
Poverty told a more encouraging story. The Hispanic poverty rate fell to 13.9% in 2025, a 1.2-percentage-point drop from 2024 and the lowest rate ever recorded for the group since the Census Bureau began publishing Hispanic-specific poverty estimates in 1973, when the rate stood at 21.9%. Even so, Hispanic individuals remain overrepresented within the overall poverty population. Healthcare access continues to lag furthest behind: 21.8% of Hispanic adults aged 19 to 64 were uninsured in 2025, the highest uninsured rate of any major racial or ethnic group tracked by the Bureau.
Hispanic Latino Homeownership and Wealth in US 2026
| Housing and Wealth Metric | Hispanic Latino Data (2025) | Trend |
|---|---|---|
| Total Hispanic Homeowners | 10.2 million households | Record high |
| Net New Owner-Households (2025) | 441,000 | Largest single-year gain ever recorded |
| Homeownership Rate | 48.5% | Down slightly from 49% in 2024 |
| Share of National Household Formation | 92.6% | Hispanics drove nearly all U.S. household growth |
| New Households Formed (2025) | 1,094,000 | Outpaced every other demographic group |
Data Source: National Association of Hispanic Real Estate Professionals, 2026 State of Hispanic Wealth Report
Hispanic homeownership reached an unprecedented milestone in 2025, with 10.2 million Hispanic households now owning their homes, driven by a net gain of 441,000 owner-households in a single year, the largest annual increase ever recorded for this population. That surge was so significant it accounted for all of the net homeownership growth in the United States last year, fully offsetting declines recorded among non-Hispanic white and non-Hispanic Black households. Without those gains, the nation as a whole would have recorded a net loss of roughly 125,000 homeowners in 2025.
Hispanic Heritage Month statistics documenting the community’s cultural and economic milestones this year provide useful additional context, since the housing surge coincided with Hispanic households forming 1,094,000 new households in 2025 alone, representing 92.6% of the nation’s entire household formation growth. That dominance occurred even as the homeownership rate dipped slightly to 48.5%, down from 49% the prior year, a gap NAHREP analysts attribute to rising home prices and continued credit access barriers.
Hispanic Latino Political Participation and Representation in US 2026
| Political Metric | Hispanic Latino Data | Representation Level |
|---|---|---|
| Congressional Members (119th Congress) | 56 members | 6 senators, 50 House members |
| Latina State Legislators | 214 members | 2.9% of state legislators |
| Latina Governors | 1 active | Only 2 ever elected, both from New Mexico |
| Eligible Voters (2026 midterms) | 39 million | Up 16% from prior midterm cycle |
| GDP Contribution | $4.1 trillion | Reflects growing economic influence |
Data Source: U.S. Congress Records, Center for American Women and Politics, Census Bureau
The political representation of Hispanic Latino Americans has expanded substantially in recent decades, though it still lags behind the group’s population share. The 56 Hispanic or Latino members currently serving in the 119th Congress, including 6 senators and 50 House representatives, represents a dramatic increase from just 14 members four decades ago. Representation remains below the 21% population share, though the trajectory continues moving upward.
Heading into the 2026 midterm elections, Hispanic eligible voters have grown 16% to reach 39 million, a surge that continues to elevate the community’s influence in closely contested states. At the state level, Latina representation in state legislatures holds at 214 members, or 2.9% of all state legislators nationwide, while New Mexico Governor Michelle Lujan Grisham remains the only active Latina governor in American history. Combined with a $4.1 trillion contribution to national GDP, these figures point to a community whose political and economic weight continues to climb in tandem.
Hispanic Latino Age Distribution and Generational Demographics in US 2026
| Age Group | Hispanic Population Share | National Comparison |
|---|---|---|
| Under 18 Years | 29% | 21% nationally |
| Median Age (Hispanic) | 31 years | 39 years national median |
| Prime Working Age (25-54) | ~56% of Hispanic adults | Concentrated relative to national profile |
| 65 Years and Older | ~12% | Well below the national share |
Data Source: U.S. Census Bureau American Community Survey, Population Estimates 2026
The age distribution of Hispanic Latino Americans in 2026 continues to reveal a remarkably youthful demographic profile that distinguishes this population from every other major racial and ethnic group in the country. With a median age of just 31 years, 8 years younger than the overall U.S. median of 39, the Hispanic population possesses a demographic vitality that will continue driving workforce and consumer growth for decades. The concentration of 29% of the Hispanic population under age 18 represents millions of young people who will shape the nation’s schools, workforce, and civic institutions over the next two decades.
This youth-heavy structure stands in sharp contrast to the aging non-Hispanic white population, whose median age exceeds 44 years. The relatively small share of Hispanics aged 65 and older means the population currently places comparatively light demands on Social Security and Medicare while contributing disproportionately to payroll tax revenue. Census Bureau long-range projections continue to indicate that the Hispanic population will exceed 100 million by mid-century.
Hispanic Latino Household and Family Structure in US 2026
| Family Structure Metric | Hispanic Statistics | National Average |
|---|---|---|
| Average Household Size | 3.66 people | 3.15 people |
| Family Households with Children | 4.28 people average | 3.8 people |
| Married Two-Parent Families | 55% of children | 67% nationally |
| Multigenerational Households | 32.1% | 17.7% |
Data Source: U.S. Census Bureau American Community Survey, Current Population Survey
The family structure of Hispanic Latino households continues to demonstrate distinctive patterns shaped by cultural values, economic circumstances, and strong intergenerational support systems. Hispanic families average 3.66 people per household, substantially larger than the 3.15 national average, with families containing children averaging 4.28 people. This larger household size reflects both comparatively higher fertility rates and a greater likelihood of extended family co-residence.
Among Hispanic children, roughly 55% live with two married parents, a lower share than the 67% national average, while 32.1% of Hispanic households are classified as multigenerational, nearly double the 17.7% rate among non-Hispanic households. Non Hispanic Whites in US tracking the comparison population’s own household patterns underscore just how distinctive this multigenerational structure remains, with Hispanic families continuing to pool resources across generations to manage housing costs, childcare, and eldercare.
Hispanic Latino Business Ownership and Entrepreneurship in US 2026
| Business Metric | Hispanic Latino Statistics | Economic Impact |
|---|---|---|
| Employer Businesses | 465,202 firms (2022) | 7.9% of all U.S. employer businesses |
| Total Businesses Owned | 5 million+ firms | 14.5% of all business owners |
| Employees | 3.55 million workers | Growing job creation |
| Annual Revenue | $653 billion | Substantial economic contribution |
Data Source: U.S. Census Bureau Annual Business Survey, U.S. Small Business Administration
Hispanic Latino entrepreneurship remains one of the most dynamic forces in the American economy, with business ownership growth continuing to far outpace other demographic groups. The 465,202 Hispanic-owned employer businesses recorded in the most recent Annual Business Survey reflect sustained expansion from earlier in the decade, when growth reached 44.4% between 2017 and 2022 alone, compared to less than 1% annual growth across all U.S. employer businesses over the same period. Including both employer and non-employer firms, Hispanic Americans now own more than 5 million businesses, or 14.5% of all business owners nationwide.
Famous Hispanic Latino Americans profiling notable figures from across business, entertainment, and public life illustrate the cultural visibility accompanying this economic expansion. These Hispanic-owned businesses employed 3.55 million workers and generated $653 billion in total revenue. Despite this growth, Hispanic-owned businesses remain underrepresented at 7.9% of all employer businesses relative to the population’s 21% share, pointing to continued room for expansion as capital access and lending gaps close over time.
Hispanic Latino Population Outlook for 2026 and Beyond
| Projection Metric | Figure |
|---|---|
| Projected Hispanic Population by 2060 | ~111 million |
| Projected Share of U.S. Population by 2060 | ~27% |
| Share of Hispanic Population, Gen Z or Younger | ~40% |
| Projected Hispanic Labor Force Share by 2032 | ~22% |
Data Source: U.S. Census Bureau National Population Projections
Long-range Census Bureau projections continue to indicate that the Hispanic population will approach 111 million people by 2060, representing roughly 27% of the total U.S. population and more than doubling current levels. This sustained growth, driven primarily by natural increase rather than immigration, ensures continued demographic vitality even as immigration patterns fluctuate year to year. With approximately 40% of the Hispanic population belonging to Gen Z or younger, the highest share of any major ethnic group, younger Hispanic Americans are positioned to become an increasingly decisive force in the nation’s culture, politics, and consumer markets.
The Bureau of Labor Statistics projects that Hispanic workers will account for approximately 22% of the total U.S. labor force by 2032, up from roughly 20% today, reinforcing this population’s role as the primary source of workforce replenishment as the Baby Boomer generation retires. Combined with rising educational attainment, record homeownership gains, and an expanding electorate, these projections point toward a Hispanic Latino population whose influence will continue compounding well beyond 2026.
Disclaimer: This research report is compiled from publicly available sources. While reasonable efforts have been made to ensure accuracy, no representation or warranty, express or implied, is given as to the completeness or reliability of the information. We accept no liability for any errors, omissions, losses, or damages of any kind arising from the use of this report.