
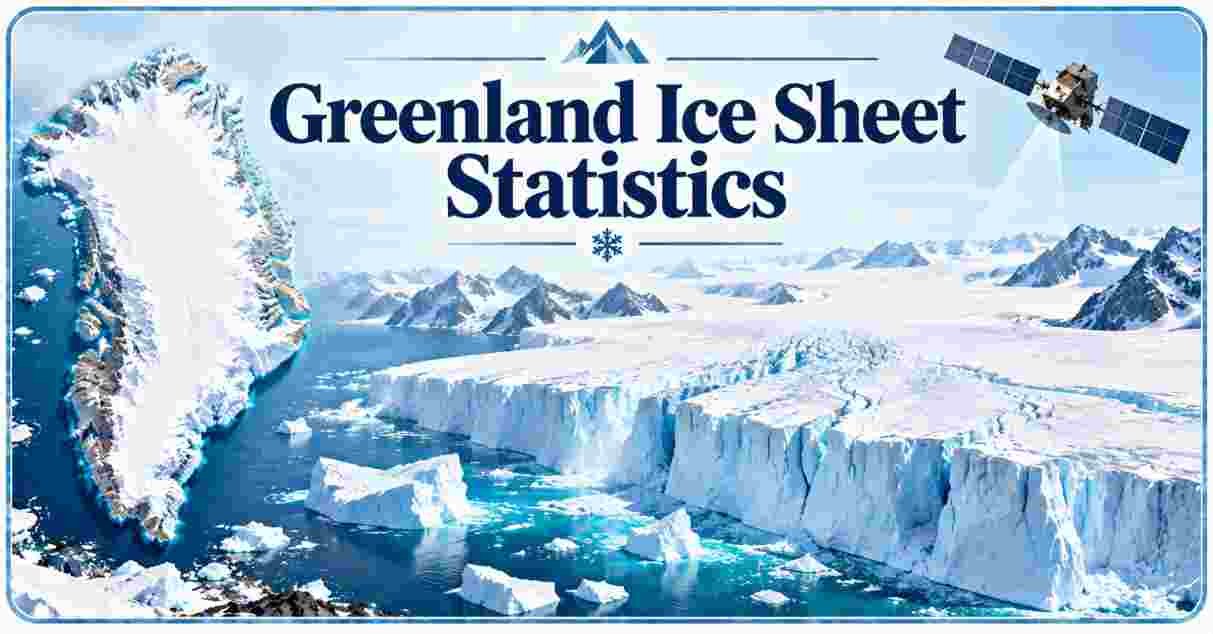
The Greenland Ice Sheet lost about 173 billion tonnes of ice during the 2025–26 melt year, marking its 30th consecutive year of net ice loss, according to the Geological Survey of Denmark and Greenland (GEUS). This followed a loss of approximately 130 billion tonnes in 2024–25. The ice sheet holds enough frozen water to raise global sea levels by approximately 7.4 meters (23 feet) if it melted completely.
Greenland Ice Sheet 2026: Introduction
The Greenland Ice Sheet is the largest body of land ice in the Northern Hemisphere. It covers approximately 80% of Greenland, reaches more than 3 kilometers in thickness at its deepest point, and contains about 2.9 million cubic kilometers of ice.
Scientists assess its annual mass balance over a period ending on August 31. According to the figures cited in this report, the Greenland Ice Sheet lost approximately 173 billion tonnes (Gt) during the 2025–26 melt year. This extends its net ice-loss streak to 30 consecutive years.
This report examines Greenland Ice Sheet mass loss, melting rates, ice discharge, global sea-level rise, US coastal projections, Arctic warming, and long-term forecasts. It brings together figures attributed to government agencies, university research teams, the Copernicus Climate Change Service, and GEUS. Measurement periods and methods differ between datasets, so the source and reporting period should be considered when comparing results.
Greenland Ice Sheet Interesting Facts 2026
| Fact | Data |
|---|---|
| Ice mass lost during the 2025–26 melt year | Approximately 173 Gt |
| Ice mass lost during the 2024–25 melt year | Approximately 130 Gt |
| Consecutive years of net ice loss | 30 |
| Record annual ice loss in 2012 | Approximately 458 Gt |
| Cumulative ice loss over 40 years | 6,205 Gt |
| Sea-level rise from the 40-year loss | More than 1.7 cm |
| Share of Greenland covered by ice | Approximately 80% |
| Total ice volume | Approximately 2.9 million km³ |
| Potential global sea-level rise from complete melting | Approximately 7.4 meters (23 feet) |
Source: GEUS Greenland Ice Sheet mass-balance assessment, September 2026; NSIDC Ice Sheets Today.
The reported 173 Gt loss in 2025–26 was 43 Gt greater than the approximately 130 Gt lost during the previous melt year. However, it remained well below the 2012 record of approximately 458 Gt.
The Greenland Ice Sheet has experienced a prolonged period of net mass loss since the mid-1990s. The 30-year streak highlights the persistence of this trend, although individual years can vary considerably because of snowfall, summer temperatures, surface melting, and glacier discharge.
The long-term figures demonstrate the scale of the change. According to the cited assessment, approximately 6,205 Gt of ice was lost over 40 years, contributing more than 1.7 cm to global sea-level rise.
A single gigatonne represents one billion metric tonnes. One cubic kilometer of water has a mass of approximately one gigatonne, making these measurements useful for understanding the potential contribution of ice loss to rising oceans.
Greenland Ice Sheet Ice Loss 2026: Annual Mass Balance Statistics
| Measurement | Period | Reported Mass Loss |
|---|---|---|
| GEUS melt-year assessment | 2025–26 | 173 Gt |
| GEUS melt-year assessment | 2024–25 | 130 Gt |
| GRACE-FO assessment cited by NOAA | 2024–25 | 129 ± 50 Gt |
| Copernicus hydrological-year assessment | 2024–25 | 139 ± 79 Gt |
| GRACE and GRACE-FO average | 2003–2024 | 219 ± 16 Gt per year |
| NASA satellite-era estimate | Since 2002 | Approximately 265 Gt per year |
Source: GEUS, September 2026; NOAA Arctic Report Card 2025; Copernicus European State of the Climate 2025; NASA Global Sea Level Change.
The GEUS figure of 173 Gt covers the melt year from September 1, 2025, through August 31, 2026. It represents a larger annual loss than the preceding melt year.
Other datasets provide useful comparisons. NOAA’s cited GRACE-FO estimate places the 2024–25 loss at 129 ± 50 Gt, while Copernicus reports 139 ± 79 Gt for its corresponding reporting period. These estimates have substantial uncertainty ranges and broadly overlap.
Differences between measurements can arise because researchers use different approaches to assess the ice sheet. Gravity satellites detect changes in mass, laser altimeters measure changes in surface elevation, and climate models estimate snowfall and surface runoff.
Longer-term estimates show higher average losses. GRACE and GRACE-FO observations indicate an average annual loss of 219 ± 16 Gt from 2003 to 2024. NASA’s cited estimate places the average at approximately 265 Gt per year since 2002.
These longer averages provide context for recent annual results. A lower loss in a particular year does not necessarily indicate that the long-term trend has reversed. Weather conditions, precipitation, and the timing of summer warmth can all influence the annual balance.
Greenland Ice Sheet Melting Rate 2026: Melt Extent and Extreme Events
| Melt Metric | Reported Value | Period |
|---|---|---|
| Peak daily melt extent | 752,000 km², approximately 45% of the ice sheet | July 19, 2025 |
| Large September melt spike | 592,000 km² | September 3, 2022 |
| Average extreme-event meltwater | 12.7 Gt per decade | 1950–2023 |
| Extreme-event meltwater in the recent period | 82.4 Gt per decade | Since 1990 |
| Increase in area affected by extreme events | 2.8 million km² per decade | Since 1990 |
| Top 10 extreme melt events occurring after 2000 | 7 events | Through 2023 |
Source: NSIDC Ice Sheets Today; NASA Earth Observatory; University of Barcelona research published in Nature Communications, May 2026.
NSIDC recorded a peak melt extent of 752,000 km² on July 19, 2025, equivalent to approximately 45% of the Greenland Ice Sheet. A major September melt event reached 592,000 km² on September 3, 2022.
Melt extent measures the area where surface melting is detected. It does not represent the total volume of ice lost, so it should not be directly compared with annual mass-loss figures.
The 2025 melt season also illustrates why the extent of melting and the total ice balance can tell different stories. NOAA’s Arctic Report Card described the melt extent as close to the 1991–2020 average, while many locations experienced more melt days than usual. Summer snowfall helped brighten the surface and limited the expansion of melting in some areas.
The melt season generally extends from spring into autumn, with the most intense surface melting typically occurring between June and August.
Research covering extreme melt events from 1950 to 2023 found a substantial increase in meltwater associated with these episodes. The study reported an average of 12.7 Gt per decade across the full record, compared with 82.4 Gt per decade since 1990.
The research also found that the area affected by extreme events has expanded and that seven of the ten most extreme events occurred after 2000. These findings point to an increased role for intense melting events in Greenland’s changing ice-sheet conditions.
Greenland Ice Sheet Ice Discharge vs. Snowfall 2026
| Component | Reported Value | Period |
|---|---|---|
| Estimated snowfall needed for mass balance | Approximately 680 Gt per year | Long-term estimate |
| Ice discharge | 491 ± 17 Gt | 2025 mass-balance year |
| Average ice discharge | 458 ± 27 Gt per year | 1991–2020 |
| Surface runoff contribution to total loss | Approximately 50% | Recent decades |
| Ocean-front discharge contribution to total loss | Approximately 50% | Recent decades |
| ICESat-2 annual average mass-loss estimate | 134 ± 62 Gt | 2020–2024 |
Source: NOAA Arctic Report Card 2025; University at Buffalo; University of Washington; NASA; University of Cambridge Department of Geography.
The Greenland Ice Sheet loses ice through two main processes: surface melting and runoff, and the movement of glaciers toward the ocean, where icebergs break away and marine-terminating glaciers can lose ice through contact with relatively warm seawater.
NOAA’s cited assessment reports ice discharge of 491 ± 17 Gt during the 2025 mass-balance year. This compares with a 1991–2020 average of 458 ± 27 Gt.
Ice discharge has exceeded surface mass balance in every year since the mid-1990s, according to the cited assessment. Over recent decades, approximately half of the total ice loss has been attributed to surface runoff, with the remainder associated with discharge at the ocean margin.
Snowfall is an important counterbalance because it replenishes the ice sheet. Above-average winter and summer precipitation can reduce net losses, even when glacier discharge remains elevated.
ICESat-2 laser-altimetry measurements provide another way to monitor changes in ice-sheet elevation. The cited 2020–2024 average loss was 134 ± 62 Gt per year. The uncertainty reflects challenges such as changes in snow density and the distinction between surface-height changes and actual changes in ice mass.
The estimated 680 Gt of annual snowfall needed for balance provides a useful benchmark. The ice sheet experiences net loss when the combined effects of runoff and ice discharge exceed the mass added through snowfall.
Greenland Ice Sheet Sea-Level Rise 2026: Global Contribution
| Sea-Level Metric | Reported Value | Period |
|---|---|---|
| Sea-level contribution from the 2024–25 ice loss | Approximately 0.4 mm | 2024–25 |
| Approximate conversion | 100 Gt equals 0.28 mm | Polar Portal |
| Average annual sea-level contribution | Approximately 0.69 mm | 2003–2025 |
| Cumulative sea-level contribution | More than 1.7 cm | 1986–87 to 2025–26 |
| Global mean sea-level rise | 93.4 mm | Since 1993, through August 2025 |
| Average global sea-level rise rate | Approximately 3.6 mm per year | Since 1993 |
| Greenland’s estimated share of current sea-level rise | Approximately 20% | Copernicus estimate |
| Potential sea-level rise from complete melting | Approximately 7.4 meters | Complete ice-sheet loss |
Source: Copernicus Climate Change Service; Polar Portal; NASA Global Sea Level Change; NSIDC.
The Greenland Ice Sheet contributes to global sea-level rise when land-based ice melts and the resulting water enters the ocean. Ice discharge into the ocean also contributes to rising sea levels.
Copernicus estimates that Greenland’s 2025 ice loss raised global mean sea level by approximately 0.4 mm. Polar Portal provides an approximate conversion of 100 Gt of ice loss to 0.28 mm of global sea-level rise.
Applying that conversion to the reported 173 Gt loss during 2025–26 produces an estimated contribution of approximately 0.48 mm, or about 0.5 mm. This is a calculation based on the reported mass loss, rather than a separately observed sea-level measurement.
The cited 2003–2025 average of 252 km³ of annual ice loss corresponds to approximately 0.69 mm of sea-level rise per year.
Over the reported 40-year period, cumulative ice loss exceeded 6,200 Gt, contributing more than 1.7 cm to global sea-level rise. NASA satellite measurements also show that global mean sea level rose substantially between 1993 and August 2025.
Greenland’s contribution is significant, but it is only one component of global sea-level rise. Ocean warming causes seawater to expand, while melting glaciers and the Antarctic Ice Sheet also add water to the oceans.
If the entire Greenland Ice Sheet melted, global mean sea level would rise by approximately 7.4 meters (23 feet). This represents a long-term physical potential, not a prediction that complete melting will occur in the near future.
Greenland Ice Sheet Sea-Level Rise in the US 2026: Coastal Projections
| US Region | Projected Rise by 2050 | Coastal Flooding Context |
|---|---|---|
| Western Gulf Coast | 16–18 inches | Significant exposure to rising coastal water levels |
| Eastern Gulf Coast | 14–16 inches | Approximately 3 moderate sunny-day floods per year in the cited projection |
| Southeast Coast | 12–14 inches | Approximately 4 moderate sunny-day floods per year in the cited projection |
| Northeast Coast | 10–12 inches | Approximately 6 moderate sunny-day floods per year in the cited projection |
| US coastal average | 10–12 inches | Damaging floods projected to become substantially more frequent |
Source: NOAA National Ocean Service and six federal partners, 2022 Sea Level Rise Technical Report.
NOAA’s 2022 Sea Level Rise Technical Report projects approximately 10–12 inches of average sea-level rise along the US coast between 2020 and 2050. This represents a rate of change comparable to the rise observed over the previous century, compressed into approximately 30 years.
The report identifies the Gulf Coast as a particularly exposed region. Projected rise ranges from 16 to 18 inches along the western Gulf Coast and 14 to 16 inches along the eastern Gulf Coast. The Southeast Coast is projected to experience 12–14 inches, while the Northeast Coast is projected to see 10–12 inches.
Higher sea levels make it easier for tides, storm surges, and other coastal-water events to reach areas that previously flooded less frequently. NOAA’s projections indicate that moderate high-tide flooding could become much more frequent in several coastal regions.
The report also describes a broad range of possible outcomes by 2100. Approximately 2 feet of sea-level rise is increasingly likely under the report’s assessment of committed change, while high-end scenarios involving stronger warming and ice-sheet instability can produce substantially greater rise.
These projections describe changes in coastal sea level from multiple causes. They should not be interpreted as sea-level rise caused by Greenland alone.
Greenland Ice Sheet and Arctic Warming 2026: Temperature Statistics
| Arctic Indicator | Reported Finding | Period |
|---|---|---|
| Arctic surface air temperature | Warmest period since records began in 1900 | October 2024–September 2025 |
| Warmest years in the historical record | The ten warmest years were the latest ten years | Latest decade assessed |
| Arctic warming relative to global warming | More than twice the global rate | Since 2006 |
| Atlantic-sector sea-surface temperature anomaly | Approximately +13°F (+7°C) | August 2025 versus 1991–2020 |
| Decline in oldest Arctic sea ice | More than 95% | Since the 1980s |
| Summit Station temperature | Record-high monthly mean | April 2025 |
Source: NOAA Arctic Report Card 2025, including its Arctic climate and Greenland Ice Sheet assessments.
NOAA’s Arctic Report Card identified October 2024 through September 2025 as the warmest Arctic year in the observational record beginning in 1900. It also reported that the ten warmest years in the record were the most recent ten.
Since 2006, the Arctic has warmed at more than twice the global rate, although the precise ratio depends on the selected period and dataset. This phenomenon, commonly known as Arctic amplification, is influenced by several factors, including changes in snow and ice cover, atmospheric conditions, and heat exchange between the ocean and atmosphere.
Temperatures around Greenland are important because warmer conditions can increase surface melting and alter snowfall patterns. Summit Station, located high on the ice sheet, recorded a record-high monthly mean temperature in April 2025, according to the cited report.
Ocean temperatures also matter. In August 2025, sea-surface temperatures in parts of the Arctic Ocean’s Atlantic sector were reported to be approximately 7°C above the 1991–2020 August average. Such anomalies are geographically specific and should not be interpreted as a uniform temperature increase across the entire Arctic Ocean.
The oldest Arctic sea ice has declined by more than 95% since the 1980s. Remaining multiyear ice is concentrated in areas north of Greenland and the Canadian Archipelago.
Changes in sea ice, snow cover, and surface reflectivity can influence regional energy absorption. Darker surfaces absorb more sunlight than bright snow and ice, potentially increasing local melting when other conditions are favorable.
Greenland Ice Sheet Future 2026: Long-Term Melt Projections
| Projection | Reported Value | Scenario or Time Frame |
|---|---|---|
| Global sea-level rise from complete ice-sheet loss | Approximately 7.4 meters (23 feet) | Complete melting |
| Near-complete ice-sheet loss | More than 7 meters of sea-level rise | By 3000 under a cited SSP5-8.5 simulation |
| Summer-warming threshold identified by a model | Approximately 1.8 K | Long-term equilibrium analysis |
| Increase in extreme melt anomalies | Up to threefold | By 2100 under high emissions |
| US coastal sea-level rise | Approximately 2 feet | By 2100 in the cited committed-rise assessment |
| High-end US coastal sea-level rise | 3.5–7 feet (1.1–2.1 meters) | High-warming and ice-instability scenarios |
Source: The Cryosphere, European Geosciences Union, 2026; University of Barcelona research, 2026; NSIDC; NOAA Sea Level Rise Technical Report.
The Greenland Ice Sheet contains enough ice to raise global mean sea level by approximately 7.4 meters if it melted completely. However, the timing and extent of future ice loss depend on atmospheric warming, ocean temperatures, snowfall, glacier dynamics, and feedback mechanisms within the ice sheet.
A cited 2026 simulation using a coupled ice-sheet and regional climate model projected near-complete ice-sheet loss by the year 3000 under the high-emissions SSP5-8.5 scenario. The modeled outcome included more than 7 meters of sea-level rise.
Long-term models must account for feedback mechanisms that can intensify melting. One example is the melt-elevation feedback: as an ice sheet loses thickness, its surface can descend into warmer air, increasing the potential for additional melting.
A separate 2026 study published in The Cryosphere identified approximately 1.8 K of summer warming as a threshold associated with an increased risk of long-term ice-sheet collapse in its modeled equilibrium conditions. Such thresholds are model-dependent findings, not precise dates or guaranteed tipping points for real-world change.
Research from the University of Barcelona also projected that extreme melt anomalies could become up to three times as large by 2100 under high-emissions conditions.
For US coastal communities, NOAA’s scenarios range from approximately 2 feet of rise to high-end estimates of 7 feet by 2100. These estimates reflect multiple contributors to sea-level rise, including thermal expansion and changes in land-based ice.
The projections are scenarios rather than exact forecasts. Future outcomes depend heavily on global emissions, climate feedbacks, and how the Greenland and Antarctic ice sheets respond to continued warming.
Greenland Ice Sheet FAQ 2026
How much ice is the Greenland Ice Sheet losing per year in 2026?
The reported loss was approximately 173 Gt during the 2025–26 melt year, according to GEUS. Longer-term estimates indicate average annual losses of 219 ± 16 Gt from 2003 to 2024 and approximately 265 Gt per year since 2002 in the cited NASA assessment.
Is the Greenland Ice Sheet melting faster in 2026 than in 2025?
The reported annual mass loss was higher for the 2025–26 melt year than for 2024–25. GEUS reported approximately 173 Gt compared with 130 Gt, respectively. Both figures remain below the cited satellite-era averages, and 2012 holds the reported annual loss record of approximately 458 Gt.
How many consecutive years has the Greenland Ice Sheet lost ice?
According to the cited GEUS assessment, the Greenland Ice Sheet has experienced 30 consecutive years of net mass loss. The sequence began in 1996–97, following the last reported year of net gain in 1995–96.
How large is the Greenland Ice Sheet in 2026?
The ice sheet covers approximately 80% of Greenland, with an area of about 1.7 million km² (656,000 square miles). Its estimated volume is approximately 2.9 million km³, and its maximum thickness exceeds 3 kilometers.
How much would global sea levels rise if the Greenland Ice Sheet melted completely?
Complete melting would raise global mean sea level by approximately 7.4 meters (23 feet). This is the ice sheet’s estimated total sea-level potential, not a prediction of near-term sea-level rise.
How much does Greenland’s ice loss contribute to sea-level rise each year?
The cited Copernicus assessment estimates that Greenland’s 2025 ice loss contributed approximately 0.4 mm to global mean sea-level rise. The reported 2003–2025 average contribution was approximately 0.69 mm per year.
How will Greenland Ice Sheet melting affect US coastlines?
NOAA’s 2022 report projects approximately 10–12 inches of average sea-level rise along US coasts by 2050, with 14–18 inches projected for parts of the Gulf Coast. High-end scenarios show considerably greater rise by 2100. These projections include several sources of sea-level rise, not just Greenland ice loss.
How do scientists measure Greenland Ice Sheet mass loss?
Scientists combine several techniques, including GRACE and GRACE-FO gravity measurements, ICESat-2 laser altimetry, satellite radar observations of glacier movement, and weather-station data used in surface-mass-balance models. Each method measures a different aspect of ice-sheet change, and researchers combine them to improve estimates.
What does a gigatonne mean in Greenland Ice Sheet measurements?
A gigatonne (Gt) equals one billion metric tonnes. One cubic kilometer of water has a mass of approximately one gigatonne. Using the approximate conversion from Polar Portal, 100 Gt of ice loss corresponds to about 0.28 mm of global mean sea-level rise.
Can Greenland Ice Sheet melting affect ocean currents?
Greenland’s meltwater adds freshwater to the North Atlantic, potentially affecting ocean density and circulation. Scientists study the possible effects on the Atlantic Meridional Overturning Circulation (AMOC), but the magnitude and timing of any changes remain uncertain. Continued observations and climate modeling are needed to better understand these risks.
Disclaimer: This research report is compiled from publicly available sources. While reasonable efforts have been made to ensure accuracy, no representation or warranty, express or implied, is given as to the completeness or reliability of the information. We accept no liability for any errors, omissions, losses, or damages of any kind arising from the use of this report.