
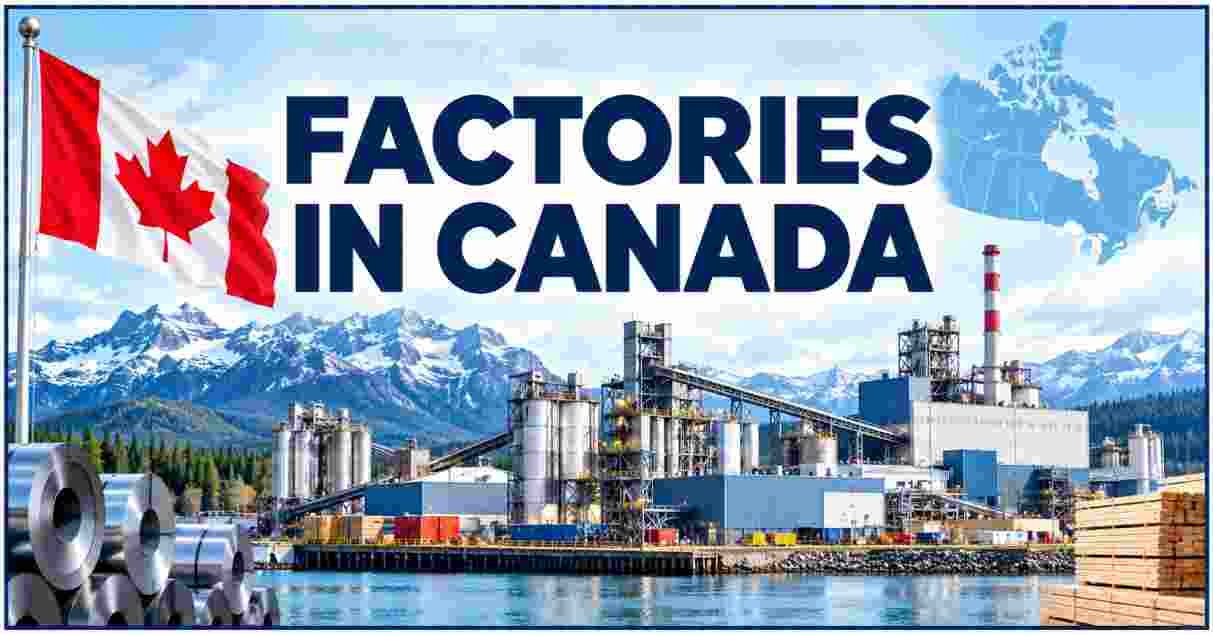
Canada has 95,960 manufacturing establishments as of 2025, including 51,353 factories with employees, and about 1.52 million manufacturing payroll jobs as of December 2025. Ontario (20,456) and Quebec (13,352) hold about two thirds of employer factories, and Canadian manufacturing sales reached $79.9 billion in August 2026.
Factories in Canada 2026
Factories in Canada 2026 number about 51,353 with employees and 95,960 counting every registered manufacturing establishment, according to Statistics Canada data published through the federal Canadian Industry Statistics tool. The government counts plants, factories, and mills together as manufacturing establishments, classified under NAICS 31 to 33 by their main product. About 93% of employer factories have fewer than 100 workers, and only 344 employ 500 or more. Ontario alone holds 20,456 employer factories, nearly 40% of the national total.
The counts sit beside weaker employment. Manufacturing payroll jobs fell by 40,600 in 2025 to about 1.52 million, and U.S. tariffs hit steel, aluminum, lumber, and autos hard. Sales still climbed to $79.9 billion in August 2026, mostly on higher prices. This report covers factory counts by province, size, and industry, then employment, sales, capacity use, and trade exposure. The latest provincial and industry counts are from 2025. Statistics Canada published June 2026 business counts in August (1.37 million employer businesses across all industries), but the manufacturing detail used here is the 2025 tabulation.
Interesting Facts About Factories in Canada 2026
| Fact | Data (Period) |
|---|---|
| Manufacturing establishments | 95,960 (2025) |
| Factories with employees | 51,353 (2025) |
| Factories without employees or indeterminate | 44,607 (2025) |
| Share of employer factories with under 100 workers | 93.3% (calculated, 2025) |
| Large factories (500+ employees) | 344 (2025) |
| Province with the most employer factories | Ontario, 20,456 |
| Manufacturing payroll employment | About 1.52 million (December 2025), down 40,600 |
| Manufacturing sales | $79.9 billion (August 2026); $848.7 billion (2025) |
| Capacity utilization | 81.9% (August 2026) |
| Manufactured goods exports / imports | $465.7 billion / $661.0 billion (2024) |
| Manufacturing value added | $311.4 billion (2023) |
The establishment counts and the sales figures cover different things. A factory count tells you how many sites exist, and it includes sole proprietors and workshops. Sales and employment show how much those sites produce and who works in them. Statistics Canada advises caution when adding the employer and non-employer counts, because they come from different sources and the two groups do not make up the whole universe of companies.
Sector averages add context. The typical small manufacturer earned an average of $777,300 in revenue in 2024, and 70.6% were profitable. Sector GDP fell 2.6% in 2024 and labour productivity fell 4.7%. Wages averaged $30.73 an hour. The picture is a sector with many small firms, thin margins, and rising exposure to U.S. trade policy, and the sections below follow each of those threads.
Number of Factories in Canada by Province 2026
Employer factories by province, 2025 (scale: 20,456 = 40 blocks)
Ontario                   ████████████████████████████████████████ 20,456
Quebec                    ██████████████████████████ 13,352
British Columbia          ██████████████ 7,363
Alberta                   ██████████ 5,047
Manitoba                  ███ 1,403
Nova Scotia               ██ 1,070
Saskatchewan              ██ 1,052
New Brunswick             ██ 909
Newfoundland and Labrador █ 394
Prince Edward Island      █ 248
| Province | Employer Factories | Non-Employer / Indeterminate | Total | Share of Employers | Employers per 100,000 People |
|---|---|---|---|---|---|
| Ontario | 20,456 | 18,584 | 39,040 | 39.8% | 127 |
| Quebec | 13,352 | 9,982 | 23,334 | 26.0% | 148 |
| British Columbia | 7,363 | 7,112 | 14,475 | 14.3% | 130 |
| Alberta | 5,047 | 5,048 | 10,095 | 9.8% | 100 |
| Manitoba | 1,403 | 1,137 | 2,540 | 2.7% | 93 |
| Nova Scotia | 1,070 | 789 | 1,859 | 2.1% | 98 |
| Saskatchewan | 1,052 | 982 | 2,034 | 2.0% | 83 |
| New Brunswick | 909 | 545 | 1,454 | 1.8% | 105 |
| Newfoundland and Labrador | 394 | 234 | 628 | 0.8% | 72 |
| Prince Edward Island | 248 | 138 | 386 | 0.5% | 136 |
| Yukon | 34 | 36 | 70 | 0.1% | n/a |
| Northwest Territories | 16 | 16 | 32 | 0.0% | n/a |
| Nunavut | 9 | 4 | 13 | 0.0% | n/a |
| Canada | 51,353 | 44,607 | 95,960 | 100% | n/a |
Data source: Statistics Canada special tabulation via Innovation, Science and Economic Development Canada, Canadian Industry Statistics (2025); per-capita figures calculated using Statistics Canada population estimates for January 1, 2026.
Ontario and Quebec hold 33,808 of the 51,353 employer factories, or 65.8%. British Columbia adds 7,363 and Alberta 5,047, so four provinces account for 90% of the national total. Ontario’s 39.8% share of employer factories roughly matches its 38.9% share of the population, so the province is not unusually dense with factories. Quebec stands out. It has 148 employer factories per 100,000 residents, the highest rate among the provinces, followed by Prince Edward Island at 136 and British Columbia at 130.
Western and Atlantic provinces trail on the per-capita measure. Alberta has 100 employer factories per 100,000 people, Manitoba 93, Saskatchewan 83, and Newfoundland and Labrador 72. Large numbers of non-employer establishments push total counts higher in places such as British Columbia and Alberta, where non-employers nearly match employers. Those units are often one-person shops, so the employer count gives a better view of operating factories.
Factory Size in Canada 2026
Employer factories by size, 2025 (scale: 30,465 = 40 blocks)
Micro (1-4)      ███████████████████████ 17,424
Small (5-99)     ████████████████████████████████████████ 30,465
Medium (100-499) ████ 3,120
Large (500+)     █ 344
| Size Category | Employer Factories | Share | Largest Provincial Count |
|---|---|---|---|
| Micro (1 to 4 employees) | 17,424 | 33.9% | Ontario, 7,124 |
| Small (5 to 99 employees) | 30,465 | 59.3% | Ontario, 11,848 |
| Medium (100 to 499 employees) | 3,120 | 6.1% | Ontario, 1,320 |
| Large (500 or more employees) | 344 | 0.7% | Ontario, 164 |
| Quebec: large factories | 87 | n/a | n/a |
| British Columbia: large factories | 18 | n/a | n/a |
| Alberta: large factories | 22 | n/a | n/a |
| Manitoba: large factories | 23 | n/a | n/a |
Data source: Statistics Canada special tabulation via Innovation, Science and Economic Development Canada, Canadian Industry Statistics (2025).
Small plants dominate. Micro and small factories together make up 93.3% of employer sites, with 47,889 of 51,353 having under 100 workers. Medium factories number 3,120 and large ones 344. Ontario holds 164 of the 344 large factories, 47.7% of them, followed by Quebec with 87. Large plants matter far more to employment than their count suggests, since a single auto assembly or aerospace plant can employ thousands of workers.
The distribution explains why tariffs and demand shocks spread unevenly. A few hundred large and medium plants anchor the auto, aerospace, steel, and food supply chains, while tens of thousands of small shops supply parts, tooling, and services to them. When a large plant cuts shifts, the small suppliers lose orders within weeks. About 34% of employer factories have fewer than five workers, so many owners run lean operations with little room to absorb a drop in sales.
Factories in Canada by Industry 2026
Manufacturing establishments by industry, 2025 (scale: 13,375 = 40 blocks)
Fabricated metal         ████████████████████████████████████████ 13,375
Food                     █████████████████████████████████████ 12,215
Wood product             ███████████████████ 6,414
Transportation equipment ███████████ 3,751
Primary metal            ███ 910
| Industry (NAICS) | Total Establishments | Share of 95,960 | Employer Establishments |
|---|---|---|---|
| Fabricated metal product (332) | 13,375 | 13.9% | 7,929 |
| Food manufacturing (311) | 12,215 | 12.7% | n/a |
| Wood product (321) | 6,414 | 6.7% | 3,273 |
| Transportation equipment (336) | 3,751 | 3.9% | n/a |
| Primary metal (331) | 910 | 0.9% | 579 |
| All manufacturing (31-33) | 95,960 | 100% | 51,353 |
| Establishments with under 100 workers, food | 90.6% | n/a | n/a |
| Establishments with under 100 workers, transportation equipment | 81.7% | n/a | n/a |
Data source: Statistics Canada special tabulation via Innovation, Science and Economic Development Canada, Canadian Industry Statistics (2025). Subsector counts for the other 16 manufacturing subsectors are available on the same tool.
Fabricated metal product manufacturers are the most numerous factories in Canada at 13,375, including machine shops, metal stamping, and structural metal makers. Food manufacturing follows with 12,215 sites. Together they account for 26.6% of all establishments. Wood product manufacturing adds 6,414, spread across sawmills, engineered wood, and millwork. These three industries have the most small sites, and they depend on regional supply chains and nearby customers.
Transportation equipment ranks lower by count at 3,751 establishments, yet it is one of the biggest employers, as the next section shows. Only 81.7% of its sites have under 100 workers, compared with 90.6% in food, so its plants run larger. Primary metal has just 910 establishments, but steel and aluminum mills carry heavy weight in exports and in the tariff dispute. Count and impact differ widely from one industry to the next.
Manufacturing Employment in Canada by Province 2026
Manufacturing payroll employment, December 2025
Ontario                                 █████████████████████████████████ 656,700
Quebec                                  ███████████████████████ 429,500
British Columbia                        █████████ 144,000
Other provinces and territories (calc.) ██████████████████ 293,200
| Province | Payroll Employees (Dec 2025) | Change vs Dec 2024 | Share of Canada | Jobs per Employer Factory |
|---|---|---|---|---|
| Ontario | 656,700 | -27,200 | 43.1% | 32 |
| Quebec | 429,500 | -7,000 | 28.2% | 32 |
| British Columbia | 144,000 | -2,700 | 9.5% | 20 |
| Other provinces and territories | 293,200 (calculated) | n/a | 19.2% | n/a |
| Canada | 1,523,400 (calculated) | -40,600 | 100% | 30 |
| Union coverage, all manufacturing | 21.6% (2025) | unchanged | n/a | n/a |
| Workers with a second job | 60,000 (3.3%) | little changed | n/a | n/a |
Data source: Statistics Canada, Survey of Employment, Payrolls and Hours, as analyzed in “Manufacturing labour in 2025: Losses down the line amid trade headwinds” (March 17, 2026); Labour Force Survey (2025); jobs-per-factory ratios calculated from 2025 establishment counts.
Ontario’s factories employed 656,700 people in December 2025, 43.1% of the national total, and shed 27,200 jobs in a year, mostly in durable goods. Quebec employed 429,500 (down 7,000) and British Columbia 144,000 (down 2,700). Every province except Prince Edward Island and Saskatchewan recorded losses, and those two were little changed. Ontario and Quebec both average about 32 payroll jobs per employer factory, while British Columbia averages 20, so its plants run smaller on average.
The labour force also shifted. Statistics Canada’s Labour Force Survey recorded 28,000 manufacturing job losses in January 2026, a gain of 22,000 in August, and a loss of about 13,000 in September, so the monthly trend swings widely. Canada’s overall population fell in 2025 for the first time since Confederation, and population is falling in Ontario and British Columbia, as Canada population decline statistics shows. That decline raises the risk of labour gaps in food processing, according to the federal immigration levels plan.
Manufacturing Employment in Canada by Industry 2026
Manufacturing payroll employment by industry, December 2025 (scale: 257,900 = 40 blocks)
Food manufacturing       ████████████████████████████████████████ 257,900
Transportation equipment ██████████████████████████████ 191,900
Fabricated metal product █████████████████████████ 161,200
Machinery                █████████████████████ 138,500
Plastics and rubber      ███████████████ 96,000
Chemical                 ██████████████ 92,404
| Industry | Payroll Employees (Dec 2025) | Change vs Dec 2024 |
|---|---|---|
| Food manufacturing | 257,900 | -5,000 |
| Transportation equipment | 191,900 | -9,300 |
| Fabricated metal product | 161,200 | -3,500 |
| Machinery | 138,500 | -3,600 |
| Plastics and rubber products | 96,000 | -2,700 |
| Chemical | 92,404 | -4,200 |
| All durable goods (10 subsectors) | 889,900 | -23,500 |
| All non-durable goods | 633,500 | -17,100 |
| Union coverage, non-durable vs durable | 23.7% vs 20.2% | n/a |
Data source: Statistics Canada, Survey of Employment, Payrolls and Hours, as analyzed in “Manufacturing labour in 2025: Losses down the line amid trade headwinds” (March 17, 2026).
Food manufacturing is the largest employer at 257,900 workers, 16.9% of manufacturing payroll employment (calculated), and it lost only 5,000 jobs in 2025. Transportation equipment is second at 191,900 after losing 9,300, the largest drop of any subsector listed. Fabricated metal product manufacturing holds third place at 161,200, and machinery follows at 138,500. Durable goods employment, which includes autos, metals, and machinery, fell 23,500 to 889,900, while non-durable goods fell 17,100 to 633,500.
The pattern tracks tariff exposure. Subsectors that sell into the U.S. market, such as transportation equipment, machinery, and fabricated metal, lost a combined 16,400 jobs, while food lost 5,000, about half the loss in transportation equipment. Chemical manufacturing lost 4,200 jobs and plastics and rubber lost 2,700. Statistics Canada said losses came “across the board” in non-durable goods, which means even plants far from the tariff fight felt the slowdown in demand.
Canada Manufacturing Sales, Output & Capacity Use 2026
Manufacturing sales, inventories, and unfilled orders, billions of dollars
Sep 2025 sales           █████████████████████ $72.1B
Aug 2026 sales           ████████████████████████ $79.9B
Aug 2026 inventories     ██████████████████████████████████████ $127.7B
Aug 2026 unfilled orders ████████████████████████████████████████ $134.2B
| Metric | Value (Period) |
|---|---|
| Manufacturing sales | $79.9 billion (August 2026), up 1.5% from July |
| Year-over-year sales growth | +14.2% (August 2026, current dollars) |
| Sales in constant dollars | Unchanged in August; Industrial Product Price Index up 1.3% |
| Subsectors with higher sales | 12 of 21 (August 2026) |
| Primary metal sales | +14.0% in August |
| Transportation equipment sales | $12.0 billion, down 2.6% (second straight decline) |
| Quebec sales growth | +15.1% year over year (August 2026) |
| Inventories / unfilled orders | $127.7 billion / $134.2 billion (August 2026) |
| Capacity utilization | 81.9% (August 2026); 80.7% (July) |
| S&P Global Canada Manufacturing PMI | 51.5 (September 2026); 53.0 (August) |
| Total 2025 sales / change | $848.7 billion / -0.4% |
| 2025 manufacturing output | -2.6%, third straight annual drop |
Data source: Statistics Canada, The Daily, Monthly Survey of Manufacturing, August 2026 (October 15, 2026); Statistics Canada, Manufacturing labour in 2025 (March 17, 2026); S&P Global Canada Manufacturing PMI (September 2026).
Sales rose 1.5% to $79.9 billion in August on gains in 12 of 21 subsectors, led by primary metal (+14.0%) and chemicals (+4.4%). The year-over-year gain of 14.2% looks strong, but sales in constant dollars were unchanged in August and prices rose 1.3% in the month, so price increases account for part of the gain. Capacity utilization climbed to 81.9% from 80.7%, a healthy level, though the sector’s real output fell 2.6% in 2025. Transportation equipment slid for a second month to $12.0 billion.
Order books show cautious optimism. Unfilled orders stand at $134.2 billion, steady with July, and inventories at $127.7 billion keep the inventory-to-sales ratio at 1.60. The S&P Global PMI dropped to 51.5 in September, its lowest in six months, though still above the 50 line that separates growth from contraction. For the macro backdrop behind these numbers, see Canada’s economy statistics, which covers GDP, unemployment, and trade.
US Tariffs on Canadian Factories & Trade Exposure 2026
US tariff rates on Canadian goods by product group, 2026
Steel, aluminum, copper             ████████████████████████████████████████ 50%
Autos and parts (partial exemption) ████████████████████ 25%
Wood products                       ████████████████████ 25%
Timber and lumber                   ████████ 10%
Most other goods (CUSMA exempt)     ████████ 10%
| Measure | Value |
|---|---|
| U.S. tariff on steel, aluminum, and copper | 50%, no CUSMA exemption |
| U.S. tariff on passenger vehicles and parts | 25%, with partial exemption for CUSMA-compliant content |
| U.S. tariff on wood products / timber and lumber | 25% / 10% (plus anti-dumping duties) |
| U.S. tariff on most other Canadian goods | 10%, with a CUSMA exemption |
| Share of Canadian exports facing sectoral tariffs | About 15% (Bank of Canada) |
| Share of Canadian output and employment in those sectors | About 1% (Bank of Canada) |
| Steel exports to the U.S. after tariffs | Down by about half |
| Lumber exports (February 2026 vs 2024) | About 20% lower |
| Value of all exports to the U.S., 2025 | -5.8% |
| Manufacturing employment supported by U.S. export demand | About 41% (Statistics Canada) |
| CUSMA joint review | July 1, 2026; U.S. did not agree to extend; annual reviews required |
Data source: Congressional Research Service, U.S.-Canada Trade Relations (September 2026); Bank of Canada Monetary Policy Report (April 29, 2026); Statistics Canada, Canadian international merchandise trade, December 2025; Statistics Canada value-added export study; Blakes tariff timeline (September 2026).
The tariff mix hits some factories far harder than others. Steel, aluminum, and copper face 50%, and Canadian steel exports to the U.S. fell by about half, while lumber exports were roughly 20% below 2024 levels by February 2026. Autos face 25% with partial exemptions for CUSMA-compliant content. Most other goods enter at 10% under the CUSMA exemption or duty free. The Bank of Canada estimates that tariffed industries are about 15% of exports but only about 1% of output and employment, so the damage concentrates in a few regions and plants.
The wider exposure is larger. Statistics Canada estimates that about 41% of manufacturing employment depends on demand from the United States, and all exports to the U.S. fell 5.8% in 2025. On July 1, 2026, the CUSMA joint review ended without a U.S. agreement to extend the pact, so the three countries must now review it every year until it expires in 2036. That annual cycle raises planning risk for plant investment. Readers who want sales and output detail can compare these tariff numbers with Canada manufacturing statistics.
Frequently Asked Questions About Factories in Canada 2026
How many factories are there in Canada in 2026?
Canada has 95,960 manufacturing establishments as of 2025, and 51,353 of them have employees. The count excludes unclassified businesses.
Which province has the most factories in Canada?
Ontario has the most, with 20,456 employer factories, about 39.8% of the national total. Quebec follows with 13,352 and British Columbia with 7,363.
How many factories does Quebec have?
Quebec has 13,352 employer factories and 9,982 non-employer or indeterminate establishments, a total of 23,334.
How many factories does Alberta have?
Alberta has 5,047 employer factories and 5,048 non-employer establishments, a total of 10,095.
What is the most common type of factory in Canada?
Fabricated metal product manufacturing, with 13,375 establishments, followed by food manufacturing with 12,215 and wood product manufacturing with 6,414.
How big are most Canadian factories?
Most are small. About 93.3% of employer factories have fewer than 100 employees, and only 344 have 500 or more.
How many people work in Canadian manufacturing?
Statistics Canada counted just over 1.5 million manufacturing payroll employees in December 2025, about 1,523,400 by the subsector totals. That was 40,600 fewer than a year earlier.
Which province has the most manufacturing jobs?
Ontario, with 656,700 payroll employees in December 2025, followed by Quebec with 429,500 and British Columbia with 144,000.
Which industry employs the most people in Canadian manufacturing?
Food manufacturing, with 257,900 payroll employees, followed by transportation equipment at 191,900 and fabricated metal products at 161,200.
How much does Canadian manufacturing sell each month?
Manufacturing sales were $79.9 billion in August 2026 and $848.7 billion across 2025.
What is the capacity utilization rate in Canadian manufacturing?
81.9% in August 2026, up from 80.7% in July.
How do U.S. tariffs affect Canadian factories?
Steel, aluminum, and copper face a 50% U.S. tariff, autos 25%, and most other goods 10% with a CUSMA exemption. About 41% of manufacturing employment depends on U.S. demand.
How much does Canada export in manufactured goods?
Canada exported $465.7 billion in manufactured goods and imported $661.0 billion in 2024.
What counts as a factory in Canadian statistics?
Statistics Canada counts manufacturing establishments under NAICS 31 to 33. They transform materials into new products, and are known as plants, factories, or mills.
Disclaimer: This research report is compiled from publicly available sources. While reasonable efforts have been made to ensure accuracy, no representation or warranty, express or implied, is given as to the completeness or reliability of the information. We accept no liability for any errors, omissions, losses, or damages of any kind arising from the use of this report.