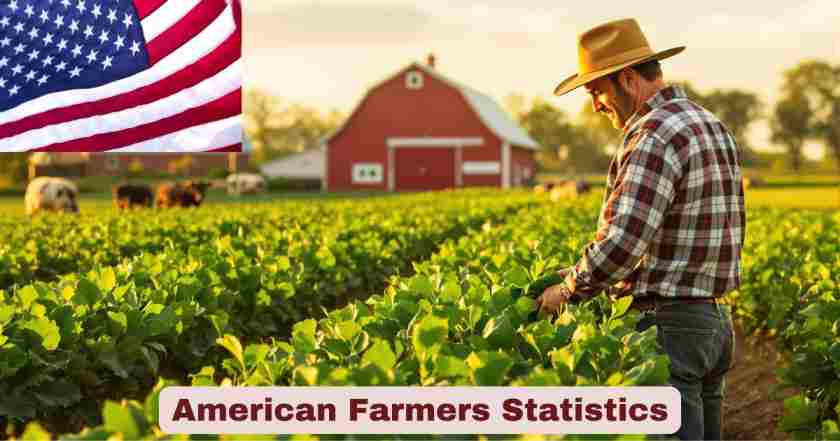
Farmers in America 2025
The agricultural landscape of America stands at a fascinating crossroads in 2025, where tradition meets innovation and challenges blend with remarkable opportunities. American farmers continue to feed not only the nation but contribute significantly to global food security, managing vast expanses of land with increasing efficiency and technological sophistication. The farming industry in the United States 2025 represents a critical component of the national economy, employing millions and generating hundreds of billions in revenue while facing unprecedented challenges from climate change, economic pressures, shifting demographics, and the impacts of ongoing trade tensions with China.
On December 8, 2025, President Trump announced a critical $12 billion aid package for American farmers, providing emergency relief to a sector severely impacted by tariffs and trade disruptions. This Farmer Bridge Assistance (FBA) Program allocates $11 billion for row crop producers growing corn, soybeans, cotton, wheat, and other major commodities, with the remaining $1 billion reserved for specialty crops including sugar. Agriculture Secretary Brooke Rollins confirmed that payments will be disbursed by February 28, 2026, offering crucial support as farmers face what the American Farm Bureau Federation estimates as $34 billion in total losses for 2025. The aid package, funded through tariff revenue according to President Trump, comes after China halted soybean purchases in May 2025 in retaliation for U.S. tariffs, leaving American soybean farmers facing massive market disruptions. While a preliminary trade agreement in October saw China commit to purchasing at least 12 million metric tons of soybeans in the final two months of 2025 and 25 million metric tons annually through 2028, actual purchases have fallen short, with only 2.2 million metric tons purchased as of early December.
Despite the declining number of farms over recent decades, American agriculture has demonstrated remarkable resilience and productivity growth. The 1.9 million farms operating across the nation today are more productive than ever before, utilizing advanced technologies, precision agriculture, and sustainable practices. These operations range from small family-owned plots to large-scale commercial enterprises, collectively managing 880 million acres of farmland. However, farmers now navigate an increasingly complex environment where high input costs, volatile commodity prices, elevated interest rates, and trade uncertainties create significant financial stress. As we examine the latest statistics and trends, it becomes clear that American farmers are adapting to new realities while maintaining their essential role as stewards of the land and providers of food, fiber, and fuel for the nation and the world, even as they require unprecedented levels of government support to weather current market conditions.
Interesting Facts About American Farmers in the US 2025
| Category | Statistic | Year |
|---|---|---|
| Total Number of Farms | 1.9 million | 2022 |
| Average Farm Size | 463-466 acres | 2024-2025 |
| Total Farmland | 880 million acres | 2022 |
| Family-Owned Farms | 95% of all farms | 2025 |
| Average Farmer Age | 58.1 years | 2022 |
| Female Producers | 1.2 million (36.3%) | 2022 |
| Beginning Farmers | Over 1 million | 2022 |
| Producers Over Age 55 | 63.2% | 2022 |
| Farmers Under Age 35 | 9% | 2022 |
| Military Veterans as Farmers | 305,753 (9.1%) | 2022 |
| Gross Cash Farm Income (GCFI) | $623.9 billion | 2025 forecast |
| Net Farm Income (NFI) | $179.8 billion | 2025 forecast |
| Total Agricultural Product Sales | $543 billion | 2022 |
| Farm Production Expenses | $467.4 billion | 2025 forecast |
| Trump Emergency Aid Package | $12 billion | December 2025 |
| Estimated Farmer Losses 2025 | $34 billion | 2025 estimate |
| China Soybean Purchases (Oct-Dec) | 2.2 million metric tons | 2025 actual |
| Average Farm Real Estate Value | $4,350 per acre | 2025 |
| Average Cropland Value | $5,830 per acre | 2025 |
| Organic Farms | 17,048 certified | 2022 |
| Organic Product Sales | $9.6 billion | 2022 |
| Corn Planted Acres | 95.2 million acres | 2025 |
| Soybean Planted Acres | 83.4 million acres | 2025 |
Data Source: USDA National Agricultural Statistics Service (NASS), Economic Research Service (ERS), 2022 Census of Agriculture, 2025 Farm Sector Income Forecast
The data presented above reveals the remarkable scope and scale of American agriculture in 2025, while also highlighting the severe economic pressures currently facing the sector. With 1.9 million farms operating across the country, the agricultural sector maintains its position as a cornerstone of the American economy despite facing significant demographic and economic challenges including the ongoing trade war impacts. The $12 billion emergency aid package announced December 8, 2025 by President Trump underscores the severity of the crisis, with the American Farm Bureau Federation estimating total farmer losses at $34 billion for the year. This relief comes after China, historically the largest buyer of U.S. soybeans, halted purchases in May 2025 in response to American tariffs, devastating an export market worth billions annually.
The average farm size of 463-466 acres reflects a trend toward consolidation, where operations are becoming larger and more efficient to remain economically viable amid rising costs and compressed margins. What makes this particularly significant is that family-owned farms constitute 95% of all agricultural operations, demonstrating that despite consolidation pressures, family farming remains the dominant model in American agriculture. However, these family operations now face unprecedented challenges, with farmers receiving historically low prices for most major crops while simultaneously dealing with elevated input costs for feed, fertilizer, fuel, seed, and equipment. The trade dynamics have proven especially harmful, with China’s soybean purchases from October through early December 2025 totaling only 2.2 million metric tons, far below the 12 million metric tons promised in the October trade agreement and drastically lower than historical purchase levels that exceeded 25 million metric tons annually in years prior to the trade war. Treasury Secretary Scott Bessent noted that domestic soybean prices have risen approximately 15% since the October trade agreement, but this increase comes after dramatic declines and doesn’t fully compensate farmers for lost export volumes and increased production costs tied to tariffs on inputs.
The demographic profile of American farmers reveals important trends about the future of agriculture. The average farmer age of 58.1 years continues a long-term trend of an aging agricultural workforce, which raises concerns about succession planning and the transfer of farming knowledge and land to younger generations. However, there are encouraging signs with over 1 million beginning farmers entering the industry, suggesting renewed interest in agricultural careers. The presence of 1.2 million female producers, representing 36.3% of all producers, marks a significant shift in the industry’s gender composition and brings diverse perspectives and management approaches to farming operations. Additionally, 305,753 military veterans have transitioned into farming, accounting for 9.1% of all producers, bringing valuable leadership skills and discipline to agricultural enterprises. The financial metrics demonstrate both the productivity and challenges facing American farmers, with gross cash farm income forecast at $623.9 billion and net farm income at $179.8 billion for 2025, while production expenses reach $467.4 billion, highlighting the narrow profit margins many operations face.
Farm Count and Size in the US 2025
| Metric | 2022 Data | 2024 Data | 2025 Forecast |
|---|---|---|---|
| Total Number of Farms | 1.9 million | 1.88 million | 1.88 million |
| Average Farm Size (acres) | 463 acres | 464 acres | 466 acres |
| Total Land in Farms | 880 million acres | 876 million acres | 876 million acres |
| Small Farms (<$350,000 GCFI) | 85% of farms | 85% of farms | 85% of farms |
| Large-Scale Farms (≥$1 million GCFI) | Less than 4% | Approximately 4% | Approximately 4% |
| Farms with Sales ≥$1 Million | 105,384 (6%) | 108,000 (6%) | 110,000 (6%) |
| Farms Under 100 Acres | Over 50% | Over 50% | Over 50% |
| Farms Over 2,000 Acres | 83,308 | 85,000 | 86,000 |
| Percentage of Farmland in Large Operations | 61% | 61% | 62% |
Data Source: USDA NASS 2022 Census of Agriculture, 2024 Farms and Land in Farms Summary, 2025 USDA Forecasts
The structure of American agriculture reflects a tale of two farming worlds coexisting within the same industry. The total 1.9 million farms operating in 2022 demonstrates a 7% decline from 2017, continuing a decades-long trend of farm consolidation. The average farm size of 463 acres in 2022, increasing to 464 acres in 2024 and 466 acres in 2025, reveals how surviving operations are growing larger to achieve economies of scale necessary for profitability. This consolidation trend becomes even more apparent when examining farm size distribution, where small farms with less than $350,000 in gross cash farm income represent 85% of all operations but control only 39% of total farmland and produce just 14% of the value of agricultural products sold.
The concentration of production becomes strikingly clear at the opposite end of the spectrum. Large-scale family farms with $1 million or more in annual revenue constitute less than 4% of all farms but produce an astounding 51% of the total value of agricultural products. This means a relatively small number of highly efficient, well-capitalized operations drive the majority of American agricultural production. The 105,384 farms with sales of $1 million or more in 2022 operated 31% of all farmland while selling more than three-quarters of all agricultural products. Meanwhile, farms over 2,000 acres, numbering approximately 83,308, control 61% of all farmland, highlighting the dramatic concentration of land ownership. Despite these trends toward bigness, over 50% of farms remain under 100 acres, serving important roles in specialty crop production, direct marketing to consumers, and maintaining agricultural diversity, even though they contribute less than 10% of total agricultural output. This bifurcated structure creates policy challenges as the needs and concerns of small diversified farms differ significantly from those of large commodity operations.
Farmer Demographics in the US 2025
| Demographic Category | Statistics | Percentage |
|---|---|---|
| Total Producers | 3.4 million | 100% |
| Male Producers | 2.2 million | 63.7% |
| Female Producers | 1.2 million | 36.3% |
| Average Age of All Producers | 58.1 years | — |
| Producers Under 35 Years | 306,000 | 9% |
| Producers Age 35-64 | 1.25 million | 37% |
| Producers Age 65 and Older | 2.14 million | 63.2% |
| Beginning Farmers (≤10 years) | Over 1 million | 27% |
| Military Veterans | 305,753 | 9.1% |
| White Producers | 3.24 million | 95.4% |
| Hispanic/Latino Producers | 112,000 | 3.3% |
| Black/African American | 40,800 | 1.2% |
| American Indian/Alaska Native | 57,800 | 1.7% |
| Average Years on Current Farm | 23.4 years | — |
Data Source: USDA NASS 2022 Census of Agriculture, Farm Producers Report 2025
The demographic composition of American farmers reveals both challenges and opportunities for the future of agriculture. With 3.4 million total producers working across the nation’s farms, the industry employs a diverse workforce, though certain demographic trends warrant attention. Male producers continue to dominate at 63.7% of the total, but the 36.3% female representation marks a significant increase from previous decades and reflects growing recognition of women’s contributions to farm decision-making and management. The average producer age of 58.1 years continues climbing, representing a 0.6-year increase from 2017, and underscores the aging workforce challenge facing American agriculture.
The age distribution reveals a concerning gap in generational succession. Only 9% of producers are under age 35, while 63.2% are age 55 or older, creating what agricultural economists call an “aging out” crisis where experienced farmers approach retirement without sufficient younger producers to replace them. However, the presence of over 1 million beginning farmers with 10 years or less of experience provides hope for renewal. These beginning farmers represent 27% of all producers and tend to be younger, with an average age of 46.3 years, and bring fresh perspectives and willingness to adopt new technologies. The 305,753 military veterans in farming represent 9.1% of producers, notably higher than the 6.2% veteran rate in the general adult population, with these veterans bringing valuable leadership skills though they tend to be older, with 94% being male and their average age a full decade older than producers overall. Racial and ethnic diversity remains limited, with 95.4% of producers identifying as White, while Hispanic/Latino producers at 3.3%, Black/African American at 1.2%, and American Indian/Alaska Native at 1.7% represent opportunities for increased diversity and inclusion in agriculture. The average 23.4 years on the current farm demonstrates stability and experience in the agricultural workforce, though this also reflects the difficulty of new entrants breaking into farming due to high land costs and capital requirements.
Farm Financial Performance in the US 2025
| Financial Metric | 2024 Data | 2025 Forecast | Change (%) |
|---|---|---|---|
| Gross Cash Farm Income | $584.3 billion | $623.9 billion | +6.8% |
| Net Farm Income | $131.0 billion | $179.8 billion | +37.2% |
| Net Cash Farm Income | $144.4 billion | $180.9 billion | +25.3% |
| Total Cash Receipts | $511.2 billion | $535.2 billion | +4.7% |
| Crop Cash Receipts | $242.7 billion | $236.6 billion | -2.5% |
| Animal/Product Cash Receipts | $268.6 billion | $298.6 billion | +11.2% |
| Government Farm Payments | $10.1 billion | $40.5 billion | +301% |
| Production Expenses | $455.4 billion | $467.4 billion | +2.6% |
| Average Farm Income | $69,690 | $79,790 | +14.5% |
| Farms with Positive Net Income | 41% | 43% | +2% |
Data Source: USDA Economic Research Service Farm Sector Income Forecast 2025, 2022 Census of Agriculture
The financial outlook for American farmers in 2025 presents a complex and deeply concerning picture that requires government intervention on an unprecedented scale. Net farm income is forecast to surge 37.2% to $179.8 billion in 2025, representing a substantial recovery from $131.0 billion in 2024. However, this impressive gain heavily depends on massive government assistance rather than market-driven profitability. The $30.4 billion jump in government farm program payments, rising from $10.1 billion in 2024 to $40.5 billion in 2025, reflects multiple layers of emergency support including the $12 billion Farmer Bridge Assistance Program announced by President Trump on December 8, 2025. This emergency package, funded through tariff revenue, provides $11 billion for row crop producers and $1 billion for specialty crops, with payments to be distributed by February 28, 2026. Additionally, the Emergency Commodity Assistance Program (ECAP) distributed $9.3 billion to over 560,000 farmers for soybeans, corn, and other row crops, while the Supplemental Disaster Relief Program (SDRP) has delivered nearly $6 billion to over 388,000 producers recovering from 2023 and 2024 severe weather events. Without this unprecedented level of government support, the farm income picture would show deep losses, with the American Farm Bureau Federation estimating actual market-driven losses at $34 billion for 2025.
The crisis stems from a perfect storm of adverse conditions affecting American agriculture. Gross cash farm income of $623.9 billion in 2025 represents growth, but this masks the underlying market dysfunction. Total cash receipts are forecast at $535.2 billion, up 4.7% from 2024, yet farmers report they’re receiving historically low prices for most major crops while facing the same high prices as all American families for household bills and dramatically elevated operating costs. Crop cash receipts are forecast to decline $6.1 billion or 2.5% to $236.6 billion, as corn, soybeans, and wheat all face depressed prices following multiple years of abundant production and disrupted export markets. The trade war with China has proven particularly devastating for soybeans, with China halting purchases in May 2025 in retaliation for U.S. tariffs. While a preliminary trade agreement in October promised 12 million metric tons of soybean purchases in the final two months of 2025, actual purchases have fallen dramatically short at only 2.2 million metric tons through early December. Treasury Secretary Scott Bessent noted that domestic soybean prices have risen 15% since the October agreement, but this still leaves prices well below what farmers need for profitability after years of price declines. Animal and animal product receipts provide the bright spot, expected to increase $30.0 billion or 11.2% to $298.6 billion, driven by record-high cattle prices and strong poultry production. The expense side tells a challenging story, with total production expenses forecast at $467.4 billion in 2025, up 2.6% from 2024 and creating a severe profit squeeze. The result is an agricultural sector dependent on government support for survival, with average farm income of $79,790 and only 43% of farms reporting positive net cash farm income, while 59% of operators require off-farm income to sustain their operations and families.
Crop Production and Planted Acreage in the US 2025
| Crop Type | 2024 Planted Acres | 2025 Planted Acres | Change |
|---|---|---|---|
| Corn (All Purposes) | 90.6 million | 95.2 million | +5% |
| Soybeans | 86.8 million | 83.4 million | -4% |
| All Wheat | 46.3 million | 45.5 million | -1% |
| Winter Wheat | 33.4 million | 33.3 million | <1% |
| Spring Wheat | 10.6 million | 10.0 million | -5% |
| Durum Wheat | 2.07 million | 2.11 million | +2% |
| All Cotton | 11.3 million | 10.1 million | -10% |
| Upland Cotton | 11.1 million | 9.95 million | -9% |
| All Hay | 48.5 million | 48.2 million | <1% |
| Rice | 2.63 million | 2.65 million | <1% |
Data Source: USDA NASS Acreage Report June 2025, Prospective Plantings March 2025
American farmers made significant adjustments to their 2025 planting decisions in response to market signals, weather conditions, and input costs. Corn planted area surged 5% to 95.2 million acres, representing the third-highest planted acreage since 1944 and reflecting farmers’ confidence in corn’s profitability despite lower prices than recent peak years. The increase occurred across 41 of 48 estimating states, with major expansions of 400,000 acres or more in key states including Iowa, Minnesota, Nebraska, and South Dakota. Several states including Idaho, Nevada, North Dakota, Oregon, and South Dakota are expected to plant record-high corn acreage if forecasts are realized. This shift toward corn came largely at the expense of soybeans.
Soybean planted area declined 4% to 83.4 million acres in 2025, as farmers rotated out of soybeans in favor of more profitable crops. The reduction affected 25 of 29 estimating states, with decreases of 300,000 acres or more in major producing states including Illinois, Iowa, Minnesota, Nebraska, North Dakota, and South Dakota. However, record high soybean acreage is expected in New York and Ohio, showing regional variation in planting decisions. All wheat planted area dropped 1% to 45.5 million acres, representing the second-lowest all wheat planted area since records began in 1919, reflecting persistently low wheat prices and challenging growing conditions. Winter wheat at 33.3 million acres remained relatively stable, while spring wheat declined 5% to 10.0 million acres, though durum wheat increased 2% to 2.11 million acres. The cotton sector saw dramatic reductions, with all cotton planted area falling 10% to 10.1 million acres, as producers responded to lower prices and higher production costs. Upland cotton declined 9% to 9.95 million acres, while American Pima cotton dropped 17% to just 171,000 acres. Other crops like hay remained relatively stable at 48.2 million acres, while rice held steady at 2.65 million acres. These planting decisions reflect farmers’ continuous adaptation to market conditions, weather patterns, and profitability outlooks across different crop types.
Farm Production Expenses in the US 2025
| Expense Category | 2024 Estimate | 2025 Forecast | 5-Year Change |
|---|---|---|---|
| Total Production Expenses | $455.4 billion | $467.4 billion | +36% since 2020 |
| Feed Purchases | $73.2 billion | $68.6 billion | +8% since 2020 |
| Livestock/Poultry Purchases | $49.3 billion | $59.9 billion | +24% since 2020 |
| Labor Expenses | $52.6 billion | $54.8 billion | +50% since 2020 |
| Interest Expenses | $29.4 billion | $30.8 billion | +73% since 2020 |
| Fertilizer, Lime, Soil | $45.2 billion | $44.1 billion | +37% since 2020 |
| Seed Purchases | $22.8 billion | $23.4 billion | +18% since 2020 |
| Fuel and Oil | $23.6 billion | $22.9 billion | +32% since 2020 |
| Property Taxes/Fees | $18.7 billion | $19.4 billion | +16% since 2020 |
| Net Rent to Landlords | $15.8 billion | $16.2 billion | +12% since 2020 |
Data Source: USDA ERS Farm Sector Income Forecast 2025, Farm Production Expenditures Report
The cost structure facing American farmers in 2025 represents one of the most significant challenges to agricultural profitability. Total production expenses are forecast at $467.4 billion, an increase of $12.0 billion or 2.6% from 2024, and a staggering 36% increase since 2020. This sustained cost inflation has compressed profit margins across virtually all agricultural sectors, forcing farmers to operate with greater efficiency and scale to remain viable. While some expense categories have moderated from recent peaks, overall costs remain at historically elevated levels, creating financial stress for operations that cannot pass these costs along to consumers through higher prices.
Feed purchases, the largest single expense category at $68.6 billion, are forecast to decline 6.2% from 2024 as grain prices moderate from their recent highs, providing some relief to livestock and dairy operations. However, feed costs remain 8% higher than 2020 levels, reflecting the ongoing elevation in grain and oilseed markets. Livestock and poultry purchases present the opposite picture, surging 21.5% to $59.9 billion in 2025, as producers rebuild herds and flocks following several years of liquidation. This $10.6 billion increase represents the largest dollar change among all expense categories and reflects strong demand for breeding stock and replacement animals. Labor expenses continue their relentless climb, rising 4.2% to $54.8 billion in 2025 and up an astonishing 50% since 2020. The southeastern Adverse Effect Wage Rate, which includes major agricultural states, increased 9% to $16.08 per hour in 2025, placing particular pressure on labor-intensive specialty crop operations. Interest expenses at $30.8 billion represent a 73% increase since 2020, reflecting both higher interest rates and increased borrowing by farmers to cover operating expenses and capital investments. The Federal Reserve Bank of Kansas City reports the median operating loan interest rate hovering near 8% in 2025, compared to rates below 4% in early 2021. Fertilizer, lime, and soil conditioner expenses of $44.1 billion remain 37% above 2020 levels despite moderating slightly from pandemic-era peaks. Similarly, fuel and oil costs at $22.9 billion stay 32% higher than 2020, while seed purchases at $23.4 billion are up 18%. These persistently high input costs, combined with commodity prices well below their 2022 highs, create a profit squeeze that has left many farmers operating at losses for multiple consecutive years, supported only by government payments and off-farm income.
Agricultural Land Values in the US 2025
| Land Type | 2024 Value | 2025 Value | Annual Change |
|---|---|---|---|
| Average Farm Real Estate | $4,170/acre | $4,350/acre | +4.3% |
| Average Cropland Value | $5,570/acre | $5,830/acre | +4.7% |
| Average Pastureland Value | $1,870/acre | $1,920/acre | +2.7% |
| Cropland Cash Rent | $160/acre | $161/acre | +0.6% |
| Pastureland Cash Rent | $16/acre | $16/acre | 0% |
| California Farm Real Estate | $13,400/acre | $13,700/acre | +2.2% |
| Iowa Cropland | $9,800/acre | $10,300/acre | +5.1% |
| Total Farm Real Estate Value | $3.52 trillion | $3.67 trillion | +4.3% |
Data Source: USDA NASS Land Values Summary 2025, ERS Farmland Value Report
American farmland values continued their upward trajectory in 2025, marking the fifth consecutive year of increases and reaching record levels across multiple categories. Average farm real estate value rose $180 per acre to $4,350, representing a 4.3% increase or 1.9% after adjusting for inflation. This appreciation reflects a combination of factors including strong investor demand for farmland as an inflation hedge, limited supply of quality agricultural land, competition from renewable energy development, and the wealth effect from previous years’ commodity price booms. Over the 2019-2024 period, farmland values grew at a compound annualized rate of 5.8% nominally or 2.0% after inflation adjustment, demonstrating sustained upward pressure on land prices even as farm income fluctuated.
Cropland values maintained a significant premium over pastureland, averaging $5,830 per acre in 2025, up $260 per acre or 4.7% from 2024. This 2.2% increase in inflation-adjusted terms reflects cropland’s higher productive value and return potential. To put this in historical perspective, average cropland value stood at just $2,980 per acre in 2011, meaning values have nearly doubled in 14 years. Regional variations remain dramatic, with California’s cropland valued at $17,940 per acre (up 3.6%) reflecting the state’s specialty crop production and water scarcity, while Iowa cropland averaged $10,300 per acre (up 5.1%), driven by prime Corn Belt soil quality and productivity. Pastureland values increased 2.7% to $1,920 per acre nationally, with the difference between cropland and pastureland values varying significantly by region. In the Pacific region, cropland at $9,830 per acre commands more than 4 times the value of pastureland at $2,450 per acre, reflecting the intensive nature of irrigated specialty crop production. Cash rent rates, another measure of land value, showed minimal movement, with cropland rental rates increasing just 0.6% to a record $161 per acre while pastureland rent held flat at $16 per acre. This disconnect between rising land values and stagnant rents suggests that land price appreciation is being driven more by investment demand and non-agricultural factors than by the underlying agricultural earning potential of the land. The total value of farm real estate reached $3.67 trillion in 2025, representing 83.6% of total U.S. farm assets, and providing collateral that enables farmers to access credit, though high land values also create significant barriers for beginning farmers seeking to enter agriculture.
Organic Farming in the US 2025
| Organic Metric | 2017 Data | 2022 Data | Change |
|---|---|---|---|
| Certified Organic Operations | 17,962 farms | 17,048 farms | -5.1% |
| Organic Product Sales | $7.3 billion | $9.6 billion | +32% |
| Certified Organic Cropland | 3.0 million acres | 3.6 million acres | +20% |
| Organic Pasture/Rangeland | 1.7 million acres | 1.3 million acres | -24% |
| Average Organic Producer Age | 54.2 years | 52.7 years | -1.5 years |
| Organic Producers Under 35 | 13% | 15% | +2% |
| Organic as Primary Occupation | 58% | 61% | +3% |
| Top State (California) Sales | $2.8 billion | $3.7 billion | +32% |
| Acres Transitioning to Organic | 283,000 acres | 161,000 acres | -43% |
Data Source: USDA NASS 2022 Census of Agriculture Organic Highlights, ERS Organic Situation Report 2025 Edition
The organic agriculture sector in the United States presents a paradoxical situation in 2025, with sales surging 32% to $9.6 billion while the number of certified organic operations declined 5.1% to 17,048 farms. This divergence reflects the consolidation trend also visible in conventional agriculture, where fewer but larger operations are capturing growing consumer demand for organic products. California maintained its dominance with $3.7 billion in organic sales, representing 39% of the U.S. total and up 32% from 2017. The Golden State’s leadership reflects its specialty crop focus, with Monterey County alone accounting for 8% of national organic sales at $740 million. Other leading states include Washington, Pennsylvania, Texas, and Oregon, with the Northeast region showing particularly strong growth, contributing to the overall 32% increase in organic sales despite fewer certified operations.
The demographic profile of organic farmers differs notably from conventional agriculture in several positive ways. Organic producers averaged 52.7 years of age in 2022, significantly younger than the overall agricultural average of 58.1 years, suggesting organic farming attracts a younger cohort. Additionally, 15% of organic producers are under age 35, compared to just 9% of all farmers, indicating organic agriculture may be drawing younger entrants into farming. 61% of organic producers report farming as their primary occupation, versus 42% of all U.S. producers, showing higher commitment levels to agricultural careers among organic operators. The 3.6 million acres of certified organic cropland in 2022 represented a 20% increase from 2017, though this still constitutes less than 1% of all U.S. cropland. Conversely, organic pasture and rangeland declined 24% to 1.3 million acres, reflecting economic challenges in organic livestock production. A concerning trend is the 43% decrease in acres transitioning to organic, falling from 283,000 acres in 2017 to 161,000 acres in 2022. This suggests the pipeline of new organic production may be slowing, potentially due to the three-year transition period required during which farmers must meet organic standards but cannot yet command organic price premiums. The USDA’s $300 million Organic Transition Initiative announced in June 2025 aims to address these barriers by supporting farmers through the transition process. Looking forward, organic retail sales continue expanding, reaching approximately $68 billion in 2024 according to industry estimates, with conventional grocery stores and mass retailers now accounting for 56% of organic food sales, demonstrating mainstream consumer acceptance. The challenge for 2025 and beyond will be expanding organic production quickly enough to meet this growing demand while maintaining the integrity of organic standards and supporting both existing and transitioning farmers.
Women and Beginning Farmers in the US 2025
| Category | Number | Percentage | Key Characteristics |
|---|---|---|---|
| Total Female Producers | 1.2 million | 36.3% of all producers | Managing 407 million acres |
| Female-Operated Farms | 369,000 | 58% of all farms | One or more female decision-makers |
| Female Agricultural Sales | $222 billion | 41% of total sales | Significant economic contribution |
| Female Producers Under 35 | 126,000 | 10.5% of females | Younger than male counterparts |
| Beginning Farmers Total | 1+ million | 27% of producers | ≤10 years experience |
| Beginning Farmer Average Age | 46.3 years | — | 12 years younger than average |
| Female Beginning Farmers | 380,000 | 38% of beginners | Higher than overall female share |
| Organic Female Producers | 15% under 35 | — | More likely young and engaged |
| Farms with Female Producers | 1.1 million | 58% | Collaborative decision-making |
Data Source: USDA NASS 2022 Census of Agriculture, Farm Producers Report 2024, Women Farmers Data
The role of women in American agriculture has expanded dramatically in recent decades, reaching a milestone where 1.2 million female producers now represent 36.3% of all U.S. agricultural producers. These women collectively manage 407 million acres and generate $222 billion in agricultural sales, demonstrating their substantial economic impact on the industry. What makes these numbers particularly significant is the definition change implemented in the 2017 Census of Agriculture, which expanded producer classification to include all individuals actively involved in farm decision-making rather than just primary operators. This change revealed the true extent of women’s involvement in agriculture, with 58% of all farms having at least one female producer making decisions about operations, marketing, and management.
Female producers bring different demographic characteristics and approaches to farming compared to their male counterparts. Women farmers are more likely to be younger, with 10.5% under age 35 compared to just 8.5% of male producers. They are more commonly found in beginning farmer categories, accounting for 38% of beginning farmers despite being 36.3% of all producers, suggesting women represent a disproportionate share of new agricultural entrants. Female farmers show particular strength in certain agricultural sectors, with the highest representation in livestock operations involving smaller animals (47%), specialty crops, greenhouse and nursery production (43%), and agritourism (41%). They also operate smaller acreage operations on average, with 56% of farms operated by women having sales under $10,000 annually, compared to 47% for all farms, suggesting many women engage in part-time farming, diversified operations, or direct-to-consumer marketing strategies. However, when women operate larger commercial operations, their performance matches or exceeds industry averages. Beginning farmers, defined as those with 10 years or less of farming experience, bring fresh perspectives and new energy to American agriculture. These over 1 million beginning farmers account for 27% of all producers, and their average age of 46.3 years sits 12 years below the national producer average, representing a critical injection of younger talent. Beginning farmers demonstrate higher rates of college education, with many bringing business management skills and technological literacy from previous careers. They show strong interest in sustainable and organic practices, with 27% of certified organic operations run by beginning farmers, well above their proportion of all farms. The USDA’s programs targeting beginning farmers, including those in the Farm Service Agency and the Beginning Farmer and Rancher Development Program, have provided crucial support, offering reduced interest rates on loans, extended repayment terms, and technical assistance. These new farmers face significant challenges including limited access to land, high startup costs, difficulty accessing credit, and the need to develop farming skills and market connections, but their entry into agriculture provides hope for generational renewal in an aging industry.
Livestock Production in the US 2025
| Livestock Category | 2022 Inventory | 2024-2025 Data | Market Trend |
|---|---|---|---|
| Cattle and Calves | 89.3 million head | 87.2 million head | Rebuilding from decline |
| Beef Cows | 30.4 million head | 28.2 million head | Lowest since 1962 |
| Milk Cows | 9.4 million head | 9.3 million head | Stable production |
| Hogs and Pigs | 72.2 million head | 74.3 million head | Record high inventory |
| Broiler Production | 9.2 billion birds | 9.4 billion birds | Continued growth |
| Layer Inventory | 377 million | 389 million | Expansion continuing |
| Sheep and Lambs | 5.17 million head | 5.00 million head | Long-term decline |
| Goats | 2.67 million head | 2.75 million head | Growing interest |
| Average Cattle Price | $1,500–$1,600/cwt | $1,850–$1,900/cwt | Near record highs |
Data Source: USDA NASS Livestock Reports 2024-2025, Cattle Inventory Report, Quarterly Hogs and Pigs Report
The U.S. livestock sector in 2025 presents a story of tight cattle supplies driving record prices while pork and poultry production expands to meet consumer demand. The cattle inventory of 87.2 million head as of January 1, 2025 represents a 2.3% decline from 2024 and marks the ninth consecutive year of inventory decline, bringing the national herd to its smallest size since 1951. The beef cow inventory hit 28.2 million head, the lowest level since 1962, reflecting sustained liquidation driven by drought, high feed costs, and challenging economic conditions. However, early 2025 indicators suggest the herd liquidation phase may be ending, with beef replacement heifer retention up 3% at 5.77 million head, signaling producers’ intention to begin rebuilding. Cattle prices responded predictably to these tight supplies, with fed cattle averaging $185-$190 per hundredweight in early 2025, near all-time record highs and up approximately 25% from 2023 levels.
The pork sector tells a dramatically different story, with the March 1, 2025 hogs and pigs inventory reaching 74.3 million head, marking an all-time record high and representing a 3% increase from 2024. The breeding herd of 6.25 million head remained stable, while the market hog inventory surged to 68.0 million head. The 2025 pig crop is forecast at 135 million head, up 2% from 2024, ensuring abundant pork supplies throughout the year. This expansion occurred despite relatively modest hog prices, with producers benefiting from lower feed costs in 2024-2025 as corn and soybean meal prices retreated from their 2022 peaks. Poultry production continued its steady expansion, with broiler production forecast at 9.4 billion birds in 2025, up 2% from 2024, and layer inventory reaching 389 million birds, also up 2%. The poultry sector recovered fully from the 2022-2023 highly pathogenic avian influenza outbreak that necessitated the depopulation of more than 58 million birds. Egg production surged to meet demand, with prices moderating from the highs seen during the outbreak but remaining elevated compared to pre-2022 levels. Milk production remained stable with the 9.3 million cow dairy herd producing at record efficiency levels, while sheep and lamb operations continued their long-term decline to 5.0 million head. The goat inventory edged higher to 2.75 million head, driven by growing demand for goat meat from diverse ethnic communities and increased interest in goat cheese and specialty products. Looking forward, livestock producers face varying outlooks, with cattle producers enjoying strong profitability as they rebuild herds, pork producers managing large supplies and moderate prices, and poultry operations continuing steady expansion to meet protein demand from American consumers and export markets.
Agricultural Exports and Trade in the US 2025
| Trade Metric | 2024 Data | 2025 Forecast | Change |
|---|---|---|---|
| Total Agricultural Exports | $169.5 billion | $178.5 billion | +5.3% |
| Soybeans and Products | $25.9 billion | $27.5 billion | +6.2% |
| Corn and Products | $13.8 billion | $15.2 billion | +10.1% |
| Beef and Products | $10.3 billion | $11.8 billion | +14.6% |
| Pork and Products | $7.7 billion | $8.2 billion | +6.5% |
| Poultry and Products | $5.9 billion | $6.4 billion | +8.5% |
| Wheat and Products | $5.5 billion | $5.8 billion | +5.5% |
| Cotton and Products | $5.1 billion | $4.8 billion | -5.9% |
| Total Agricultural Imports | $197 billion | $204 billion | +3.6% |
| Agricultural Trade Balance | -$27.5 billion | -$25.5 billion | Deficit narrowing |
Data Source: USDA Foreign Agricultural Service Agricultural Export and Import Data 2025, Economic Research Service Trade Outlook Report
American agricultural exports are forecast to strengthen in 2025, reaching $178.5 billion, an increase of $9.0 billion or 5.3% from 2024. This growth comes after several challenging years where exports faced headwinds from a strong U.S. dollar, competitive pressures from South American producers, and uncertain global economic conditions. The 2025 improvement reflects a combination of factors including moderating U.S. dollar strength, robust global demand for protein products, and competitive pricing for U.S. commodities following the large 2024 and 2025 harvests. However, the agricultural trade balance remains in deficit, with imports forecast at $204 billion exceeding exports by $25.5 billion, though this $2 billion improvement from 2024’s $27.5 billion deficit represents a positive trend.
Livestock and poultry products lead the export growth story in 2025, with beef exports forecast at $11.8 billion, up a robust 14.6% as limited global beef supplies and strong demand from Asian markets, particularly Japan and South Korea, drive record prices and shipment volumes. Pork exports at $8.2 billion rise 6.5%, supported by strong demand from Mexico, Japan, and China, even as domestic production reaches record levels. Poultry exports grow 8.5% to $6.4 billion, with emerging markets in Africa and the Middle East supplementing traditional destinations. On the crop side, soybean and product exports increase 6.2% to $27.5 billion, benefiting from China’s return as a major buyer following several years of uncertainty and growing global demand for vegetable oils and soybean meal for livestock feed. Corn exports surge 10.1% to $15.2 billion, as competitive pricing from the large 2024 U.S. crop attracts buyers, particularly Mexico, Japan, and China. Wheat exports edge 5.5% higher to $5.8 billion despite intense competition from Black Sea region exporters, with the U.S. focusing on higher-quality hard red winter and hard red spring wheat commanding premium prices. Cotton exports decline 5.9% to $4.8 billion, facing pressure from reduced global textile demand and competition from India and Brazil. The top five export markets for U.S. agricultural products in 2025 are China ($38 billion), Mexico ($27 billion), Canada ($25 billion), Japan ($12 billion), and the European Union ($11 billion), accounting for approximately 63% of total exports. Trade policy remains crucial, with the U.S. farm sector heavily dependent on market access secured through trade agreements and diplomatic relationships, making agricultural exports vulnerable to geopolitical tensions and trade disputes that could disrupt these critical flows.
Government Support and Trade War Impact in the US 2025
| Support Program | Amount | Recipients | Purpose |
|---|---|---|---|
| Farmer Bridge Assistance | $12 billion | Row crop & specialty | Trade war relief |
| Row Crop Payments (FBA) | $11 billion | 20+ crop types | Market disruption aid |
| Specialty Crop Reserve | $1 billion | Sugar, fruits, vegetables | Additional assistance |
| Emergency Commodity Assistance | $9.3 billion | 560,000+ farmers | 2024 hardship recovery |
| Marketing Assistance Specialty | $1.8 billion | 52,000+ producers | Rising input costs |
| Supplemental Disaster Relief | $6 billion+ | 388,000+ farmers | Weather event losses |
| Total Government Payments 2025 | $40.5 billion | All farm sectors | Various programs |
| China Soybean Commitment | 12 million MT | Oct–Dec 2025 | Trade agreement |
| China Actual Purchases | 2.2 million MT | Oct–Dec 2025 | Actual imports |
| Estimated Total Farmer Losses | $34 billion | All sectors | AFBF calculation |
Data Source: USDA Office of the Secretary December 2025, American Farm Bureau Federation, USDA Foreign Agricultural Service Trade Data
The 2025 agricultural year will be remembered as one requiring the most extensive government intervention in American farming history outside of the Depression era, with over $30 billion in ad hoc assistance delivered since January alone. The centerpiece of this support came on December 8, 2025, when President Trump announced the $12 billion Farmer Bridge Assistance Program during a White House roundtable attended by Treasury Secretary Scott Bessent, Agriculture Secretary Brooke Rollins, and affected farmers. Trump emphasized the funding would come from tariff revenue, stating that “this money would not be possible without tariffs” and claiming the relief would “provide much-needed certainty to farmers as they get this year’s harvest to market”. The Farmer Bridge Assistance allocates $11 billion for major row crop producers growing barley, chickpeas, corn, cotton, lentils, oats, peanuts, peas, rice, sorghum, soybeans, wheat, canola, crambe, flax, mustard, rapeseed, safflower, sesame, and sunflowers, with farmers able to apply through their local Farm Service Agency offices and payments guaranteed by February 28, 2026. The remaining $1 billion is reserved for commodities not covered under the primary program, particularly specialty crops, with distribution timelines still under development.
The necessity for such massive intervention stems directly from the trade war with China and its cascading effects on American agriculture. China halted U.S. soybean purchases in May 2025 in retaliation for Trump administration tariffs, devastating an export market where China typically accounted for more than half of all American soybean exports worth billions annually. The Iowa Farm Bureau notes that over the previous five years, China purchased more than 50% of U.S. soybean exports, making the sudden halt catastrophic for Midwest farmers. After months of negotiations, Trump and Chinese President Xi Jinping struck a preliminary trade agreement in October that promised the resumption of soybean sales, with China committing to purchase at least 12 million metric tons in the final two months of 2025 and 25 million metric tons annually in 2026, 2027, and 2028. As per report in November, actual Chinese imports have fallen dramatically short, with only 2.2 million metric tons purchased through early December, raising serious questions about China’s commitment to the agreement. This shortfall compounds losses for farmers who planned planting based on promised market access.
Treasury Secretary Bessent claimed on Face the Nation that domestic soybean prices have risen as much as 15% since the agreement with the Chinese, but this increase comes after years of price declines and doesn’t compensate for lost volume or rising input costs driven by tariffs on fertilizer, equipment, and other necessities. The trade war dealt what farmers describe as a “double whammy” – simultaneously reducing export demand for their crops while increasing costs for the inputs they need to produce those crops. Farmers told 60 Minutes they are suffering major losses on corn, soybeans, and cotton, with prices for these crops falling over the last two years according to American Farm Bureau Federation data, while facing the same high prices as all of America’s families for household expenses plus dramatically elevated costs for loans, equipment, and supplies. The American Farm Bureau Federation’s President Zippy Duvall estimates total farmer losses will reach $34 billion amid these broader economic headwinds. Beyond the $12 billion Bridge Assistance, farmers have received support through multiple other programs in 2025, including the Emergency Commodity Assistance Program distributing $9.3 billion to over 560,000 farmers for soybeans, corn, sorghum, and other row crops affected by 2024 economic hardships, the Marketing Assistance for Specialty Crops program providing $1.8 billion to over 52,000 producers recovering from rising input costs stemming from previous administration policies, and the Supplemental Disaster Relief Program distributing nearly $6 billion to over 388,000 farmers with up to an additional $9 billion to be distributed over the coming months for severe weather losses in 2023 and 2024.
While this unprecedented support has prevented widespread farm failures, many farmers and economists view it as what Fortune magazine termed “a Band-Aid on a bigger wound” that doesn’t address systemic issues. Rep. Glenn “GT” Thompson, Chairman of the House Committee on Agriculture, commended the aid as “critical assistance” that will “help farmers obtain financing for 2026” and serve as “a bridge to the long-term improvements to the farm safety net” included in what he called the “One Big Beautiful Bill”. However, farmers themselves express preference for stable markets over government checks. Mark Read, District 5 Director for the Illinois Soybean Association, stated bluntly: “Farmers don’t want free aid. We want free trade.” Agricultural economists note the assistance arrived late in the harvest season, with farmers already booking orders at lower prices, nearly guaranteeing losses for the year, and the package doesn’t address input costs, which remain critically important for 2026 planting decisions farmers are making now. As one Missouri farmer and agriculture watchdog noted, many issues plaguing U.S. agriculture “go beyond the trade disputes” created by current policies, suggesting structural challenges require more than emergency payments to resolve.
Farm Debt and Financial Stress in the US 2025
| Debt Category | 2024 Data | 2025 Forecast | Change (%) |
|---|---|---|---|
| Total Farm Debt | $522 billion | $542 billion | +3.8% |
| Real Estate Debt | $357 billion | $369 billion | +3.4% |
| Non-Real Estate Debt | $165 billion | $173 billion | +4.8% |
| Debt-to-Asset Ratio | 14.7% | 14.8% | +0.1% |
| Debt-to-Income Ratio | 398% | 301% | -24% |
| Farm Loan Delinquencies | 2.3% of loans | 2.5% of loans | +0.2% |
| Farm Bankruptcies | 522 filings | 545 filings | +4.4% |
| Working Capital | -$30 billion | -$28 billion | Slight improvement |
| Interest Expenses | $29.4 billion | $30.8 billion | +4.8% |
Data Source: USDA ERS Farm Balance Sheet and Financial Ratios 2025, Farm Credit Administration Reports, Federal Reserve Agricultural Finance Data
Farm debt levels continue climbing in 2025, with total debt forecast to reach $542 billion, representing a 3.8% increase from 2024 and an 80% increase from 2015 levels. This sustained borrowing growth reflects farmers’ need to finance operating expenses amid high input costs, purchase additional land to achieve economies of scale, and invest in increasingly expensive machinery and technology. Real estate debt of $369 billion accounts for 68% of total farm debt, growing 3.4% as farmers continue acquiring land at elevated prices and refinancing existing loans at higher interest rates. Non-real estate debt at $173 billion increased 4.8%, encompassing operating loans, equipment financing, and livestock purchases, with the faster growth rate reflecting the squeeze on farm operating cash flow.
Despite rising absolute debt levels, several financial indicators provide a mixed picture of farm sector financial health. The debt-to-asset ratio held relatively steady at 14.8%, remaining near historically low levels thanks to strong farmland appreciation that has boosted asset values even faster than debt has grown. The total value of U.S. farm assets stands at $3.67 trillion in 2025, providing a substantial equity cushion for the sector overall. However, the debt-to-income ratio shows concerning volatility, falling to 301% in 2025 from 398% in 2024 thanks to the surge in net farm income, but this improvement heavily depends on temporary government payment increases that may not continue. When government payments normalize, this ratio could spike again, indicating underlying financial vulnerability. Farm loan delinquency rates edged up to 2.5% of loans in 2025, still below historical averages but showing a gradual deterioration from the 1.8% rates seen in 2020-2021. Farm bankruptcies rose 4.4% to 545 Chapter 12 filings in 2024 (the most recent complete data), with analysts expecting a further 5-8% increase in 2025 as financial pressures mount. These bankruptcy levels remain well below the peaks seen in the 1980s farm crisis but represent a concerning upward trend. Working capital, calculated as current assets minus current liabilities, stood at negative $28 billion in 2025, an improvement from negative $30 billion in 2024 but still indicating liquidity stress across the sector. Interest expense at $30.8 billion increased 4.8%, consuming a larger share of gross farm income as interest rates remain elevated, with the prime rate plus spreads keeping farm operating loan rates near 7-8% for most borrowers.
Regional variation in financial stress is substantial, with grain farmers in the Midwest experiencing the greatest pressure due to three consecutive years of commodity prices below the cost of production, while livestock producers, particularly cattle operations, enjoy strong profitability that has improved their financial positions. Agricultural lenders report increasing requests for loan restructuring and operating line extensions, suggesting many farmers are working with lenders to manage through difficult conditions rather than immediately defaulting. The combination of high debt, elevated interest rates, volatile commodity prices, and uncertain government support creates financial vulnerability, though the sector’s strong asset base and relatively low debt-to-asset ratio provide important buffers against a systemic financial crisis similar to the 1980s experience.
Technology Adoption in the US 2025
| Technology | Adoption Rate | Primary Benefits | Trend |
|---|---|---|---|
| GPS Guidance Systems | 72% of farms | Reduced input costs, efficiency | Widespread |
| Yield Mapping/Monitoring | 55% of farms | Data-driven decisions | Growing rapidly |
| Variable Rate Technology | 48% of farms | Optimized input application | Increasing |
| Auto-Steer/Section Control | 67% of farms | Reduced overlap, labor | Mature technology |
| Precision Planting Systems | 42% of farms | Population optimization | Expanding |
| Drones for Scouting | 28% of farms | Crop monitoring, efficiency | Emerging |
| Soil Mapping/Testing | 64% of farms | Fertility management | Well-established |
| Weather Data Services | 81% of farms | Risk management | Nearly universal |
| Farm Management Software | 58% of farms | Record keeping, analysis | Growing |
| Telematics on Equipment | 52% of farms | Maintenance, efficiency | Rapidly expanding |
Data Source: USDA Economic Research Service Agricultural Resource Management Survey Data 2024, Precision Agriculture Survey Results, Farm Technology Adoption Studies 2025
American farmers have embraced technology at accelerating rates, transforming agriculture into an increasingly data-driven, precision-oriented industry. GPS guidance systems achieved 72% adoption rates on U.S. farms by 2024, making this technology nearly ubiquitous on commercial operations, with the highest adoption rates on grain and oilseed farms over 1,000 acres where 91% of operators use GPS guidance. These systems deliver measurable benefits, reducing input costs by 5-15% through minimized overlap, decreasing operator fatigue on long workdays, and enabling farming in challenging conditions like nighttime operations or poor visibility. The technology has matured to where entry-level systems cost under $5,000, bringing it within reach of even smaller operations, though RTK correction signals for centimeter-level accuracy require ongoing subscription costs of $1,000-$3,000 annually.
Precision agriculture technologies show varied adoption based on complexity and cost-benefit ratios. Yield mapping and monitoring at 55% adoption enables farmers to understand field variability and make site-specific management decisions, with adoption concentrated among row crop producers who can capture clear yield data during harvest. Variable rate technology (VRT) at 48% adoption allows farmers to adjust seeding rates, fertilizer application, and pesticide use based on field zones, potentially reducing input costs 8-12% while maintaining or improving yields. However, VRT requires significant upfront investment in equipment controllers ($10,000-$30,000), prescription map development ($5-$15 per acre), and agronomic expertise to interpret data and create appropriate prescriptions. Precision planting systems at 42% adoption help optimize seed population and placement, critical for maximizing yield potential of expensive seed genetics. Drone technology at 28% adoption represents a rapidly emerging tool, with farmers using drones for crop scouting, identifying pest and disease pressure, assessing crop stress, and variable rate application mapping. Commercial drone services costing $5-$15 per acre make this technology accessible without capital investment, though FAA regulations and operator certification requirements create barriers. Farm management software at 58% adoption has become essential for record keeping, regulatory compliance, financial analysis, and market management, with platforms ranging from free mobile apps to comprehensive enterprise systems costing $5,000-$20,000 annually.
Telematics on farm equipment at 52% adoption allows remote monitoring of machine performance, preventive maintenance alerts, fuel efficiency tracking, and automated documentation, with manufacturers like John Deere, Case IH, and AGCO building connectivity into new equipment as standard features. The technology adoption divide correlates strongly with farm size and revenue, with operations over $1 million in annual sales showing 85-95% adoption of most precision technologies, while farms under $100,000 in sales average only 15-25% adoption. This digital divide raises concerns about competitiveness, as farms without technology access fall further behind in efficiency and profitability. Looking forward, artificial intelligence and machine learning applications represent the next frontier, with early adopters using AI-powered decision support systems for optimal planting dates, harvest timing, pest management, and marketing decisions. However, the high costs of agricultural technology, including the $600 million impact tariffs are expected to have on companies like John Deere in 2025, raise concerns about affordability and accessibility for farmers already facing severe financial stress. President Trump’s December announcement that his administration would “take off a lot of the environmental restrictions” on farm machinery represents an attempt to address equipment costs, though manufacturers note tariffs on imported components remain a primary cost driver affecting final prices farmers pay for tractors and other essential equipment.
Disclaimer: This research report is compiled from publicly available sources. While reasonable efforts have been made to ensure accuracy, no representation or warranty, express or implied, is given as to the completeness or reliability of the information. We accept no liability for any errors, omissions, losses, or damages of any kind arising from the use of this report.