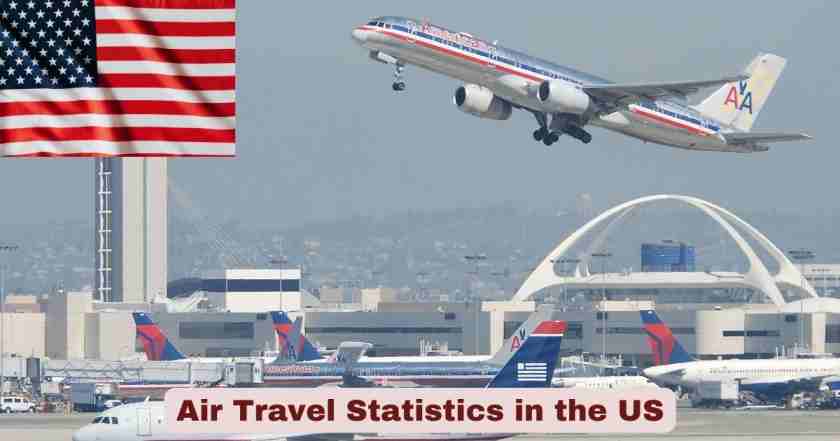
Air Travel in the US 2025
The United States continues to dominate as the world’s largest aviation market, with air travel reaching unprecedented levels in 2024 and 2025. The US aviation industry has demonstrated remarkable resilience and growth following the pandemic recovery, with passenger numbers surpassing pre-pandemic levels. The Transportation Security Administration (TSA) screened record-breaking numbers of travelers throughout 2025, while airports across the nation handled 876 million passengers in 2024 according to the International Air Transport Association (IATA). This growth reflects strong consumer demand, improved airline operations, and the critical role aviation plays in connecting America’s economy and communities.
The aviation sector serves as a vital economic engine, supporting millions of jobs and facilitating business operations across the country. Major airports like Hartsfield-Jackson Atlanta International Airport have maintained their positions as global leaders in passenger traffic, while airlines have posted strong financial results with the industry generating $6.7 billion in net profit for 2024. From domestic routes connecting cities across the continental United States to international flights linking America with destinations worldwide, the air travel industry continues to expand its capacity and enhance passenger experiences through technological innovations and operational improvements.
Interesting Facts and Latest Statistics on Air Travel in the US 2025
| Key Metric | 2024 Data | 2025 Data (Latest) | Source |
|---|---|---|---|
| Total US Passengers (Domestic + International) | 876 million passengers | Projected 920+ million | IATA, BTS |
| TSA Screenings – Single Day Record | 2,971,217 (Aug 29, 2025) | 3.1 million (June 22, 2025) | TSA |
| TSA Holiday Period Projection | – | 44.3 million (Dec 19, 2025 – Jan 4, 2026) | TSA |
| Annual TSA Screenings | Approximately 900 million | On pace for record | TSA |
| Busiest US Airport | Hartsfield-Jackson Atlanta (ATL) – 108.1 million | Projected 110+ million | ACI, Airport Data |
| US Airline Industry Net Profit | $6.7 billion | Q2 2025: $4.0 billion | BTS |
| Domestic Passengers (Monthly) | 72.1 million (December 2024) | 74.2 million (October 2025) | BTS |
| International Passengers (Monthly) | 11.2 million (December 2024) | 9.9 million (October 2025) | BTS |
| On-Time Arrival Rate | 78.10% (Full Year 2024) | Varies by month (75-86%) | DOT ATCR |
| Flight Cancellation Rate | 1.4% (Full Year 2024) | 0.7% (December 2024) | DOT ATCR |
| Total Annual Flights | 796,224 at ATL alone | Projected increase | Airport Statistics |
| Commercial Aircraft Fleet | 7,387 aircraft | Projected 7,500+ | FAA Forecasts |
Data Sources: Transportation Security Administration (TSA), Bureau of Transportation Statistics (BTS), Department of Transportation (DOT) Air Travel Consumer Report, Federal Aviation Administration (FAA), Airports Council International (ACI), International Air Transport Association (IATA)
The 2024 and 2025 data reveals that air travel in the United States has not only recovered from pandemic-era disruptions but has achieved new records across multiple metrics. The TSA’s screening of nearly 3.1 million passengers on June 22, 2025, marked the busiest single day in the agency’s history, demonstrating the extraordinary demand for air travel. Throughout 2025, eight of the top 10 busiest travel days occurred after May, with the agency consistently screening over 2.4 million passengers daily. The holiday travel period between December 19, 2025, and January 4, 2026, is projected to see 44.3 million travelers, representing a significant increase over the previous year.
Hartsfield-Jackson Atlanta International Airport maintained its position as the world’s busiest airport for the 26th time in 27 years, processing 108.1 million passengers in 2024. This figure represents a 3.3% increase from 2023 and positions Atlanta as a global aviation hub that handles more passengers than any other airport worldwide. The US airline industry’s financial performance showed resilience with a net profit of $6.7 billion in 2024, despite facing challenges from increased labor costs and operational pressures. Domestic passenger traffic reached 72.1 million in December 2024, setting a new December record, while on-time performance averaged 78.10% for the full year, slightly below the 2023 rate of 78.34% but demonstrating generally reliable operations.
Passenger Traffic in the US 2025
| Month | Systemwide Passengers (millions) | Domestic Passengers (millions) | International Passengers (millions) | Year-over-Year Change |
|---|---|---|---|---|
| December 2024 | 83.3 | 72.1 | 11.2 | +5.9% |
| January 2025 | 70.7 | 60.4 | 10.4 | +1.0% |
| July 2025 | 92.2 | 78.9 | 13.3 | +0.4% |
| August 2025 | 86.8 | 74.5 | 12.3 | -0.1% |
| September 2025 | 76.8 | 67.4 | 9.4 | -0.9% |
| October 2025 | 84.1 | 74.2 | 9.9 | +1.6% |
Source: Bureau of Transportation Statistics (BTS) – Monthly Air Traffic Reports
US airlines carried 83.3 million passengers in December 2024, marking an all-time high for December and representing a 5.9% increase compared to December 2023. This remarkable achievement demonstrated the strength of holiday travel demand and the aviation industry’s capacity to handle peak periods efficiently. The domestic segment accounted for 72.1 million passengers, setting a new December record, while international travel contributed 11.2 million passengers. When adjusted for seasonality, December enplanements reached an unprecedented high, surpassing all previous months in aviation history.
The monthly passenger trends throughout 2025 reveal seasonal patterns with summer months experiencing the highest volumes. July 2025 recorded 92.2 million total passengers, the highest single-month figure, with 78.9 million domestic travelers and 13.3 million international passengers. This represented a 0.4% increase year-over-year and established July as the peak travel month. October 2025 saw 84.1 million passengers, up 1.6% from the same month in 2024, with domestic travel reaching 74.2 million and international passengers totaling 9.9 million. The fall months typically see slightly lower volumes than summer, but 2025 data shows sustained strong demand across all periods, with year-over-year comparisons remaining positive or near-flat for most months.
TSA Checkpoint Screening Statistics in the US 2025
| Period/Event | Total Screenings | Daily Average | Peak Single Day | Comparison to 2024 |
|---|---|---|---|---|
| Labor Day Weekend 2025 | 10.4 million (4-day period) | 2.6 million | 2,971,217 (Aug 29) | +3.3% |
| Fourth of July 2025 | 18.5 million (7-day period) | 2.64 million | 2.9 million (July 6) | Increase over 2024 |
| Thanksgiving 2025 | 3+ million projected | – | Sunday after: 3+ million | Record levels |
| Holiday Season 2025-2026 | 44.3 million | 2.62 million | 2.86 million (Dec 28) | Higher than 2024 |
| Daily Average 2025 | – | 2.48 million | – | vs 2.47M in 2024 |
| Busiest Day Ever (June 22, 2025) | 3.1 million | – | 3,099,000 | All-time record |
| Chicago O’Hare Record (June 22, 2025) | 114,000 | – | 114,000 | Airport record |
Source: Transportation Security Administration (TSA) Press Releases and Checkpoint Data
The Transportation Security Administration set multiple records throughout 2025, with the agency on pace to break all-time annual passenger volume records. On Friday, August 29, 2025, TSA screened 2,971,217 passengers, marking the highest volume ever for the Friday before Labor Day and the 15th busiest single day in the agency’s nearly 24-year history. The Labor Day weekend period from Friday through Monday saw 10.4 million travelers screened, representing approximately a 3.3% jump over the same four-day period in 2024. Of the top 10 busiest travel days in TSA’s history, eight have been reported since May 2025, demonstrating unprecedented demand for air travel.
The most remarkable screening achievement occurred on Sunday, June 22, 2025, when TSA broke its all-time record by screening nearly 3.1 million individuals nationwide. This historic day also saw Chicago O’Hare International Airport process just under 114,000 passengers, setting a new single-day record for that major hub. The Fourth of July holiday period spanning July 1-7, 2025, saw TSA screen more than 18.5 million travelers, with the highest passenger volume of approximately 2.9 million expected on Sunday, July 6. For the holiday travel season between December 19, 2025, and January 4, 2026, TSA projected screening 44.3 million travelers, with the busiest day anticipated to be Sunday, December 28, when up to 2.86 million passengers would pass through checkpoints. The daily screening average for 2025 reached 2.48 million passengers, compared to 2.47 million in 2024, reflecting sustained growth in air travel demand.
Busiest Airports in the US 2025
| Rank | Airport | Code | 2024 Passengers | Change from 2023 | Primary Hub Airlines |
|---|---|---|---|---|---|
| 1 | Hartsfield-Jackson Atlanta | ATL | 108.1 million | +3.3% | Delta Air Lines |
| 2 | Dallas/Fort Worth | DFW | 87.8 million | +7.4% | American Airlines |
| 3 | Denver International | DEN | 82.4 million | +5.8% | United, Southwest, Frontier |
| 4 | Chicago O’Hare | ORD | 80.0 million | +8.3% | United, American |
| 5 | Los Angeles International | LAX | 76.6 million | Change data | United, American, Delta, Southwest |
| 6 | Orlando International | MCO | High volume | Growth recorded | Southwest, Spirit, JetBlue |
| 7 | Charlotte Douglas | CLT | Significant volume | Stable growth | American Airlines |
| 8 | Las Vegas McCarran | LAS | Major volume | Strong recovery | Southwest, Spirit, Frontier |
| 9 | Phoenix Sky Harbor | PHX | Increasing traffic | Positive growth | Southwest, American |
| 10 | Seattle-Tacoma | SEA | Growing volume | Year-over-year increase | Alaska, Delta |
Source: Airports Council International (ACI), Airport Authority Reports, BTS Data
Hartsfield-Jackson Atlanta International Airport decisively maintained its title as the world’s busiest airport in 2024 and 2025, processing 108.1 million passengers in 2024. This represented a 3.3% increase from 2023‘s 104.65 million passengers, though still falling approximately 2% short of the pre-pandemic record of 110.53 million set in 2019. Atlanta has held this prestigious ranking for 26 of the past 27 years, only losing the top spot briefly in 2020 during the pandemic. The airport’s dominance stems from its strategic location, which allows 80% of the US population to be reached within a two-hour flight, and its role as Delta Air Lines’ largest hub. Delta and its regional affiliate Delta Connection transported over 225,000 passengers per day through Atlanta in 2025, accounting for approximately 80% of all passenger traffic at the airport.
Dallas/Fort Worth International Airport ranked as the third busiest globally and second in the United States with 87.8 million passengers in 2024, showing robust growth of 7.4% compared to the previous year. Denver International Airport processed 82.4 million passengers, up 5.8%, while Chicago O’Hare handled 80.0 million passengers with an impressive 8.3% year-over-year increase. Los Angeles International Airport served 76.6 million passengers but remained 13% below its pre-pandemic 2019 levels, one of the few major airports still recovering to previous heights. The airport landscape in 2025 showed that hub airports with strong connecting traffic and diverse airline operations performed best, while airports heavily dependent on business travel or international routes faced more gradual recovery trajectories. The top 10 US airports collectively handled over 700 million passengers, representing the majority of domestic air traffic.
Airline Performance and On-Time Statistics in the US 2025
| Metric | 2024 Full Year | December 2024 | Best Month 2025 | Industry Standard |
|---|---|---|---|---|
| On-Time Arrival Rate | 78.10% | 78.0% | 86.0% (October 2024) | Target: 80%+ |
| Flight Cancellation Rate | 1.4% | 0.7% | 0.6% (September 2024) | Target: <2% |
| Flights Operated (December) | 627,365 | 627,365 | – | Up 3.91% YoY |
| Tarmac Delays >3 Hours (Domestic) | 437 delays | 46 delays | – | Historical high for 2024 |
| Tarmac Delays >4 Hours (International) | 61 delays | 8 delays | – | Up from 35 in 2023 |
| Mishandled Wheelchairs Rate | Lower than 2023 | Decreased | Improving trend | Goal: continued reduction |
| Involuntary Bumping Rate | Decreased | Lower levels | Industry low | Minimal occurrences |
Source: Department of Transportation (DOT) Air Travel Consumer Report (ATCR)
US airlines posted an on-time arrival rate of 78.10% for the full year 2024, representing a slight decrease from 78.34% in 2023. This performance metric indicates that just over 3 out of every 4 flights arrived at their destinations on time, defined as within 15 minutes of the scheduled arrival time. December 2024 saw an on-time rate of 78.0%, down from 83.9% in December 2023 and 84.9% in November 2024, reflecting the challenges of winter weather and increased holiday traffic. However, the industry demonstrated strong operational capabilities during certain months, with October 2024 achieving an 86.0% on-time arrival rate, up from 84.0% in September and 84.1% in October 2023.
Flight cancellations remained relatively controlled in 2024, with an annual cancellation rate of 1.4%, slightly higher than the 1.3% rate recorded in 2023. December 2024 experienced a 0.7% cancellation rate, affecting 4,579 of the 631,944 scheduled domestic flights, compared to 0.4% in December 2023. The best performance came in September 2024 with only a 0.6% cancellation rate, lower than the 1.2% rate in September 2023. Airlines operated 627,365 flights in December 2024, representing a 3.91% increase over December 2023‘s 603,756 flights. A concerning trend emerged in tarmac delays, with 437 domestic flights experiencing delays exceeding three hours in 2024, the highest number since the Tarmac Delay Rule took effect in 2010. International flights saw 61 delays exceeding four hours, up from 35 in 2023. Despite these operational challenges, the industry made progress in other consumer protection areas, with airlines losing or damaging fewer bags and wheelchairs, and involuntarily bumping fewer travelers compared to previous years.
US Airline Industry Financial Performance in the US 2025
| Financial Metric | Q4 2024 | Full Year 2024 | Q2 2025 | Comparison |
|---|---|---|---|---|
| After-Tax Net Profit | $2.4 billion | $6.7 billion | $4.0 billion | 2024 FY: -$0.1B vs 2023 |
| Pre-Tax Operating Profit | $4.4 billion | $13.5 billion | $5.0 billion | Strong margins maintained |
| Operating Revenue | – | $223.31 billion (2023) | – | Projected increase 2024 |
| Domestic Operating Expenses | – | Majority of total | $45.2 billion (Q2 2025) | Labor: 37.4% share |
| Fuel Costs (% of Expenses) | – | Decreasing share | 15.0% (Q2 2025) | Down from 18.2% (Q2 2024) |
| Labor Costs (% of Expenses) | – | Increasing share | 37.4% (Q2 2025) | Up from 35.5% (Q2 2024) |
| Net Profit Margin | – | Low single digits | Improving | Industry avg: 3-4% |
| Domestic Net Profit | – | Higher than international | – | Strongest segment |
Source: Bureau of Transportation Statistics (BTS) Airline Financial Reports
US scheduled passenger airlines reported a full-year 2024 after-tax net profit of $6.7 billion and a pre-tax operating profit of $13.5 billion, demonstrating the industry’s resilience despite facing headwinds from increased labor costs and operational challenges. This performance represented a decrease compared to 2023, but remained solidly profitable across the sector. The fourth quarter of 2024 alone generated an after-tax net profit of $2.4 billion and a pre-tax operating profit of $4.4 billion, showing strong performance during the traditionally robust holiday travel season. The industry’s financial health continued into 2025, with second-quarter results showing an after-tax net income of $4.0 billion and a pre-tax operating profit of $5.0 billion.
The cost structure of US airlines showed significant shifts in 2024 and 2025, with labor costs becoming an increasingly dominant expense category. In the second quarter of 2025, domestic operating expenses totaled $45.2 billion, with labor accounting for 37.4% of total expenses, up from 35.5% in the second quarter of 2024. This increase reflected the impact of new labor agreements and the competitive market for aviation workers. Conversely, fuel costs as a percentage of domestic operating expenses decreased to 15.0% in Q2 2025 from 18.2% in Q2 2024, providing significant relief to airline bottom lines. The industry benefited from lower oil prices throughout 2024 and 2025, with jet fuel costs declining substantially. Despite generating billions in profits, the industry’s net profit margin remained thin at approximately 3-4%, translating to just $7-8 profit per passenger per segment. This narrow margin underscores the industry’s vulnerability to external shocks such as fuel price spikes, economic downturns, or major operational disruptions.
US Commercial Aircraft Fleet in the US 2025
| Aircraft Category | 2024 Fleet Size | 2045 Projected | Annual Growth Rate | Key Trends |
|---|---|---|---|---|
| Total Commercial Fleet | 7,387 aircraft | 10,607 aircraft | 1.7% | Steady expansion |
| Mainline Passenger Jets | 4,829 aircraft | 6,854 aircraft | 1.7% | Fleet modernization |
| Regional Carrier Aircraft | 1,697 aircraft | 2,354 aircraft | 1.6% | Shift to larger jets |
| Regional Jets (70-90 seats) | 1,370 jets | 2,114 jets | 2.1% | Replacing 50-seaters |
| Regional Turboprops/Pistons | 327 aircraft | 240 aircraft | -1.5% | Declining segment |
| Cargo Large Jets | 861 aircraft | 1,399 aircraft | 2.3% | E-commerce driven |
| Narrowbody Passenger | Majority of fleet | Increasing share | Varies | 737 MAX, A320neo families |
| Widebody Passenger | Smaller segment | Gradual growth | 2.7% | 777X, 787, A350 |
Source: Federal Aviation Administration (FAA) Aerospace Forecast Fiscal Years 2025-2045
The US commercial aircraft fleet totaled 7,387 aircraft in 2024, with projections indicating growth to 10,607 aircraft by 2045, representing an average annual growth rate of 1.7% over the forecast period. The mainline passenger carrier fleet, including regional jets, comprised 4,829 aircraft in 2024 and is forecast to expand to 6,854 aircraft by 2045. This growth trajectory reflects the aviation industry’s long-term confidence in passenger demand, despite near-term challenges from production delays and supply chain constraints affecting aircraft manufacturers. The fleet expansion will be driven primarily by the need to replace aging aircraft with more fuel-efficient models and to accommodate projected increases in passenger traffic.
The regional carrier segment showed distinct trends, with a total fleet of 1,697 aircraft in 2024 projected to grow to 2,354 by 2045. Within this category, the transition from 50-seat regional jets to larger 70-90 seat jets continues accelerating, with the jet portion of the regional fleet increasing from 1,370 aircraft in 2024 to 2,114 by 2045. Airlines favor larger regional jets, particularly the Embraer ERJ-175, for their superior economics and passenger comfort. Meanwhile, the turboprop and piston aircraft segment faces decline, shrinking from 327 aircraft in 2024 to a projected 240 by 2045, as these smaller aircraft become less economically viable. The cargo jet fleet demonstrated robust growth prospects, expanding from 861 aircraft in 2024 to 1,399 by 2045, driven by e-commerce demand and the need to replace aging freighters. Airlines continue investing in modern, fuel-efficient aircraft such as the Boeing 737 MAX and Airbus A320neo families for narrowbody operations, while widebody fleets gradually incorporate advanced aircraft including Boeing 777X, 787 Dreamliner, and Airbus A350 models.
General Aviation Activity in the US 2025
| Category | 2023 Active Fleet | 2023 Hours Flown | 2045 Projected Fleet | Growth Rate |
|---|---|---|---|---|
| Total General Aviation Fleet | 214,222 aircraft | 28.6 million hours | 238,350 aircraft | +0.5% annually |
| Fixed-Wing Piston | Majority of fleet | Declining hours | -4,450 aircraft by 2045 | -0.1% annually |
| Fixed-Wing Turbine (inc. Rotorcraft) | 34,630 aircraft | Increasing hours | 54,685 aircraft | +2.1% annually |
| Turbojets | Subset of turbine | High utilization | Strongest growth | +2.7% annually |
| Rotorcraft (Total) | 10,051 aircraft | Growing hours | 14,715 aircraft | +1.7% annually |
| Light Sport Aircraft (LSA) | 3,007 aircraft | Rapid growth | 5,867 aircraft | +3.1% annually |
| Experimental Aircraft | Growing segment | 24.7% increase (2023) | Continued expansion | Strong growth |
| Active Pilots (excl. students, ATPs) | 324,081 pilots | – | 355,180 pilots | +0.4% annually |
Source: Federal Aviation Administration (FAA) General Aviation and Part 135 Activity Survey
The general aviation sector demonstrated robust health in 2023, with the active fleet estimated at 214,222 aircraft, representing a 2.2% increase from 2022 and the highest fleet size since 2010. Total hours flown reached 28.6 million in 2023, up 6.0% from the previous year and 11.7% above 2019 levels, marking the highest flight hours since 2000. This vigorous activity reflects strong demand across multiple general aviation segments, from personal flying to business aviation. The FAA projects the general aviation fleet will grow to 238,350 aircraft by 2045, with an average annual growth rate of 0.5%, as increases in turbine-powered aircraft, experimental aircraft, and light sport aircraft offset declines in the traditional fixed-wing piston fleet.
The most dynamic growth occurs in the turbine-powered segment, which includes turbojets, turboprops, and turbine helicopters. This fleet category numbered 34,630 aircraft in 2023 and is projected to reach 54,685 by 2045, representing 57.9% cumulative growth over the period and an average annual increase of 2.1%. Business jets lead this expansion with a projected 2.7% annual growth rate, driven by corporate demand and economic growth. The rotorcraft fleet, encompassing both piston and turbine helicopters, totaled 10,051 aircraft in 2023 and is forecast to grow to 14,715 by 2045 at 1.7% annually, supported by demand from emergency medical services, firefighting, search and rescue operations, and offshore energy. Light sport aircraft, a category created in 2005, showed remarkable growth with 3,007 aircraft in 2023 and projections reaching 5,867 by 2045 at 3.1% annual growth, nearly doubling the fleet size. The experimental aircraft category recorded a 24.7% increase in hours flown in 2023, demonstrating the vitality of recreational and amateur-built aviation. The pilot population, excluding students and airline transport pilots, stood at 324,081 in 2024 and is projected to grow modestly to 355,180 by 2045 at 0.4% annually.
Air Traffic Control Operations in the US 2025
| Facility Type | 2024 Operations | 2045 Projection | Annual Growth | Operational Notes |
|---|---|---|---|---|
| FAA & Contract Towers | 56.5 million ops | 72.8 million ops | +1.1% | Recovering from 2020 decline |
| Commercial Operations | ~45% of total | Higher proportion by 2045 | +1.9% | Faster than non-commercial |
| General Aviation Operations | ~55% of total | Lower proportion by 2045 | +0.5% | Dominated by piston aircraft |
| Large Hub Airports | Highest volume | Fastest growth projected | +1.9% | Concentration of activity |
| Medium Hub Airports | Significant volume | Strong growth | +1.6% | Regional importance |
| TRACON Operations | Growing steadily | Continued expansion | +1.4% | Includes all IFR/VFR traffic |
| En Route Center IFR Handles | High commercial share | Increasing | +1.7% | 82.5% commercial in 2024 |
| Air Traffic Controllers Hired | 1,811 (2024) | 2,000 planned (2025) | Accelerating | Addressing staff shortages |
Source: Federal Aviation Administration (FAA) Aerospace Forecast
Airport operations at FAA and contract towers totaled 56.5 million in 2024, up 3.6% from the previous year and completing the recovery from the COVID-19 downturn that saw traffic plummet to 44.4 million in 2020 from 53.3 million in 2019. The FAA projects operations will reach 58.2 million in 2025 and grow to 72.8 million by 2045, representing an average annual increase of 1.1%. This growth will be driven primarily by commercial operations, which are forecast to increase 1.9% annually, approximately four times faster than non-commercial operations. The faster growth in commercial activity reflects increasing passenger demand and airlines’ ability to serve more passengers through larger aircraft and higher load factors, allowing passenger growth to exceed flight growth.
General aviation operations accounted for 54.7% of total tower operations in 2024, slightly higher than the pre-COVID share of 51.7% in 2019, demonstrating the sector’s strong recovery. However, general aviation’s share is expected to gradually decline as commercial operations grow more rapidly. Activity varies significantly by airport size, with large hub and medium hub airports experiencing the fastest growth rates of 1.9% and 1.6% annually, respectively, while small hub and non-hub facilities are projected to grow just 0.8% annually. At TRACON facilities, operations are forecast to grow 1.4% per year between 2025 and 2045, slightly faster than tower operations due to the different mix of traffic. En Route Center activity, measured by IFR aircraft handled, is projected to increase 1.7% annually, with commercial operations representing 82.5% of center traffic in 2024, significantly higher than the 58% share at TRACONs or 42% at towers. To support this growing demand, the FAA hired 1,811 controllers in 2024 and plans to hire 2,000 in 2025, the most in over a decade, addressing critical staffing shortages that have occasionally constrained capacity at certain facilities.
International Air Travel from the US in 2025
| Region | 2024 Passengers | 2045 Projection | Growth Rate | Top Countries |
|---|---|---|---|---|
| Total International (US & Foreign Carriers) | 266.9 million | 502.3 million | +3.1% annually | Mexico, Canada, UK |
| Latin America Region | 107.3 million | 210.3 million | +3.3% annually | Mexico, Dominican Republic, Colombia |
| Atlantic Region | 93.3 million | 166.5 million | +2.8% annually | UK, Germany, France |
| Pacific Region | 34.7 million | 72.4 million | +3.6% annually | Japan, South Korea, China |
| Canada Transborder | 31.5 million | 53.0 million | +2.5% annually | Multiple cities |
| Mexico (Top Country) | 40.8 million | 77.9 million | +3.1% annually | Multiple destinations |
| United Kingdom (Europe Top) | 21.2 million | 34.0 million | +2.3% annually | London primary |
| US Citizen Share – Atlantic | 57.2% (2024) | Stable/growing | – | Up from 50.8% (2019) |
Source: Federal Aviation Administration (FAA) Aerospace Forecast, Bureau of Transportation Statistics
International passenger traffic between the United States and global destinations reached 266.9 million passengers in 2024 on US and foreign flag carriers combined, representing a 9.3% increase over 2023 and marking a return to pre-COVID passenger levels. The recovery trajectory varied significantly by region, with the Latin America region leading the rebound, having fully recovered in 2022, followed by the Atlantic region in 2023. The Pacific region experienced the slowest recovery and is not forecast to reach 2019 levels until 2028, primarily due to prolonged travel restrictions in China and other Asian markets. The FAA projects total international passengers will grow to 502.3 million by 2045, representing an average annual increase of 3.1%.
The Latin America region remained the largest international destination for US travelers with 107.3 million passengers in 2024, more than double the Atlantic region’s volume. This dominance stems from geographic proximity, strong cultural and economic ties, and popular leisure destinations throughout Mexico, the Caribbean, Central America, and South America. Mexico alone accounted for 40.8 million passengers in 2024, making it the single largest international destination for US travelers and projected to reach 77.9 million by 2045. The Dominican Republic ranked second among Latin countries with 10.9 million passengers, while Colombia followed with significant traffic. The Pacific region, though smallest at 34.7 million passengers in 2024, is forecast to experience the fastest growth at 3.6% annually, reaching 72.4 million by 2045, driven by the economic expansion of Asian markets. The Atlantic region, which includes Europe, the Middle East, and Africa, served 93.3 million passengers in 2024, with the United Kingdom leading at 21.2 million passengers, followed by Germany at 11.0 million and France ranking among the top destinations. Canada Transborder traffic totaled 31.5 million passengers, projected to grow to 53.0 million by 2045 at 2.5% annually, the slowest growth rate among the four regions due to market maturity.
Air Cargo Operations in the US 2025
| Cargo Metric | 2024 Data | 2025 Projection | 2045 Forecast | Growth Rate |
|---|---|---|---|---|
| Total Revenue Ton Miles (RTMs) | 48.0 billion | 50.0 billion | 72.1 billion | +2.9% annually (2025-45) |
| Domestic Cargo RTMs | 18.1 billion | 18.6 billion | 27.6 billion | +2.0% annually |
| International Cargo RTMs | 29.9 billion | 31.4 billion | 44.5 billion | +3.3% annually |
| All-Cargo Share of Total RTMs | 83.7% | ~82% | ~83% | Stabilizing |
| Passenger Carrier RTMs | 16.3% | ~18% | ~17% | Growing share near-term |
| All-Cargo Domestic Share | 93.3% | ~93% | 94.5% | Slight increase |
| All-Cargo International Share | 78.0% | ~77% | 82.3% | Gradual increase |
| Pacific Region RTM Growth | – | Strong | Fastest regional | +3.5% annually |
Source: Federal Aviation Administration (FAA) Aerospace Forecast
US air carriers transported 48.0 billion revenue ton miles in 2024, showing modest growth from 47.3 billion in 2023 as the market normalized following post-pandemic adjustments. During the pandemic years, consumer spending shifted dramatically from services to goods, causing air cargo to surge 20% above 2019 levels by 2022. As spending patterns reverted in 2023-2024, cargo volumes moderated but remained 10% above pre-pandemic levels in 2023. Domestic cargo RTMs increased 3.1% to 18.1 billion in 2024, while international cargo grew just 0.5% to 29.9 billion, reflecting the completion of the pandemic-driven surge in e-commerce shipments and normalization of global supply chains.
The cargo market structure showed distinct trends, with all-cargo carriers handling 83.7% of total RTMs in 2024, down from peaks of 88.0% in 2020-2021 when passenger flights were grounded and belly-hold cargo capacity disappeared. As passenger flights returned, their share of cargo operations increased, with passenger carrier RTMs jumping 15.7% in 2024 while all-cargo RTMs declined 0.9%. The FAA projects total air cargo will grow 4.2% in 2025 as normalization completes, then expand at an average 2.9% annually through 2045, reaching 72.1 billion RTMs driven by steady economic growth and continued e-commerce demand. Domestic cargo is forecast to grow 2.0% annually to 27.6 billion RTMs by 2045, with all-cargo carriers maintaining a 94.5% market share. International cargo will expand 3.3% per year to 44.5 billion RTMs, with the Pacific region leading growth at 3.5% annually, followed by Other International regions at 4.0%, Atlantic at 2.6%, and Latin America at 1.7%. The all-cargo fleet of large jets is projected to increase from 861 aircraft in 2024 to 1,399 by 2045, with narrowbody cargo jets growing slowly while widebody freighters expand by approximately 22 aircraft annually as Boeing 777-8 freighters and converted 767-300 aircraft replace aging MD-11, A300, and 747-400 models.
Aviation Safety and Security Measures in the US 2025
| Safety Metric | Recent Data | Trend | Regulatory Body |
|---|---|---|---|
| Fatal Accidents (Commercial Aviation) | Near-zero (2024-25) | Historically safe | FAA, NTSB |
| General Aviation Accidents | Declining long-term | Improved training/equipment | FAA, NTSB |
| TSA Prohibited Items Caught | Thousands daily | Advanced screening technology | TSA |
| Air Traffic Control Incidents | Rare | Safety management systems | FAA |
| Aircraft Certification Standards | Stringent oversight | Post-737 MAX reforms | FAA |
| Pilot Rest Requirements | Enhanced regulations | Fatigue risk management | FAA |
| Cybersecurity Protocols | Increasing focus | Emerging threat priority | FAA, DHS |
| NextGen Implementation | Ongoing deployment | Modernized ATC systems | FAA |
Source: Federal Aviation Administration (FAA), Transportation Security Administration (TSA), National Transportation Safety Board (NTSB)
US commercial aviation maintained its position as one of the safest forms of transportation in 2024 and 2025, with zero fatal accidents involving major commercial carriers. This remarkable safety record reflects decades of continuous improvement in aircraft technology, pilot training, maintenance standards, and regulatory oversight. The FAA implemented enhanced aircraft certification procedures following the Boeing 737 MAX crisis, including more rigorous design reviews, increased inspector training, and improved coordination with international regulators. The National Transportation Safety Board (NTSB) continues investigating all incidents to identify root causes and recommend preventive measures, contributing to the industry’s proactive safety culture.
The Transportation Security Administration maintained robust security protocols throughout 2025, screening nearly 900 million passengers annually using advanced technology including computed tomography scanners that provide three-dimensional images of carry-on bags, improved explosive detection systems, and biometric verification at an increasing number of airports. TSA officers prevented thousands of prohibited items from entering secure areas daily, including firearms, explosives, and other dangerous materials. The FAA continued deploying the NextGen air traffic control modernization program, which replaces ground-based radar with satellite-based surveillance, enabling more precise aircraft tracking, more efficient flight paths, reduced fuel consumption, and enhanced safety through better situational awareness. The agency hired 2,000 new air traffic controllers in 2025 to address staffing challenges at critical facilities and ensure safe operations during peak traffic periods. Enhanced pilot rest requirements, implemented following fatigue-related incidents, mandate adequate time off between duty periods, particularly for international flights and overnight operations. The aviation industry increasingly focused on cybersecurity threats, with the FAA and Department of Homeland Security working with airlines and airports to protect critical systems from cyberattacks that could disrupt operations or compromise safety.
Environmental and Sustainability Initiatives in the US 2025
| Initiative | Current Status | 2030 Goals | Long-Term Vision |
|---|---|---|---|
| Sustainable Aviation Fuel (SAF) | Limited production/use | Significant increase | 100% SAF capability by 2050 |
| Carbon Emissions Reduction | Ongoing efficiency gains | 20% reduction vs 2005 | Net-zero by 2050 |
| Aircraft Fuel Efficiency | New generation aircraft | 50% improvement target | Continuous innovation |
| Airport Solar/Renewable Energy | Major airports adopting | Expanded deployment | Carbon-neutral operations |
| Electric/Hybrid Aircraft Development | Testing phase | Regional service trials | Short-haul operations |
| Noise Reduction Technologies | Quieter engines deployed | Community impact reduction | Next-gen quiet aircraft |
| Recycling Programs | Waste reduction initiatives | Enhanced circular economy | Zero waste to landfill |
| Alternative Propulsion Research | Hydrogen, battery testing | Prototype demonstrations | Long-haul applications |
Source: Federal Aviation Administration (FAA), Airlines for America (A4A), Environmental Protection Agency (EPA)
The US aviation industry accelerated sustainability efforts in 2024 and 2025, with airlines, airports, and manufacturers investing billions in technologies and operational improvements to reduce environmental impact. Sustainable Aviation Fuel (SAF), produced from renewable feedstocks such as used cooking oil, agricultural residues, and municipal solid waste, emerged as the most promising near-term solution for reducing aviation’s carbon footprint. SAF can reduce lifecycle carbon emissions by up to 80% compared to conventional jet fuel and works in existing aircraft engines without modification. Major US airlines increased SAF purchases throughout 2025, though production capacity remained limited, accounting for less than 1% of total fuel consumption. The industry set ambitious goals to achieve 3 billion gallons of annual SAF production by 2030 and 100% SAF capability across the fleet by 2050.
Aircraft manufacturers prioritized fuel efficiency in new designs, with the latest generation of narrowbody and widebody aircraft consuming 15-25% less fuel per seat-mile than previous models through advanced aerodynamics, lightweight composite materials, and efficient engines. Airlines retired older, less efficient aircraft at accelerated rates, replacing them with Boeing 737 MAX, Airbus A320neo family, 787 Dreamliner, and A350 aircraft that deliver significant fuel savings and emissions reductions. Major airports implemented renewable energy systems, with facilities installing solar panels, wind turbines, and electric ground support equipment to reduce fossil fuel dependence. Los Angeles International Airport, Denver International, San Francisco International, and others committed to carbon-neutral operations by 2030 through a combination of efficiency improvements, renewable energy, and carbon offset programs. The industry invested heavily in electric and hybrid-electric aircraft development for short-haul regional routes, with several manufacturers conducting flight tests of battery-powered aircraft capable of carrying 19 passengers up to 250 miles. Research into hydrogen fuel cells and other zero-emission propulsion systems continued, though practical applications remained years away. Airlines enhanced recycling programs, reducing single-use plastics on flights, implementing cabin waste sorting, and partnering with recycling facilities to divert materials from landfills. The FAA supported these efforts through research funding, regulatory streamlining for new technologies, and coordination with international aviation organizations to harmonize global environmental standards.
Economic Impact of Aviation in the US 2025
| Economic Indicator | 2024-2025 Data | Employment | Economic Contribution |
|---|---|---|---|
| Direct Aviation Jobs | 1+ million | Airlines, airports, manufacturers | High-wage careers |
| Indirect/Induced Jobs | 5+ million | Supply chain, tourism, related sectors | Multiplier effect significant |
| Annual Economic Impact | $1.8+ trillion | GDP contribution | Essential infrastructure |
| Air Cargo Economic Value | $200+ billion annually | Time-sensitive goods | Supply chain critical |
| Business Travel Facilitation | Billions in productivity | Executive connectivity | Deal-making enabler |
| Tourism Industry Support | $150+ billion | International/domestic visitors | Hospitality dependent |
| Aircraft Manufacturing | Major export industry | Boeing, suppliers | Trade balance positive |
| Airport Construction/Upgrades | $10+ billion annually | Infrastructure investment | Job creation |
Source: Airlines for America (A4A), Federal Aviation Administration (FAA), Bureau of Economic Analysis (BEA)
The US aviation industry serves as a critical economic engine, generating over $1.8 trillion in annual economic activity and supporting more than 5 million American jobs directly and indirectly as of 2024-2025. The industry’s economic impact extends far beyond airlines and airports, encompassing aircraft manufacturing, parts suppliers, fuel providers, catering services, ground transportation, hotels, rental cars, and tourism-related businesses throughout the country. Major airlines directly employed over 750,000 workers in 2024, including pilots, flight attendants, mechanics, customer service agents, and corporate staff, with average wages significantly above the national median due to specialized skills requirements and union representation.
The multiplier effect of aviation spending creates substantial additional employment throughout the economy, with every airline job supporting approximately 6-7 jobs in related industries. Aircraft manufacturing, led by Boeing and supported by thousands of suppliers across all 50 states, generates over $100 billion in annual revenue and represents a major US export industry, contributing positively to the trade balance. Air cargo operations enable just-in-time manufacturing, overnight delivery services, and rapid movement of high-value, time-sensitive goods worth over $200 billion annually, supporting industries from technology to pharmaceuticals to fresh food distribution. Business travel facilitated by commercial aviation enables corporate executives, sales teams, consultants, and professionals to conduct face-to-face meetings, close deals, and maintain relationships across the country and world, generating productivity gains estimated at tens of billions of dollars. Tourism dependent on air travel brought over 80 million international visitors to the United States in recent years, who spent approximately $150 billion on hotels, restaurants, attractions, and shopping, supporting communities nationwide. Airports invested over $10 billion annually in terminal expansions, runway improvements, and facility upgrades, creating construction jobs and enhancing capacity for future growth. The industry paid substantial federal, state, and local taxes through ticket taxes, fuel taxes, property taxes, and corporate income taxes, funding government services and infrastructure programs. Small and medium-sized communities benefit from air service that enables economic development, attracting businesses and investment that require reliable connectivity to major markets.
Regional Air Service and Essential Air Service in the US 2025
| Program | 2024-2025 Status | Communities Served | Funding |
|---|---|---|---|
| Essential Air Service (EAS) | Active program | 110+ communities | ~$300 million annually |
| Small Community Air Service | Ongoing support | Rural/secondary cities | Federal grants available |
| Regional Carrier Operations | 1,697 aircraft | Feed to major hubs | Declining to smaller cities |
| 50-Seat Jet Phase-Out | Accelerating | Replaced by 70-90 seaters | Economics favor larger aircraft |
| Pilot Availability | Improving but challenging | Regional carrier shortages easing | Training pipeline expanding |
| Route Profitability | Variable by market | Subsidy-dependent service | Cost pressures ongoing |
Source: Department of Transportation (DOT), Federal Aviation Administration (FAA)
The Essential Air Service (EAS) program continued providing vital air connectivity to over 110 rural and small communities across the United States in 2024-2025, receiving approximately $300 million in annual federal subsidies to maintain service that would otherwise be unprofitable for airlines. The program, established by the Airline Deregulation Act of 1978, guarantees that communities served by certificated air carriers before deregulation maintain scheduled air service, linking remote areas to the national aviation network. EAS typically provides 2-3 daily round-trip flights connecting small communities to larger hub airports where passengers can access broader route networks. However, the program faces ongoing challenges including rising operating costs, pilot shortages affecting regional carriers, and the phase-out of 50-seat regional jets that historically served many EAS routes.
Regional carriers operating under capacity-purchase agreements with major airlines reduced service to smaller cities since the pandemic, cutting routes where demand remained weak or operating economics deteriorated. Mainline carriers successfully reduced costs through voluntary flight crew retirements during the pandemic, then drew replacement pilots from regional carrier ranks, exacerbating pre-existing pilot shortages at regional airlines. While senior captain shortages are expected to persist through 2026 due to training and experience requirements, the overall pilot situation improved compared to 2021-2022. The shift toward larger 70-90 seat regional jets like the Embraer ERJ-175 offers better unit economics but may not suit smaller markets with insufficient demand to fill larger aircraft. Some communities lost air service entirely or saw frequencies reduced, prompting calls for enhanced federal support and innovative solutions such as subsidized larger aircraft service, partnerships with ultra-low-cost carriers, or exploration of emerging technologies like electric regional aircraft. The Department of Transportation regularly reviews EAS designations, adjusting subsidy levels and service requirements to balance community needs with fiscal responsibility. Secondary cities not qualifying for EAS but still dependent on regional airline service face market-driven decisions by carriers, with some experiencing service enhancements due to population growth and economic development while others see reduced frequencies or route eliminations as airlines optimize networks for profitability.
Future Outlook for Air Travel in the US 2025
| Trend | Near-Term (2025-2030) | Long-Term (2030-2045) | Potential Impact |
|---|---|---|---|
| Passenger Growth | 2-3% annually | 2.5% annually | Capacity expansion needed |
| Technology Integration | Advanced biometrics, AI | Autonomous systems, supersonic | Transformed experience |
| Sustainability Requirements | SAF adoption accelerates | Net-zero operations | Industry restructuring |
| Aircraft Development | Delivery delays resolved | Next-generation efficiency | Fleet modernization |
| Airport Infrastructure | Major expansions underway | Smart airports, automation | Enhanced capacity |
| Pricing Trends | Moderate increases | Linked to fuel/labor costs | Affordability challenges |
| Competition | Consolidation stable | Potential new entrants | Market dynamics evolving |
| Advanced Air Mobility | Early demonstrations | Urban/regional operations | New market segment |
Source: Federal Aviation Administration (FAA) Forecasts, Industry Analysis
The US aviation industry outlook for 2025 through 2045 projects sustained growth driven by economic expansion, population increases, rising incomes, and continued globalization of business and leisure travel. The FAA forecasts domestic passenger enplanements will grow from approximately 880 million in 2025 to over 1.2 billion by 2045, while international passengers on US carriers increase from about 140 million to 240 million over the same period. This growth requires substantial capacity additions through new aircraft deliveries, with the commercial fleet expanding from 7,500 aircraft in 2025 to over 10,600 by 2045. However, near-term growth faces constraints from aircraft production delays affecting Boeing and Airbus, supply chain disruptions limiting manufacturing output, and labor negotiations that increase operating costs and potentially restrict expansion plans.
Technological transformation will reshape the passenger experience and airline operations over the forecast period. Airports will deploy advanced biometric systems enabling seamless identity verification from curb to gate, reducing wait times and enhancing security. Artificial intelligence will optimize every aspect of airline operations from revenue management to maintenance scheduling to customer service, improving efficiency and personalizing the travel experience. The industry will progressively adopt Sustainable Aviation Fuel, targeting 3 billion gallons annually by 2030 and 100% SAF-capable operations by 2050 to meet ambitious carbon reduction goals. New aircraft entering service between 2025-2045 will deliver step-change improvements in fuel efficiency, noise reduction, and passenger comfort through advanced materials, engine technology, and aerodynamic designs. Major airports will invest over $150 billion in infrastructure improvements including new runways, terminal expansions, upgraded air traffic control systems, and enhanced ground transportation connections to accommodate growing demand. The FAA’s NextGen program will complete nationwide implementation, enabling precision satellite-based navigation, optimized flight routing, reduced fuel consumption, and increased airspace capacity. Pricing will likely trend upward faster than general inflation as airlines recover pandemic-era debt, invest in fleet renewal and sustainability initiatives, and face ongoing pressure from rising labor costs, though competitive dynamics and efficiency gains may moderate increases. Advanced Air Mobility, including electric vertical takeoff and landing aircraft (eVTOLs), could emerge as a new market segment for urban and regional transportation, though regulatory approval, infrastructure development, and public acceptance will determine the timeline and scale of adoption. The industry’s success navigating these opportunities and challenges will determine whether air travel remains accessible to broad segments of the American population while meeting environmental responsibilities and maintaining the world’s highest safety standards.
Disclaimer: This research report is compiled from publicly available sources. While reasonable efforts have been made to ensure accuracy, no representation or warranty, express or implied, is given as to the completeness or reliability of the information. We accept no liability for any errors, omissions, losses, or damages of any kind arising from the use of this report.