
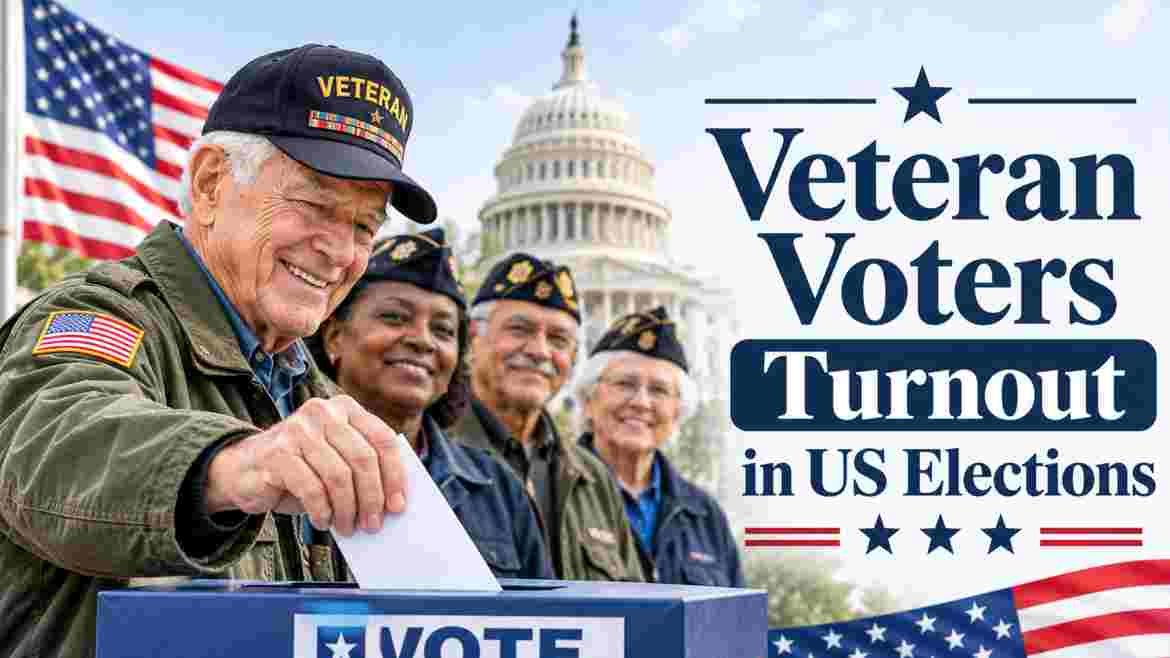
Veteran Voters Turnout in US Elections 2026 shows that veterans were 10% of voters in the NBC News exit poll, and 57% of them backed Republicans against 41% for Democrats. Veterans voted at 62.7% in the 2022 midterms, 11.4 points above nonveterans, according to Census Bureau data.
Veteran Voters Turnout in US Elections 2026 – Introduction
Veteran Voters Turnout in US Elections 2026 stayed strong even as veterans lost ground in Congress. Veterans were 10% of voters in the NBC News exit poll, and 57% of them voted Republican against 41% for Democrats. Nonveterans moved the other way, with 57% backing Democrats. A record 258 veterans appeared on the ballot on November 3, 2026, up 21% from 2024, yet the incoming Congress will hold the smallest veteran share in at least five decades. This report covers veteran vote choice, turnout history, candidates, winners and survey findings.
Veteran turnout for 2026 is not published yet. The Census Bureau releases its voter supplement months after the election, so this report uses the 2022 midterms as the turnout benchmark. Several congressional races with veteran candidates remain too close to call, and exit poll figures can change as pollsters update their weights. Each table names its source and date.
Interesting Facts: Veteran Voters Turnout in US Elections 2026
VETERAN VS NONVETERAN VOTE, 2026 EXIT POLL (each █ = 4%)
Veterans, Republican     ██████████████ 57%
Veterans, Democratic     ██████████ 41%
Nonveterans, Republican  ██████████ 42%
Nonveterans, Democratic ██████████████ 57%| Interesting Fact(s) | 2026 Data |
|---|---|
| Election Day | November 3, 2026 |
| Veterans as share of voters (NBC exit poll) | 10% |
| Veterans’ vote, Republican to Democratic | 57% to 41% |
| Nonveterans’ vote, Democratic to Republican | 57% to 42% |
| Veteran turnout, 2022 midterms (Census Bureau) | 62.7% |
| Nonveteran turnout, 2022 midterms | 51.3% |
| Veterans on the 2026 ballot for Congress | 258 (record) |
| Veterans confirmed for next Congress (Nov. 5 tally) | At least 57, plus 20 races too close to call |
| Veteran share of next Congress | About 15%, down from 19% |
Source: NBC News Exit Poll (SSRS), 2026; U.S. Census Bureau, 2022 Current Population Survey; With Honor Action; Military Times (November 5, 2026).
Veterans voted Republican by 16 points, and nonveterans voted Democratic by 15 points. That is a 31-point gap between two groups that share the same ballot. Veterans also turn out at higher rates than other citizens. In 2022, 62.7% of veteran citizens voted, against 51.3% of nonveterans.
The record 258 veteran candidates did not produce more veteran winners. Military Times counts at least 57 veterans heading to the 120th Congress and another 20 in close races. Even if every close race goes to a veteran, the share of Congress held by veterans falls to about 15%. Veteran Voters Turnout in US Elections 2026 stayed high at the ballot box while representation fell.
2026 Veteran Voting Preferences: How Did Veterans and Nonveterans Vote?
MARGIN BY GROUP (each █ = 2 points)
Veterans     ████████ Republicans +16
Nonveterans  ░░░░░░░ Democrats +15
| Group | Share of Voters | Democratic | Republican | Margin |
|---|---|---|---|---|
| Veterans | 10% | 41% | 57% | Republicans +16 |
| Nonveterans | 90% | 57% | 42% | Democrats +15 |
Source: NBC News Exit Poll (SSRS), 2026, national exit poll by military service.
Veterans were 10% of voters. They split 57% Republican to 41% Democratic, a 16-point Republican margin. Nonveterans were 90% of voters and split 57% Democratic to 42% Republican, a 15-point Democratic margin. The two groups together show Republicans holding the veteran vote while losing the larger nonveteran vote.
Veterans still leaned Republican by wide margins in earlier midterms. In 2018, AP VoteCast found nearly 6 in 10 veterans voting Republican. The 2026 figure of 57% sits close to that mark. The change in 2026 came from nonveterans, not veterans. Veteran voters stayed with their party while the rest of the electorate moved toward Democrats in Veteran Voters Turnout in US Elections 2026.
2026 Veteran Voter Turnout Benchmark: Do Veterans Vote More Than Nonveterans?
2022 MIDTERM TURNOUT BY MILITARY STATUS (each █ = 4%)
Veterans      ████████████████ 62.7%
All citizens  █████████████ 52.2%
Nonveterans   █████████████ 51.3%
| Measure | 2022 Figure | Source |
|---|---|---|
| Veteran turnout | 62.7% | Census Bureau CPS |
| Nonveteran turnout | 51.3% | Census Bureau CPS |
| Turnout gap | 11.4 points | Our calculation |
| Citizen voting-age turnout, all adults | 52.2% | Census Bureau CPS |
| Veteran population | 18.4 million | Bureau of Labor Statistics |
| Veterans as share of 2026 voters | 10% | NBC exit poll |
Source: U.S. Census Bureau, Current Population Survey Voting and Registration Supplement (November 2022); Bureau of Labor Statistics, Veterans Supplement (2022); NBC News Exit Poll, 2026.
Veterans voted at 62.7% in the 2022 midterms, 11.4 points above nonveterans at 51.3% and 10.5 points above the national citizen rate of 52.2%. The Bureau of Labor Statistics counted 18.4 million veterans in 2022. Veterans were about 7% of the civilian adult population in 2022 and 10% of 2026 voters, which fits their higher turnout.
The 2026 exit poll puts veterans at 10% of voters. The Census Bureau will publish 2026 veteran turnout in a later voting supplement, so no 2026 rate exists yet. Expect the gap to remain double digits, as it has in past surveys. Economic conditions improved for veterans before the vote: their jobless rate fell to 2.7% in October 2026 as employers added 165,000 hires, according to Military Times. A peer-reviewed study of Current Population Survey data from 1994 to 2014, summarized by Syracuse University’s Institute for Veterans and Military Families, found that veterans vote more often even after adjusting for socioeconomic and demographic factors.
2026 Veteran Candidates for Congress: How Many Veterans Ran in the Midterms?
VETERANS ON THE BALLOT FOR CONGRESS (each █ = 10)
2022  ████████████████████ 195
2024  █████████████████████ 213
2026  ██████████████████████████ 258
| Measure | Figure | Change |
|---|---|---|
| Veterans on the 2026 ballot | 258 | +21% vs 2024, +32% vs 2022 |
| Running for the House | 227 | Not compared |
| Running for the Senate | 31 | Not compared |
| Veterans on the 2024 ballot | 213 | Baseline |
| Veterans on the 2022 ballot | 195 | Baseline |
| Veterans in primaries, 2026 | More than 750 | +47% vs 2024 |
| Americans who trust veterans in office | 77% | Gallup and With Honor Action, July |
Source: With Honor Action; Military Times (November 3, 2026); Gallup and With Honor Action survey (July 2026); our calculation.
A record 258 veterans were on the ballot, with 227 running for the House and 31 for the Senate. That is 21% more than the 213 in 2024 and 32% more than the 195 in 2022. More than 750 veterans ran in primaries, a 47% increase from 2024. Gallup and With Honor Action found 77% of Americans trust people with military experience to perform well in office.
The pipeline grew faster at the primary stage than at the general election, with a 47% gain against 21%. The 258 veterans on the November ballot equal about 34% of the 750-plus who ran in primaries. The 258 figure covers veterans in both major parties and independents. Voters in Veteran Voters Turnout in US Elections 2026 had more veteran choices than at any point in the data.
2026 Veteran Candidates by Party and Gender: Republicans, Democrats and Independents
VETERAN CANDIDATES BY PARTY (each █ = 10)
Republicans               ████████████ 115
Democrats                 ████████ 80
Independents/third party  ██████ 63
| Group | Candidates | Share of 258 | Open-Seat Candidates |
|---|---|---|---|
| Republicans | 115 | 44.6% | 67 |
| Democrats | 80 | 31.0% | 61 |
| Independents and third party | 63 | 24.4% | 63 |
| Women (all parties) | 38 | 14.7% | Not reported |
| Women, Democrats | 21 | 8.1% | Not reported |
| Women, Republicans | 8 | 3.1% | Not reported |
| Women, independents | 9 | 3.5% | Not reported |
Source: With Honor Action; Military Times (November 3, 2026); our calculation.
Republicans fielded 115 veteran candidates, 44.6% of the total. Democrats fielded 80, or 31.0%, and independents and third-party candidates fielded 63, or 24.4%. Of 191 open-seat candidates, 67 were Republicans, 61 were Democrats and 63 were independents or third-party members. Every independent veteran ran in an open seat.
Women accounted for 38 veteran candidates, 14.7% of the total and up from 21 in 2024, an 81% increase. Democrats had 21 women, Republicans 8 and independents 9. Roughly a quarter of veteran candidates were incumbents, which leaves 67 non-open races.
2026 Veterans in Congress Election Results: How Many Veterans Won?
VETERANS WON OR HELD, HOUSE (each █ = 4)
House Republicans  ████████ 32
House Democrats    █████ 21
| Measure | Military Times, Nov. 5 | usmilitary.org, Nov. 6 |
|---|---|---|
| Veterans confirmed for 120th Congress | At least 57 | At least 76 |
| Republicans | 32 in House | 44 |
| Democrats | 21 in House | 32 |
| Senate veterans | At least 13 | 13, including 10 not on the 2026 ballot |
| New or returning to the House | At least 14 new, at least 43 retained | 15 first-time or returning |
| Veteran races uncalled | 20 | 9 |
Source: Military Times (November 5, 2026); usmilitary.org analysis citing Congressional Research Service (November 6, 2026, 4 p.m. Eastern).
Military Times counted 21 Democratic and 32 Republican veterans winning House seats as of November 5, with at least 14 new to the chamber and at least 43 keeping their seats. At least 13 veterans will serve in the Senate. A separate tally on November 6 counted 76 confirmed veterans, 44 Republicans and 32 Democrats, with 9 races uncalled. That tally includes 10 senators who were not on the 2026 ballot.
The two counts differ because of timing and because the second includes holdover senators. Military Times’ own House figures also come from different cuts: 21 Democrats plus 32 Republicans make 53, while 14 new plus 43 retained make 57. The count was 98 veterans when the current Congress began. Treat every figure as preliminary until the 9 uncalled races resolve.
2026 Veterans in the US Senate by Military Branch: Army, Navy, Marines and Air Force
VETERAN SENATORS BY BRANCH, 120TH CONGRESS (each █ = 1 senator)
Army       █████ 5
Navy       ████ 4
Marines    ███ 3
Air Force  █ 1
| Branch | Veteran Senators | Share of 13 | Examples |
|---|---|---|---|
| Army | 5 | 38.5% | Jack Reed, Tom Cotton, Ed Markey |
| Navy | 4 | 30.8% | Not named in the sources used |
| Marines | 3 (4 if Sullivan wins) | 23.1% | Dan Sullivan, if he holds Alaska |
| Air Force | 1 | 7.7% | Not named in the sources used |
| National Guard | Included in totals | Not separated | Barry Moore, Alabama |
Source: Military Times (November 5, 2026); our calculation.
If the results are certified, the Senate will hold 13 veterans: five from the Army, four from the Navy, three Marines and one from the Air Force. Army veterans are the largest group at 38.5%. Navy veterans make up 30.8%, Marines 23.1% and the Air Force 7.7%. Marine veteran Dan Sullivan of Alaska would make a fourth Marine and a 14th veteran if he wins his race.
Three Army veterans anchor the chamber’s defense and intelligence debates. Jack Reed is the ranking Democrat on the Armed Services Committee and is likely to chair it. Tom Cotton of Arkansas and Ed Markey of Massachusetts also return. Barry Moore served in the Alabama National Guard and won an open Alabama seat. The branch counts come from Military Times and add to 13, which matches its Senate total.
2026 Veteran Share of Congress: How Much Has Military Service Declined Among Lawmakers?
VETERAN SHARE OF CONGRESS (each █ = 4%)
Early 1970s       ██████████████████ 73%
2001              ███████ 27%
2025              █████ 19%
2027 (projected)  ████ 15%
| Period | Veteran Share of Congress | Change From Prior Row |
|---|---|---|
| Early 1970s | About 73% | Baseline |
| 2001 | 27% | -46 points |
| 2025 (119th Congress) | 19% | -8 points |
| 2027 (120th Congress, projected) | About 15% | -4 points |
Source: Military Times analysis (November 5, 2026); Congressional Research Service; usmilitary.org.
Veterans held about 73% of seats in the early 1970s, 27% in 2001 and 19% in 2025. The incoming class is on track for about 15%, the lowest point since at least the 1970s. The decline from 2001 is 12 points, and the drop from 2025 is 4 points. A veteran count of 98 at the start of the current Congress fell to 76 confirmed.
Veterans still hold more seats than their share of the population. Roughly 6% to 7% of U.S. adults are veterans, and about 15% of the next Congress will be. The decline continued even though a record 258 veterans ran, so ballot access did not translate into seats. The record field and shrinking results make Veteran Voters Turnout in US Elections 2026 a story about candidates as well as voters.
2026 Notable Veteran Races: Wellman, Luria, Lacore, Sullivan and Moore
MARGINS IN CLOSE VETERAN RACES (votes, each █ = 500)
Lacore (SC House)               ███████ 3,300
Sullivan (AK Senate, trailing)  █ 637
| Veteran | Race | Result or Status |
|---|---|---|
| Fred Wellman, Army | Missouri House | Defeated Rep. Ann Wagner |
| Elaine Luria, Navy | Virginia House | Defeated Rep. Jen Kiggans |
| Nancy Lacore, Navy vice admiral (retired) | South Carolina House | Led by 3,300 votes, AP had not called |
| Dan Sullivan, Marine | Alaska Senate | Trailed Mary Peltola by 637 votes, 78% counted |
| Barry Moore, Alabama National Guard | Alabama Senate | Won open seat |
| Jack Reed, Army | Rhode Island Senate | Returns, likely Armed Services chairman |
Source: Military Times (November 5, 2026); Associated Press.
Fred Wellman, an Army helicopter pilot, unseated Missouri Representative Ann Wagner in what Military Times called a surprise upset. Elaine Luria beat Representative Jen Kiggans in Virginia, reversing the 2024 result between them. Retired Navy Vice Admiral Nancy Lacore led her South Carolina race by 3,300 votes, though the AP had not called it. Barry Moore won Alabama’s open Senate seat.
Alaska stayed unresolved. Marine veteran Dan Sullivan trailed former Representative Mary Peltola by 637 votes with 78% of ballots counted. If Sullivan holds on, the Senate gains a 14th veteran. Senator Jack Reed returns and is likely to chair the Armed Services Committee, and Tom Cotton and Ed Markey also return. The Senate would hold five former Army members, four Navy and one Air Force veteran, plus three or four Marines.
2026 Veteran and Military Community Survey: What Did Veterans Say Before the Midterms?
COMMON DEFENSE POLL, SEPT. 15-28 (each █ = 5%)
Left behind by government                  ████████████████ 79%
Republicans: left behind                   ██████████████ 72%
Republicans: decisions for political gain  █████████████ 63%
GOP better communicating with military     █████████ 47%
Democrats better communicating             █████ 27%
| Survey Measure | Result | Group |
|---|---|---|
| Say government and society are leaving them behind | 79% | Veterans and active duty |
| Republicans agreeing they are left behind | 72% | Republican respondents |
| Republicans saying decisions are made for political gain | 63% | Republican respondents |
| Say Republican Party communicates better with the military | 47% | All respondents |
| Say Democratic Party communicates better with the military | 27% | All respondents |
| Respondents who are Republican vs Democratic | 47% vs 35% | Party identification |
| Sample size | 731 | Change Research, online |
Source: Common Defense and Change Research survey of 731 service members, veterans and military family members (September 15-28, 2026).
The survey found 79% of veterans and active-duty respondents saying government and society are leaving them behind. Among Republicans, 72% agreed, and 63% said decisions affecting troops are made for political gain. 47% said the Republican Party communicates better with the military, against 27% for Democrats.
The sample skews older, whiter, more male and more Republican than the country. Respondents were 71% men and 71% white, one in three was 65 or older, and Republicans outnumbered Democrats 47% to 35%. Common Defense is a progressive veterans group, and Change Research ran the poll online. The sample was 731 people, so treat the results as directional and not as a national estimate of Veteran Voters Turnout in US Elections 2026.
Veteran Voters Turnout in US Elections 2026 – Frequently Asked Questions
How Did Veterans Vote in the 2026 Midterm Elections?
Veterans voted 57% Republican and 41% Democratic in the NBC News exit poll. They were 10% of voters.
What Percentage of Voters Were Veterans in 2026?
Veterans were 10% of voters in the NBC News exit poll. Nonveterans were 90%.
How Did Nonveterans Vote Compared With Veterans in 2026?
Nonveterans voted 57% Democratic and 42% Republican. Veterans voted Republican by 16 points.
What Was Veteran Voter Turnout in the 2022 Midterms?
62.7% of veteran citizens voted in 2022, against 51.3% of nonveterans, according to the Census Bureau.
What Was Veteran Voter Turnout in 2026?
No 2026 rate exists yet. The Census Bureau publishes turnout by veteran status in a voting supplement months after the election.
How Many Veterans Ran for Congress in 2026?
A record 258 veterans were on the ballot, 227 for the House and 31 for the Senate, according to With Honor Action.
Which Party Had More Veteran Candidates in 2026?
Republicans had 115, Democrats 80 and independents or third parties 63.
How Many Women Veterans Ran for Congress in 2026?
38 women veterans ran, including 21 Democrats, 8 Republicans and 9 independents. The 2024 count was 21.
How Many Veterans Will Serve in the Next Congress?
Military Times counted at least 57 confirmed on November 5, with 20 races too close to call. Another tally counted 76, including 10 holdover senators.
What Share of Congress Will Be Veterans After the 2026 Midterms?
About 15%, down from 19% and the lowest since at least the 1970s, when about 73% of members were veterans.
Which Veterans Won Notable Races in 2026?
Fred Wellman defeated Representative Ann Wagner in Missouri, Elaine Luria defeated Representative Jen Kiggans in Virginia, and Barry Moore won Alabama’s open Senate seat.
Which Veteran Races Are Still Undecided?
Dan Sullivan trailed Mary Peltola by 637 votes in Alaska with 78% counted. Nancy Lacore led South Carolina’s House race by 3,300 votes without an AP call.
How Many Veterans Are There in the United States?
The Bureau of Labor Statistics counted 18.4 million veterans in 2022.
Do Americans Trust Veterans in Elected Office?
77% of Americans trust people with military experience to perform well as elected officials, according to Gallup and With Honor Action.
How Many Veteran Senators Will Serve After 2026?
At least 13: five Army, four Navy, three Marines and one Air Force veteran. A 14th is possible if Dan Sullivan holds Alaska.
What Share of Veterans Voted in 2022 Compared With Nonveterans?
62.7% of veterans voted, against 51.3% of nonveterans. The gap was 11.4 points.
How Did Women Veterans Vote in Past Midterms?
In 2018, AP VoteCast found 58% of female veterans disapproved of President Trump, close to 61% of women overall.
How Much Did Veteran Candidates Increase From 2022 to 2026?
Veteran candidates rose from 195 in 2022 to 258 in 2026, an increase of 63 candidates, or 32%.
Are the 2026 Veteran Election Figures Final?
No. Several races are uncalled, exit poll weights can change, and state certification takes weeks.
Disclaimer: This research report is compiled from publicly available sources. While reasonable efforts have been made to ensure accuracy, no representation or warranty, express or implied, is given as to the completeness or reliability of the information. We accept no liability for any errors, omissions, losses, or damages of any kind arising from the use of this report.