What Is the Strait of Hormuz?
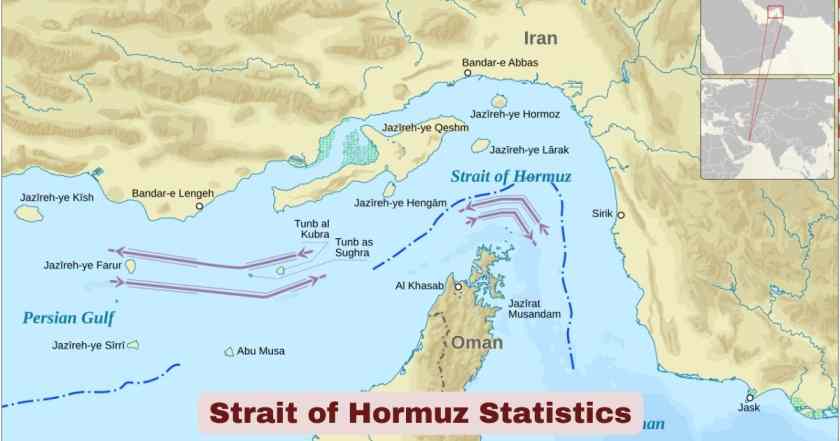
The Strait of Hormuz is one of the most strategically significant and geopolitically charged waterways on the face of the earth. Positioned between the Islamic Republic of Iran to the north and the Sultanate of Oman and the United Arab Emirates to the south, this narrow maritime passage links the Persian Gulf to the Gulf of Oman and, ultimately, to the Arabian Sea. At its tightest navigable point, the strait stretches just 21 nautical miles (approximately 34–39 kilometres) across, yet through this impossibly slender corridor passes a volume of oil and liquefied natural gas that keeps modern industrial civilisation running. It is not a regional waterway in any meaningful sense — it is the jugular vein of the global energy system, and any disruption to it instantly registers across every oil futures exchange, insurance market, and economic planning desk in the world.
What makes the Strait of Hormuz genuinely irreplaceable in the architecture of global trade is the extraordinary concentration of petroleum-exporting nations that depend on it as their only realistic export corridor. Saudi Arabia, Iraq, Kuwait, the UAE, Qatar, Bahrain, and Iran — together, some of the heaviest hydrocarbon producers on the planet — funnel the overwhelming majority of their crude oil, condensate, petroleum products, and liquefied natural gas through this single passage. As of 2025–2026, the strait handled an average of 20 million barrels of oil per day (mb/d), representing approximately 20% of global petroleum liquids consumption and close to 25–27% of the world’s total seaborne oil trade. With an ongoing 2026 geopolitical crisis — including military conflict that triggered a near-total collapse of tanker traffic beginning 28 February 2026 — the Strait of Hormuz statistics 2026 have become more consequential than at any point in the waterway’s modern history.
Interesting Facts About the Strait of Hormuz 2026
| Fact | Detail |
|---|---|
| Location | Between Iran (north) and Oman/UAE (south) |
| Narrowest Width | 21 nautical miles (34–39 km) at its tightest navigable point |
| Navigable Shipping Channels | Two lanes, each 2 nautical miles wide, separated by a 2-nautical-mile buffer zone |
| Daily Oil Throughput (2025 full year) | Average ~20 million barrels per day (mb/d) |
| Daily Oil Throughput (H1 2025) | ~20.9 mb/d |
| Share of Global Petroleum Liquids Consumption | ~20% |
| Share of Global Seaborne Oil Trade | More than 25% — over one-quarter of all seaborne oil |
| Share of Global LNG Trade (2025) | ~19–20% — over 112 billion cubic metres (bcm) annually |
| Daily Vessel Transits (2026) | Approximately 100 cargo-carrying vessels per day |
| Tanker & Gas Carrier Share of Transits | 60–70% of all transiting vessels are oil tankers or gas carriers |
| Asian Market Dependence — Crude Oil | ~84–89% of all crude oil and condensate flows destined for Asia |
| Asian Market Dependence — LNG | ~83% of all LNG flows destined for Asian markets |
| Qatar LNG Transit Dependency | ~93% of Qatar’s LNG exports transit the strait |
| UAE LNG Transit Dependency | ~96% of UAE LNG exports transit the strait |
| Combined Qatar + UAE Share of Global LNG Trade | Nearly 20% of global LNG trade |
| Total Realistic Bypass Capacity (Saudi + UAE pipelines) | Only ~3.5–5.5 mb/d — covers roughly 17–27% of normal Hormuz flow |
| Global Oil Production (early 2026) | Nearly 108 mb/d — Hormuz carries ~20% of that total |
| US Naval Presence | US Fifth Fleet headquartered in Bahrain |
| Legal Status | International strait under UNCLOS — transit passage rights apply |
| Water Depth | Approximately 60–100 metres |
Source: U.S. Energy Information Administration (EIA); International Energy Agency (IEA) February 2026 Strait of Hormuz Factsheet; Lloyd’s List Intelligence; MUFG Americas (February 2026); Visual Capitalist/EIA/Vortexa 2025–2026 data
The raw facts about the Strait of Hormuz paint a picture of almost surreal geographic concentration. The entire navigable corridor consists of just two 2-nautical-mile-wide shipping lanes — one inbound, one outbound — meaning that the crude oil, condensate, petroleum products, and liquefied natural gas that power the factories, vehicles, and power grids of Asia, Europe, and beyond are funnelled through a combined navigable width of just 4 nautical miles. As of 2026, approximately 100 cargo-carrying vessels transit the strait every single day, with 60–70% of those being oil tankers or LNG carriers. This level of traffic density through such a geographically constrained passage has no equivalent anywhere in global energy infrastructure.
The absence of a viable, full-scale alternative route makes these facts even more stark from an energy security standpoint. While Saudi Arabia’s East-West Petroline and the UAE’s Abu Dhabi Crude Oil Pipeline (ADCOP) offer partial bypass capacity, the IEA estimates that combined available bypass capacity stands at only 3.5–5.5 mb/d — a figure that covers barely a quarter to a third of the strait’s average daily throughput. Countries such as Iraq, Kuwait, Qatar, Bahrain, and Iran have no meaningful pipeline alternatives whatsoever, meaning their entire export revenues are entirely hostage to the continued free navigation of this single, narrow passage. With global oil production running at nearly 108 mb/d in early 2026, the Hormuz chokepoint carries approximately one barrel in every five produced anywhere on earth.
Strait of Hormuz Oil Flow Statistics 2025–2026
| Metric | Data |
|---|---|
| Average Daily Oil Flow — Full Year 2024 | ~20 mb/d (crude oil + petroleum products) |
| Average Daily Oil Flow — H1 2025 | ~20.9 mb/d |
| Average Daily Oil Flow — Full Year 2025 (IEA) | ~20 mb/d |
| Share of Global Petroleum Liquids Consumption | ~20% |
| Share of Global Seaborne Oil Trade | >25% (more than one-quarter) |
| Crude Oil + Condensate as Share of Global Crude Trade (2025 per IEA) | ~34% of global crude oil trade |
| Crude Oil Specifically (2025 per IEA) | ~15 mb/d of crude oil |
| Crude + Condensate Volume Change 2022–2024 | Declined ~1.6 mb/d, partially offset by +0.5 mb/d in petroleum products |
| Global Petroleum Liquids Demand (early 2026) | Above 103 mb/d (IEA February 2026 Oil Market Report) |
| Q1 2025 vs 2024 — Flow Comparison | Remained relatively flat — no significant change from 2024 levels |
| 2026 Crisis — Tanker Traffic Drop | Fell approximately ~70% after 28 February 2026 hostilities |
| Vessels Anchored Outside Strait | Over 150 ships anchored offshore to avoid conflict risks |
| Brent Crude Peak — 2026 Crisis | Rose to as high as US$126 per barrel |
| Date $100/bbl Threshold Crossed | 8 March 2026 — first time in four years |
| Brent Crude % Rise Through 6 March 2026 | +27% |
Source: U.S. Energy Information Administration (EIA) Today in Energy June 2025; International Energy Agency (IEA) February 2026 Factsheet & March 2026 Middle East Energy Report; Vortexa and Kpler tanker tracking; Wikipedia — 2026 Strait of Hormuz Crisis
The Strait of Hormuz oil flow statistics for the 2025–2026 period confirm the waterway’s status as the single most volumetrically significant energy chokepoint on the planet. The IEA’s full-year 2025 data shows that 20 mb/d of crude oil and petroleum products transited the strait — a figure that is both enormous in absolute terms and highly concentrated geographically. The EIA’s H1 2025 estimate of 20.9 mb/d confirms flows held broadly steady despite ongoing OPEC+ production management. The IEA’s February 2026 Factsheet further specifies that ~15 mb/d of crude oil specifically transited the strait in 2025, representing ~34% of global crude oil trade — a figure that underscores just how dominant the Gulf’s crude exports are in the international marketplace. Against a backdrop of global petroleum demand exceeding 103 mb/d in early 2026, the strait’s ~20% share of total consumption has remained a remarkably stable proportion across recent years.
The 2026 Strait of Hormuz crisis, which erupted following joint US-Israeli strikes on Iran beginning 28 February 2026, dramatically illustrated the real-world consequences embedded in these numbers. Tanker traffic through the corridor plunged by approximately 70% in the immediate aftermath, with over 150 vessels anchoring offshore. Brent crude prices surged toward $126 per barrel at their peak, and the $100/barrel threshold was crossed on 8 March 2026 for the first time in four years — psychologically significant for energy markets globally. The episode proved what analysts had long theorised: even a partial disruption of Strait of Hormuz oil flows translates almost instantaneously into price spikes that reach every economy on earth, whether they import Gulf oil directly or not.
Strait of Hormuz Crude Oil Exporters by Country 2025 | Q1 2025 Data
| Exporting Country | Share of Total Hormuz Crude & Condensate Flows (Q1 2025) |
|---|---|
| Saudi Arabia | 37.2% |
| Iraq | 22.8% |
| United Arab Emirates (UAE) | 12.9% |
| Iran | 10.6% |
| Kuwait | 10.1% |
| Others | ~6.4% |
| Top 5 Combined | 93.6% of all Hormuz crude and condensate volumes |
Source: U.S. Energy Information Administration (EIA), Q1 2025 data based on Vortexa tanker tracking; Visual Capitalist “Oil Trade Through the Strait of Hormuz by Country” — March 2026
The crude oil exporter breakdown for the Strait of Hormuz in 2025 reveals a concentration of supply that is extraordinary even by the standards of global commodity markets. Saudi Arabia alone accounts for 37.2% of all crude oil and condensate transiting the waterway — the single largest share by a wide margin, consistent with the full-year 2024 figure of 38% (5.5 mb/d) reported by the EIA. Iraq at 22.8% and the UAE at 12.9% together add a further 35.7 percentage points, meaning just three countries account for nearly three-quarters of all crude and condensate volumes transiting the strait. The top five nations — Saudi Arabia, Iraq, UAE, Iran, and Kuwait — together control 93.6% of total Hormuz crude flows, leaving a negligible residual from all other producers combined.
What this extreme concentration means from a supply security standpoint is severe. Unlike other major maritime chokepoints that carry diverse cargo from dozens of nations, the Strait of Hormuz is essentially a dedicated export corridor for a very small and geopolitically interconnected club of petroleum producers. Iraq, Kuwait, Qatar, Bahrain, and Iran have no meaningful pipeline bypass infrastructure, meaning they are structurally unable to redirect their volumes even in the event of a prolonged strait closure. For Iraq in particular — the second-largest contributor at 22.8% — the strait is the only viable door through which its petroleum revenues exit the country. Any disruption to the waterway directly threatens the fiscal stability of governments whose budgets are almost entirely funded by oil export revenues.
Strait of Hormuz Crude Oil Import Destinations 2025 | Where Does Hormuz Oil Go?
| Destination Country / Region | Share of Hormuz Crude & Condensate Flows (Q1 2025) |
|---|---|
| China | 37.7% |
| India | 14.7% |
| South Korea | 12.0% |
| Japan | 10.9% |
| Other Asian Countries | 13.9% |
| Total Asia | ~89.2% |
| United States | 2.5% |
| Europe & Other | ~8.3% |
Source: U.S. Energy Information Administration (EIA), Q1 2025 — Visual Capitalist “Oil Trade Through the Strait of Hormuz by Country” March 2026; IEA 2025 Kpler-based analysis confirming ~90% destined for Asian markets
The destination data for Strait of Hormuz crude oil in 2025 makes the Asian dependency case with complete clarity. China alone receives 37.7% of all crude oil and condensate transiting the waterway — more than the next three largest recipients combined. China’s reliance is compounded by the fact that roughly half of its more than 11 mb/d import bill is sourced from the Middle East, as data published in early 2026 confirms. India at 14.7% and South Korea at 12.0% add further weight to the Asia-Pacific concentration, with Japan at 10.9% rounding out the four dominant Asian importers. Together, these four nations account for approximately 75.3% of all Hormuz crude and condensate flows. Including all other Asian nations brings the regional total to approximately 89–90% — a figure confirmed by both the EIA and the IEA for the 2025 period.
By contrast, the United States receives just 2.5% of Hormuz crude flows as of Q1 2025, reflecting America’s dramatic increase in domestic crude production over the past decade. For Asian economies, however, the dependency is structural. Japan derives approximately 95% of its crude imports from Middle Eastern suppliers, with around 70% of that Middle Eastern crude arriving via the strait specifically. South Korea channels approximately 68% of its crude imports through Hormuz, and both countries’ industrial and power-generation sectors have limited short-term substitution options. Bangladesh, India, and Pakistan together imported almost two-thirds of their total LNG supplies via the strait in 2025 — making them especially vulnerable to any disruption, given that natural gas dominates their power generation sectors.
Strait of Hormuz LNG Trade Statistics 2025–2026
| LNG Metric | Data |
|---|---|
| Total LNG Transiting Strait — Full Year 2025 | Just over 112 billion cubic metres (bcm) |
| Share of Global LNG Trade | ~19–20% |
| Qatar Total LNG Exports (2025) | Over 112 bcm — world’s second-largest LNG exporter |
| UAE Total LNG Exports (2025) | ~7 bcm |
| Qatar LNG Transit Share via Strait | ~93% of Qatar’s LNG exports |
| UAE LNG Transit Share via Strait | ~96% of UAE LNG exports |
| Qatar + UAE LNG to Kuwait (piped, exempt) | ~7 bcm in 2025 — only LNG flows not transiting strait |
| LNG Destined for Asian Markets | ~83% of all LNG transiting strait |
| LNG’s Share of Asia’s Total LNG Imports | Strait LNG = ~27% of Asia’s total LNG imports (2025) |
| Europe LNG Dependence on Strait | ~7% of Europe’s total LNG inflows (2025) |
| Europe LNG from Qatar (direct) | 12–14% of Europe’s LNG from Qatar |
| Bangladesh, India, Pakistan LNG via Strait | Almost two-thirds of their combined total LNG supply |
| Dolphin Pipeline Capacity (Qatar → UAE/Oman) | ~20.5 bcm/year in 2025; limited spare capacity |
| Alternative LNG Export Route (Qatar/UAE) | None — no pipeline or seaborne alternative to global market |
| LNG Tanker Daily Freight Rate (27 Feb 2026) | Over $200,000/day — VLCC Middle East to China |
| LNG Tanker Freight Spike (3 March 2026) | >40% in a single day after Qatar production halt |
| Dutch TTF Gas Price Rise (through 6 March 2026) | Nearly 70% |
Source: International Energy Agency (IEA) February 2026 Strait of Hormuz Factsheet; IEA Middle East and Global Energy Markets Report March 2026; EIA Today in Energy 2025; Logistics Middle East (February 2026); TIME Magazine March 2026
The LNG trade statistics for the Strait of Hormuz in 2025 reveal a structural dependency that is, in some critical respects, even more acute than the oil dependency. While crude oil has pipeline bypass options and a broader global production base, liquefied natural gas from Qatar and the UAE has literally zero alternative export routes to the global seaborne LNG market. The IEA’s February 2026 Strait of Hormuz Factsheet states this plainly: there are no operational pipelines that can redirect Qatari or Emirati LNG to global markets if the strait is closed. The Dolphin pipeline carries piped gas to the UAE and Oman at approximately 20.5 bcm/year but operates close to full capacity with minimal spare headroom, and it serves regional markets, not global ones. Qatar’s Ras Laffan Industrial City — the world’s largest LNG production facility — is entirely dependent on strait access. With over 112 bcm of LNG transiting the corridor in 2025 and representing ~20% of global LNG trade, the stakes for global gas markets are existential.
The 2026 crisis made these vulnerabilities viscerally real. Following attacks on QatarEnergy’s facilities at Ras Laffan and Mesaieed on 2 March 2026, Qatar halted LNG production and declared Force Majeure on gas contracts on 4 March 2026. Dutch TTF natural gas prices spiked nearly 70% through 6 March 2026, and LNG tanker daily freight rates jumped over 40% in a single trading session. Europe, which sources 12–14% of its LNG from Qatar, faced the prospect of competing for scarce spot cargoes at massively elevated prices. The IEA estimates that a full strait closure would drop global LNG supply by over 300 million cubic metres per day — double the average throughput of the Nord Stream pipeline — a shortfall that no combination of alternative suppliers could replace at short notice. The Strait of Hormuz LNG statistics 2026 reveal an energy system with a single point of failure for a fifth of global gas trade.
Strait of Hormuz Alternative Bypass Pipeline Infrastructure 2025–2026
| Bypass Route | Owner | Design / Reported Capacity | Estimated Available Spare Capacity (early 2026) |
|---|---|---|---|
| Saudi East-West Petroline (Abqaiq–Yanbu) | Saudi Aramco | 5 mb/d design; reported 7 mb/d after March 2025 upgrade | ~3–5 mb/d spare; ~2 mb/d currently utilised |
| UAE Abu Dhabi Crude Oil Pipeline — ADCOP (Habshan–Fujairah, 400 km) | ADNOC | 1.5 mb/d | Partial spare; combined Saudi + UAE realistic spare = ~2.6 mb/d (EIA) or 3.5–5.5 mb/d (IEA range) |
| Iran Goreh–Jask Pipeline | NIOC | Reported 1 mb/d; effective ~0.3 mb/d | Effectively dormant — no cargoes loaded after September 2024 |
| Total Bypass (Saudi + UAE — realistic) | — | — | ~3.5–5.5 mb/d — covers only ~17–27% of average 20 mb/d Hormuz flow |
| Iraq bypass | — | None operational | Zero |
| Kuwait bypass | — | None operational | Zero |
| Qatar LNG bypass | — | None to global market | Zero |
| Bahrain bypass | — | None operational | Zero |
Source: EIA World Oil Transit Chokepoints (2025 update); IEA Strait of Hormuz Factsheet February 2026; EIA Today in Energy June 2025
The bypass infrastructure reality surrounding the Strait of Hormuz in 2026 is one of the defining structural vulnerabilities in global energy. Saudi Arabia’s East-West Petroline is the most significant bypass asset. In March 2025, Saudi Aramco reported increasing the system’s capacity to 7 mb/d from its original 5 mb/d design capacity — a notable upgrade, though the IEA explicitly notes that sustainable flows at 7 mb/d have not been tested at scale. As of early 2026, the IEA estimates that approximately 2 mb/d of the pipeline’s capacity is currently utilised, leaving between 3 and 5 mb/d of spare capacity — depending on operational conditions and available export capacity at West Coast terminals in Yanbu. The UAE’s ADCOP pipeline adds further capacity, running 400 km from Habshan to Fujairah entirely outside the strait, offering additional rerouting potential for Abu Dhabi’s onshore crude.
Yet stacking these bypass numbers against the ~20 mb/d that normally transits the strait exposes the fundamental gap immediately. Even at the top of the IEA’s 3.5–5.5 mb/d bypass range, available rerouting capacity covers only roughly 17–27% of normal Hormuz flow. The remaining ~14–17 mb/d has no alternative route whatsoever. Iraq, Kuwait, Qatar, Bahrain, and Iran maintain zero operational bypass infrastructure, leaving close to 14 million barrels per day structurally tied to a single maritime passage — a concentration unique in modern energy logistics. This structural gap between bypass capacity and total Hormuz throughput is precisely why the waterway’s status sits at the centre of every credible energy security scenario, national strategic petroleum reserve calculation, and global oil price model in existence.
Strait of Hormuz vs Other Global Oil Chokepoints 2025 | Comparison Statistics
| Chokepoint | Location | Daily Oil Flow (H1 2025) | Share of Global Maritime Oil Trade |
|---|---|---|---|
| Strait of Malacca | Malaysia / Indonesia | ~23.2 mb/d | ~29.1% |
| Strait of Hormuz | Iran / Oman | ~20.9 mb/d | ~25–27% |
| Cape of Good Hope | South Africa | ~9.1 mb/d | Diversionary alternative route |
| Suez Canal + SUMED Pipeline | Egypt | ~4.9 mb/d | ~6% |
| Danish Straits | Denmark | ~4.9 mb/d | ~6% |
| Bab el-Mandeb Strait | Yemen / Djibouti | ~4.2 mb/d | ~5% |
| Turkish Straits (Bosphorus) | Turkey | ~3.7 mb/d | ~5% |
| Panama Canal | Panama | ~2.3 mb/d | ~3% |
| Total — All Major Chokepoints Combined | — | ~73 mb/d | Majority of global seaborne oil |
Source: U.S. Energy Information Administration (EIA) H1 2025 data; Visual Capitalist — “Mapped: The World’s Oil Chokepoints” (published March 2026)
Viewed within the full landscape of global oil transit chokepoints, the Strait of Hormuz stands in a category of its own for concentrated geopolitical risk — even though the Strait of Malacca edges it in raw daily volume at 23.2 mb/d in H1 2025. The key distinction is the nature and replaceability of the cargo. The Malacca strait carries oil from a broad mix of origins, and vessels can in theory divert via the Lombok or Sunda Straits at additional cost and time. The Strait of Hormuz, by contrast, is the exit door for a very specific and irreplaceable set of exporters — Gulf OPEC+ nations that collectively hold the majority of the world’s recoverable petroleum reserves and the majority of OPEC’s spare production capacity. There is no equivalent rerouting option for this cargo.
The comparison also highlights how uniquely dominant the Strait of Hormuz is in the LNG context specifically. No other chokepoint on this table carries anything approaching ~20% of global LNG trade — the Bab el-Mandeb, Suez Canal, and Malacca combined do not approach that figure for gas. The Cape of Good Hope at ~9.1 mb/d serves primarily as an emergency rerouting path for oil tankers diverted from Red Sea disruptions, but it cannot solve the LNG problem at all, since there is no alternative seaborne route for Qatari gas. This asymmetry — limited oil bypass at significant cost versus zero LNG bypass — is the defining structural vulnerability that makes the Strait of Hormuz statistics 2026 uniquely consequential in the global energy security landscape. Any analyst, government, or market participant who underestimates this concentration is working with an incomplete picture of the global energy system’s most critical fragility.
Strait of Hormuz Geopolitical Risk & Shipping Statistics 2026
| Metric | Data |
|---|---|
| 2026 Crisis Trigger | Joint US-Israel military strikes on Iran — 28 February 2026 |
| IRGC Closure Announcement | 2 March 2026 — IRGC officially confirmed strait closed to Western-aligned shipping |
| Tanker Traffic Decline | Approximately ~70% drop in transit activity; traffic eventually approached near-zero |
| Vessels Anchored Outside Strait | Over 150 ships anchored off Oman and UAE coast |
| Brent Crude Peak Price | Up to US$126 per barrel |
| Date $100/bbl Crossed | 8 March 2026 — first time in four years |
| Brent Crude % Rise Through 6 March 2026 | +27% |
| Dutch TTF Gas Price Rise (through 6 March 2026) | ~+70% |
| LNG Tanker Freight Rate Spike (3 March 2026) | >40% in a single session following Qatar’s production halt |
| VLCC Daily Freight Rate (27 Feb 2026) | Over $200,000/day (Middle East to China) |
| Major Shippers Suspended Operations | Maersk, Hapag-Lloyd, MSC, CMA CGM — all suspended transits |
| War Risk Insurance | P&I coverage withdrawn effective 5 March 2026 — strait declared high-risk zone |
| Iran-China Special Arrangement | Iran permitted Chinese-flagged vessels from 4–5 March 2026 |
| Qatar Force Majeure Declaration | 4 March 2026 — QatarEnergy declared force majeure on gas contracts |
| Japan Crude via Hormuz | ~70% of Japan’s Middle Eastern crude; 95% of all crude from Middle East |
| South Korea Crude via Hormuz | Approximately 68% of crude imports |
| China’s Middle East Import Exposure | ~14% of total crude from Saudi Arabia; ~7% from UAE (as of 2025) |
| Historical Precedent | Iran had never fully closed the strait in its modern history — prior to 2026 |
Source: Wikipedia — 2026 Strait of Hormuz Crisis (updated March 10, 2026); IEA Middle East and Global Energy Markets Report March 2026; Atlas Institute for International Affairs 2026; Times of Israel; Al Jazeera (February 2026); MUFG Americas February 2026; TIME Magazine March 2026
The 2026 Strait of Hormuz geopolitical crisis represents the most acute real-world stress test the waterway has ever experienced in the modern era. For decades, Iran repeatedly threatened to close the strait as a geopolitical bargaining chip — particularly during periods of heightened tension with the United States over nuclear negotiations — but had never followed through at any meaningful scale. The joint US-Israeli strikes on Iran beginning 28 February 2026 fundamentally changed that calculus. The IRGC declared the strait closed to Western-aligned shipping on 2 March 2026, and maritime traffic effectively collapsed. Over 150 tankers anchored in waters off Oman and the UAE rather than risk transit, and the four largest global container and tanker operators — Maersk, Hapag-Lloyd, MSC, and CMA CGM — suspended operations in the area. War risk insurance was effectively withdrawn by 5 March 2026, making commercial transit economically impossible for most operators regardless of their willingness to proceed.
The price consequences were immediate and severe across multiple energy markets simultaneously. Brent crude rose 27% through 6 March 2026, reaching as high as US$126 per barrel. Dutch TTF natural gas prices spiked nearly 70% following the attacks on QatarEnergy’s Ras Laffan and Mesaieed facilities on 2 March and the subsequent force majeure declaration on 4 March. LNG tanker freight rates jumped over 40% in a single trading session. For Japan — which sources 95% of its crude from the Middle East and routes ~70% of that through the strait — and for South Korea, which channels approximately 68% of its crude imports through the passage, the crisis translated directly into emergency procurement planning and government reserve releases. The Strait of Hormuz statistics 2026 have therefore been elevated from a background energy security concern to a live, front-page global economic crisis — one that has reshaped how governments, energy companies, and financial markets price geopolitical risk in the Persian Gulf region.
Disclaimer: This research report is compiled from publicly available sources. While reasonable efforts have been made to ensure accuracy, no representation or warranty, express or implied, is given as to the completeness or reliability of the information. We accept no liability for any errors, omissions, losses, or damages of any kind arising from the use of this report.