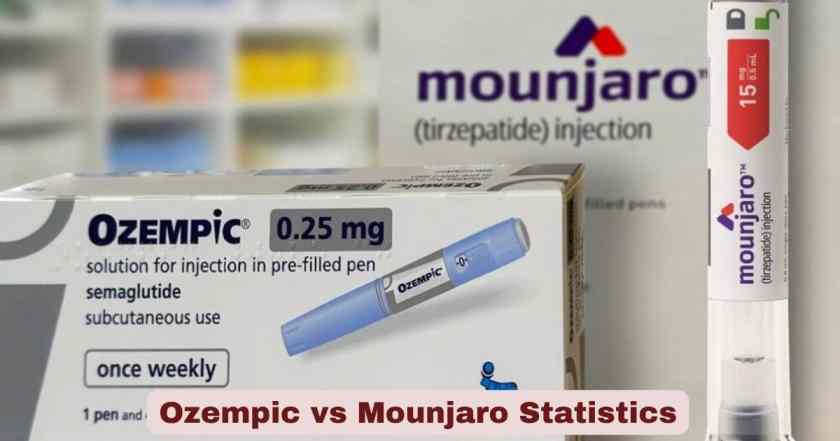
What are Ozempic and Mounjaro?
Ozempic and Mounjaro are two of the most prescribed and most talked-about drugs in the United States today, and in 2026, their combined dominance over the pharmaceutical market is unlike anything the industry has seen in modern history. Ozempic (semaglutide) is a once-weekly injectable GLP-1 receptor agonist manufactured by Danish pharmaceutical giant Novo Nordisk. Originally FDA-approved in December 2017 for Type 2 diabetes management, it works by mimicking the GLP-1 hormone to regulate blood sugar, slow gastric emptying, and suppress appetite. Mounjaro (tirzepatide) is Eli Lilly’s answer — a dual GIP and GLP-1 receptor agonist that received FDA approval in May 2022 for Type 2 diabetes, and which targets two hormonal pathways simultaneously, giving it a mechanistic edge that clinical trials have consistently translated into superior weight loss outcomes. Neither drug is FDA-approved under its diabetes brand name for weight loss, though both are widely prescribed off-label for that purpose — their weight-loss counterparts, Wegovy (semaglutide) and Zepbound (tirzepatide), carry formal obesity indications.
What makes the Ozempic vs Mounjaro story so compelling in 2026 is not just the science — it is the speed and scale of adoption. These two drugs, along with their sibling formulations, have collectively generated over $40 billion in combined sales in 2024 alone, reshaped prescribing behavior across every medical specialty, sparked a cultural conversation about obesity, metabolic health, and access to care, and triggered supply chain crises that temporarily left millions of patients unable to fill their prescriptions. As of Q1 2025, more than 11 million unique patients in the United States were using a GLP-1 medication, and that number continues to climb. Understanding the latest Ozempic vs Mounjaro statistics 2026 — across market share, user demographics, clinical efficacy, safety profiles, cost, and prescription growth — is essential for anyone navigating this rapidly evolving pharmaceutical landscape.
Interesting Key Facts — Ozempic vs Mounjaro in the US 2026
The table below draws exclusively from verified pharmaceutical sales data, FDA records, peer-reviewed clinical trials, CDC surveys, KFF polling, IQVIA market intelligence, and earnings reports from Novo Nordisk and Eli Lilly. Every figure has a traceable institutional source.
| Fact | Ozempic (Semaglutide) | Mounjaro (Tirzepatide) |
|---|---|---|
| Manufacturer | Novo Nordisk (Denmark) | Eli Lilly (United States) |
| Active ingredient | Semaglutide | Tirzepatide |
| FDA approval (diabetes) | December 2017 | May 2022 |
| Mechanism of action | GLP-1 receptor agonist only | Dual GIP + GLP-1 receptor agonist |
| Average weight loss (clinical trials) | ~14.9% of body weight | ~20.9% of body weight |
| Full-year 2024 global sales | $17.47 billion | $11.54 billion |
| Year-over-year sales growth (2024) | +26% | +124% |
| GLP-1 market share | 31.5% (largest single brand) | 23.4% |
| U.S. adults who have ever used a GLP-1 drug | 12% (~31 million adults) | (combined GLP-1 figure) |
| U.S. adults currently using a GLP-1 drug | 6% (~15+ million adults) | (combined GLP-1 figure) |
| Unique U.S. GLP-1 patients (Q2 2025) | 11 million (all GLP-1 brands combined) | (combined figure) |
| Adults with diabetes using GLP-1 injectables (2024) | 26.5% of diagnosed diabetics | (combined GLP-1 figure) |
| Ozempic prescription growth (2019–2024) | +1,504% (semaglutide Rx growth) | 0% in 2019–2021; launched 2022 |
| Patients achieving ≥5% weight loss | 66.5% of patients | 81.8% of patients |
| Patients achieving ≥10% weight loss | Baseline | 2.5x more likely vs. Ozempic |
| Patients achieving ≥15% weight loss | Baseline | 3.2x more likely vs. Ozempic |
| Average monthly list price (2025, US) | ~$1,384 without insurance | ~$1,493 without insurance |
| Manufacturer savings program price | ~$25/month eligible patients | ~$25/month eligible patients |
| Most common side effect | Nausea (16–20% of patients) | Nausea (12–18% of patients) |
| GI discontinuation rate | 3.1–3.8% | 4–10% |
| FDA additional approval (2025) | Kidney disease risk reduction (Jan 2025) | SURPASS-CVOT non-inferior CV data (July 2025) |
| Cumulative U.S. revenue through end of 2024 | ~$35.5 billion (Ozempic alone) | Part of combined $71B GLP-1 total (both companies) |
| Combined GLP-1 sales forecast by 2030 | $400+ billion additional U.S. revenue projected | (combined Novo + Lilly forecast) |
| GLP-1 prescription volume, Q4 2022 | 9 million prescriptions written in Q4 2022 (all GLP-1 brands) | — |
| GLP-1 prescription volume, end of 2024 | Surpassed 9 million prescriptions per month | — |
Data Sources: Novo Nordisk and Eli Lilly Annual Reports 2024; IQVIA Anti-Obesity Market Deep Dive, September 2025; KFF Health Tracking Poll May 2024; CDC National Health Interview Survey 2024 (Data Brief No. 537); FAIR Health White Paper on Obesity and GLP-1 Drugs 2025; Visual Capitalist GLP-1 Market Analysis 2025; FDA Drug Approvals Database
The numbers in the table above tell a story of two pharmaceutical giants engaged in a race with no historical precedent. Ozempic still holds the largest single-brand market share in the GLP-1 space at 31.5%, backed by its seven-year head start and the sheer brand recognition that has made “Ozempic” a household name synonymous with the entire drug class. Its $17.47 billion in 2024 global sales remains the gold standard for individual drug revenue in this category. But Mounjaro’s trajectory is arguably the more dramatic story: launching in 2022 with zero revenue to its name, it crossed $11.54 billion in 2024 global sales, posting a 124% year-over-year growth rate that few drugs of any kind have ever matched. The 1,504% growth in semaglutide prescriptions between 2019 and 2024 illustrates just how quickly the GLP-1 market scaled — and Mounjaro’s even steeper launch curve arrived into an already-primed market that had been conditioned by Ozempic’s success.
The clinical comparison between the two drugs is equally stark. In head-to-head and real-world data, Mounjaro patients are 3.2 times more likely to achieve 15% weight loss compared to Ozempic users, and its average clinical trial weight loss of 20.9% versus Ozempic’s 14.9% reflects the advantage of targeting two hormonal pathways instead of one. But Ozempic’s established cardiovascular protection data — including its 2024 FDA approval for cardiovascular risk reduction and its January 2025 approval for kidney disease risk reduction — gives it clear advantages for patients with complex comorbidities. For the 26.5% of U.S. diabetic adults now using GLP-1 injectables, the choice between these two drugs is not purely about weight loss — it is a clinical decision shaped by individual medical history, tolerance, and access.
Ozempic vs Mounjaro Market Share in the US 2026
The GLP-1 drug market is one of the most concentrated in all of pharmaceuticals — two companies control virtually the entire category, and their individual brands compete directly for the same patient population. The data below reflects reported and analyzed market share figures for the most recent available period.
| Brand | Company | Active Ingredient | Indication | Market Share | 2024 Global Sales |
|---|---|---|---|---|---|
| Ozempic | Novo Nordisk | Semaglutide | Type 2 Diabetes | 31.5% | $17.47 billion |
| Mounjaro | Eli Lilly | Tirzepatide | Type 2 Diabetes | 23.4% | $11.54 billion |
| Wegovy | Novo Nordisk | Semaglutide | Obesity/Weight Loss | 16.5% | $8.45 billion |
| Zepbound | Eli Lilly | Tirzepatide | Obesity/Weight Loss | 11.6% | $4.92 billion |
| Rybelsus | Novo Nordisk | Semaglutide (oral) | Type 2 Diabetes | 6.0% | $3.38 billion |
| Trulicity | Eli Lilly | Dulaglutide | Type 2 Diabetes | 8.4% | Declining |
| Saxenda | Novo Nordisk | Liraglutide | Obesity | 1.6% | ~$1.01 billion |
Data Sources: Visual Capitalist GLP-1 Market Analysis, August 2025; Novo Nordisk Annual Report 2024; Eli Lilly Annual Report 2024; Huateng Pharmaceutical GLP-1 Sales Analysis, February 2025
The GLP-1 market’s concentration is extraordinary by any measure. Novo Nordisk’s combined semaglutide portfolio (Ozempic + Wegovy + Rybelsus + Saxenda) accounts for approximately 55.6% of the total GLP-1 market, while Eli Lilly’s tirzepatide franchise (Mounjaro + Zepbound + Trulicity) commands the remaining share — meaning just two companies hold essentially 100% of a market that generated over $58 billion in combined annual sales. Ozempic alone, with its 31.5% market share, outpaces every competitor and continues to generate the single largest revenue figure in the space. However, the growth vectors tell a different story: Mounjaro’s 124% year-over-year revenue growth in 2024 and Zepbound’s 2,684% growth in its first full year dwarf Ozempic’s comparatively steady 26% growth rate.
What the market share numbers also reveal is a structural shift in how patients are entering the GLP-1 market. While Ozempic and Mounjaro serve the diabetes indication and are widely prescribed off-label for weight loss, Wegovy and Zepbound are absorbing a growing portion of new-start patients entering for obesity treatment specifically. The cumulative $71 billion in U.S. revenue generated by all four major GLP-1 brands through end of 2024 — with projections of $400 billion in additional U.S. revenue from 2025 to 2030 — signals that the market is still in early innings despite already achieving a scale that makes it one of the most valuable drug categories ever created.
Ozempic vs Mounjaro Prescription & User Statistics in the US 2026
Raw prescription volumes and active user figures provide the clearest picture of how deeply Ozempic and Mounjaro have penetrated the American healthcare system.
| Metric | Statistic | Year / Source |
|---|---|---|
| U.S. adults who have ever used a GLP-1 drug | 12% (~31 million adults) | KFF Health Tracking Poll, May 2024 |
| U.S. adults currently using a GLP-1 drug | 6% (~15+ million adults) | KFF Health Tracking Poll, May 2024 |
| Unique U.S. GLP-1 patients (across all brands) | 11 million | IQVIA, Q2 2025 |
| GLP-1 adult users reported in 2025 (RAND survey) | 11.8% of U.S. adults | RAND American Life Panel, 2025 |
| Adults using GLP-1 for weight loss (Gallup, 2025) | 12.4% (up from 5.8% in early 2024) | Gallup Survey, Q3 2025 |
| GLP-1 prescription volume — end of 2024 | 9 million+ prescriptions per month | IQVIA |
| GLP-1 prescription volume — Q4 2022 | 9 million prescriptions (entire quarter) | CNBC / IQVIA |
| Semaglutide (Ozempic) Rx growth, 2019–2024 | +1,504% | FAIR Health White Paper 2025 |
| GLP-1 prescriptions tripled since 2020 | Confirmed 3x increase | RAND Research Report 2025 |
| U.S. diabetics using GLP-1 injectables (2024) | 26.5% of all diagnosed diabetics | CDC National Health Interview Survey 2024 |
| Women as share of weight-management GLP-1 users | ~73% of weight-loss prescriptions | KFF / Statista 2025 |
| GLP-1 use among women for weight loss (Gallup 2025) | 15.2% | Gallup Survey, Q3 2025 |
| Peak age bracket for GLP-1 use | 50–64 years (33.3% of diabetic users) | CDC NHIS 2024 |
| Adults aged 45–54 as largest user segment | Largest single demographic slice | KFF 2025 |
| Hispanic adults with diabetes using GLP-1s | 31.3% | CDC NHIS 2024 |
| White non-Hispanic adults with diabetes using GLP-1s | 26.2% | CDC NHIS 2024 |
| Asian non-Hispanic adults with diabetes using GLP-1s | 12.1% — notably lower | CDC NHIS 2024 |
Data Sources: KFF Health Tracking Poll May 2024; IQVIA Anti-Obesity Market Deep Dive September 2025; RAND American Life Panel 2025; CDC National Health Interview Survey 2024 (Data Brief No. 537); FAIR Health White Paper 2025; Gallup Health and Well-Being Index 2025
The user growth data for Ozempic, Mounjaro, and the GLP-1 class broadly is among the most dramatic in modern pharmaceutical history. The jump in monthly GLP-1 prescriptions from 9 million in all of Q4 2022 to over 9 million per month by end of 2024 represents a complete compression of the adoption curve. In just two years, what was a quarterly volume became a monthly one. 11.8% of U.S. adults reporting GLP-1 use in the 2025 RAND survey, and 12.4% using them specifically for weight loss according to Gallup’s Q3 2025 data (up from just 5.8% in early 2024), confirm that the United States is experiencing a fundamental shift in how its population approaches metabolic health treatment at a population level. The rapid acceleration from early 2024 to mid-2025 — nearly doubling the share of weight-loss GLP-1 users in roughly 18 months — shows adoption has moved well past early adopter and healthcare provider enthusiasm into mainstream consumer demand.
The demographic picture adds important nuance. Women account for approximately 73% of GLP-1 prescriptions written for weight management, reflecting both higher rates of weight-related health-seeking behavior and differential diagnosis patterns. The peak usage age of 50–64 aligns with the period in life where metabolic disease burden and cardiovascular risk converge most powerfully. Perhaps the most notable finding in the CDC’s 2024 National Health Interview Survey is the disparity in GLP-1 use by ethnicity among diabetic patients: Hispanic adults at 31.3% usage vs. Asian non-Hispanic adults at just 12.1% — a gap nearly three times as wide — pointing to access inequities, differential prescribing patterns, and cultural factors that will need targeted public health intervention if GLP-1 benefits are to be equitably distributed across America’s diverse patient population.
Ozempic vs Mounjaro Clinical Efficacy Statistics in the US 2026
The clinical comparison between Ozempic (semaglutide) and Mounjaro (tirzepatide) is now one of the most studied head-to-head questions in contemporary medicine, supported by landmark trials including SURPASS, SURMOUNT, SUSTAIN, SELECT, and the 2024 Truveta/JAMA Internal Medicine real-world study of over 18,000 patients.
| Clinical Metric | Ozempic (Semaglutide) | Mounjaro (Tirzepatide) |
|---|---|---|
| Average weight loss — clinical trials | ~14.9% of body weight | ~20.9% of body weight |
| Maximum observed weight loss (highest dose, trial) | ~15–21% (Wegovy 7.2mg dose, 72 weeks) | ~22.5% (15mg dose, SURMOUNT-1) |
| Patients achieving ≥5% weight loss | 66.5% | 81.8% |
| Likelihood of ≥10% weight loss vs. Ozempic | Baseline | 2.5x more likely |
| Likelihood of ≥15% weight loss vs. Ozempic | Baseline | 3.2x more likely |
| Average weight lost (real-world lbs) | ~13 lbs average | 17–25 lbs average |
| A1C reduction (diabetes trials) | Significant reduction | 1.8%–2.4% reduction (SURPASS trials) |
| Cardiovascular protection (FDA approved) | ✅ Yes — 20% MACE reduction (SELECT trial) | Non-inferior to dulaglutide (SURPASS-CVOT, July 2025) |
| Kidney disease risk reduction (FDA approved) | ✅ Yes — approved January 2025 | Not yet approved for this indication |
| Nausea rate | 16–20% of patients | 12–18% of patients |
| Diarrhea rate | 8.5–8.8% | 12–17% |
| Vomiting rate | ~5% | ~5% |
| Overall GI side effects | 33–36% of patients | 37–44% of patients |
| GI-related discontinuation rate | 3.1–3.8% | 4–10% |
| Truveta real-world study patients | 18,386 patients compared (JAMA Intern Med 2024) | Same dataset |
Data Sources: SURPASS-2 Trial (NEJM); SURMOUNT-1 Trial; SELECT Trial; Truveta Research / JAMA Internal Medicine July 2024; NCBI StatPearls, updated May 2025; Drugs.com Clinical Comparison, updated 2026; Nature Reviews Endocrinology, December 2025
The clinical efficacy data creates a nuanced picture that resists a simple “winner” declaration. Mounjaro’s superior weight loss outcomes — nearly 6 percentage points more average weight reduction than Ozempic, and patients being 3.2 times more likely to achieve the clinically significant 15% weight loss threshold — reflect the real pharmacological advantage of its dual GIP/GLP-1 mechanism. The landmark Truveta Research study, which used real-world data from over 18,000 overweight and obese patients who started either drug between 2022 and 2023, confirmed these advantages hold up outside of controlled trial conditions: Mounjaro patients were 1.8 times more likely to achieve 5% weight loss and 2.5 times more likely to reach 10% compared to Ozempic patients. These are not marginal differences — they are clinically meaningful thresholds that determine cardiovascular risk reduction, diabetes remission potential, and quality of life outcomes.
However, the competitive calculus shifts significantly when cardiovascular disease is part of the clinical picture. Ozempic’s SELECT trial data — showing a 20% reduction in major adverse cardiovascular events (MACE) — remains a regulatory achievement that Mounjaro has not yet replicated in an equivalent FDA-approved indication, despite its SURPASS-CVOT data from July 2025 showing non-inferior cardiovascular protection. For patients with established cardiovascular disease, clinicians frequently favor Ozempic or Wegovy precisely because the SELECT data provides explicit FDA backing for this population. As research on Mounjaro’s cardiovascular and kidney benefits continues to mature, the clinical gap may narrow further — but as of April 2026, Ozempic retains a regulatory advantage in the comorbidity space that no amount of weight-loss trial data can fully override.
Ozempic vs Mounjaro Sales Revenue Statistics in the US 2026
Revenue figures from the two companies driving this market reveal a fast-moving competitive dynamic that is reshaping pharmaceutical industry rankings globally.
| Period | Ozempic Revenue | Mounjaro Revenue | Notes |
|---|---|---|---|
| Full Year 2023 | ~$13.9 billion (global) | ~$5.2 billion (global) | Mounjaro in first full year |
| Full Year 2024 | $17.47 billion (global, +26% YoY) | $11.54 billion (global, +124% YoY) | Mounjaro crossed $10B for first time |
| Q1 2025 | ~$5.0 billion (global, +19% YoY) | $3.8 billion (global, +111% YoY) | Mounjaro gap closing rapidly |
| Q3 2025 | ~$4.3 billion (global) | $6.52 billion (global, +109% YoY) | Mounjaro surpassed Ozempic quarterly |
| Ozempic cumulative U.S. revenue through 2024 | ~$35.5 billion | — | Ozempic alone = half of combined GLP-1 U.S. total |
| Combined GLP-1 U.S. revenue (all brands) through 2024 | $71 billion total | (combined) | Both companies combined |
| Novo Nordisk total 2024 revenue | ~$42 billion | — | GLP-1s = 82% of U.S. revenue |
| Eli Lilly total 2024 revenue | — | ~$45 billion | GLP-1s = ~48% of total revenue |
| Projected combined GLP-1 U.S. revenue, 2025–2030 | $400+ billion additional | (combined) | IMAK/Wall Street consensus forecast |
Data Sources: Novo Nordisk Annual Report 2024; Eli Lilly Q3 2025 Earnings Report (PRNewswire); Healthcare Brew Q1 2025 Earnings Analysis; I-MAK GLP-1 Financial Report 2025; Huateng Pharmaceutical GLP-1 Sales Summary February 2025
The revenue trajectory of Mounjaro relative to Ozempic is one of the most compelling financial stories in pharmaceutical history. In Q3 2025, Mounjaro generated $6.52 billion in quarterly revenue — surpassing Ozempic’s ~$4.3 billion for the same period, representing a 109% year-over-year increase for tirzepatide. This was the moment the competitive dynamic visibly shifted: for most of the GLP-1 era, Ozempic had been the undisputed top revenue generator in the category. The Q3 2025 quarterly crossover signals that Mounjaro, despite its later market entry, has achieved a scale that now exceeds its rival in current-period revenue terms. The total $71 billion in cumulative U.S. GLP-1 revenue through end of 2024 — with Ozempic alone accounting for approximately half — underscores how extraordinary the category’s financial performance has been.
For both companies, the strategic dependency on GLP-1 revenues is now structural and irreversible. GLP-1 products accounted for 82% of Novo Nordisk’s U.S. revenue by end of 2024, and approximately 48% of Eli Lilly’s total company revenue. This concentration creates both enormous upside — as the $400+ billion in projected additional U.S. revenue from 2025 to 2030 suggests — and notable risk, as any regulatory, safety, or competitive disruption would reverberate through both companies’ financials with unusual force. The arms race in manufacturing capacity, patent protection, and pipeline development that is now consuming billions in capital expenditure at both companies is a direct consequence of how winner-take-most this market has become.
Ozempic vs Mounjaro Cost & Insurance Statistics in the US 2026
Cost remains the single most significant access barrier for both Ozempic and Mounjaro in the United States, with list prices that put both medications out of reach for uninsured patients without manufacturer assistance.
| Cost Metric | Ozempic | Mounjaro |
|---|---|---|
| Average monthly list price (US, 2025) | ~$1,384 | ~$1,493 |
| Price without insurance (early 2024 reference) | ~$935/month | ~$1,069–$1,267/month |
| Manufacturer savings program (eligible patients) | ~$25/month (NovoCare) | ~$25/month (Lilly Cares) |
| Medicare Part D coverage — diabetes indication | ✅ Covered (diabetes) | ✅ Covered (diabetes) |
| Medicare Part D coverage — weight loss only | ❌ Not covered for weight loss alone | ❌ Not covered for weight loss alone |
| Commercial insurance covered (diabetes) | ✅ Commonly covered | ✅ Commonly covered |
| Commercial insurance (weight loss — off-label) | Highly variable; often denied | Highly variable; often denied |
| Semaglutide as #1 drug by spend (2023) | ~$39 billion of $722B total U.S. drug spend | — |
| Medicare spending on Ozempic (2022) | $4.6 million | Not yet launched |
| Ozempic prescriptions filled (2023) | ~1.7 million | — |
| Commercial insurance paid share of Ozempic Rx (2023) | 61.4% | — |
| Blue Cross Blue Shield Michigan coverage (Jan 2025) | Dropped coverage for GLP-1 weight loss | Dropped coverage for GLP-1 weight loss |
Data Sources: SingleCare Mounjaro vs Ozempic Cost Comparison July 2025; KFF Health Tracking Poll 2024; American Journal of Health-System Pharmacy 2024; JAMA Health Forum 2024; Healature Drug Comparison August 2025; OANA Health Insurance Analysis January 2026
The cost landscape for Ozempic and Mounjaro in 2026 represents one of the starkest illustrations of how high pharmaceutical list prices create a two-tiered access system in American healthcare. At $1,384 and $1,493 per month respectively for the average list price, both medications are out-of-pocket impossible for the majority of uninsured Americans — yet for diabetes patients with commercial insurance, they are typically covered at a low copay. The disconnect between what insurance covers and what patients actually need the drug for is especially sharp here: both Ozempic and Mounjaro are FDA-approved only for Type 2 diabetes under their current brand names, but millions of Americans take them off-label for weight loss — and for most of those patients, insurance will not cover the cost, leaving them dependent on manufacturer assistance programs or paying full list price. The American Journal of Health-System Pharmacy finding that more money was spent on semaglutide in 2023 than on any other drug in the country — nearly $39 billion out of $722 billion in total U.S. drug spending — is a signal of both the drug’s extraordinary reach and the unsustainable financial pressure it places on payers.
The insurance landscape is actively tightening in 2026. Blue Cross Blue Shield of Michigan’s January 2025 decision to drop coverage for GLP-1 medications prescribed for weight loss is part of a broader trend of commercial payers reassessing their coverage policies as costs mount. For patients caught in this coverage gap, the manufacturer savings programs — bringing monthly costs to as low as $25 for eligible patients — provide a critical lifeline, but these programs have eligibility restrictions and are not guaranteed to persist indefinitely. The trajectory of Medicare coverage is also a major policy question: currently prohibited from covering drugs prescribed solely for weight loss, a legislative change to extend Medicare Part D coverage to obesity medications could dramatically reshape both the market and its economics — an issue that continues to generate intense lobbying and congressional debate as of April 2026.
Ozempic vs Mounjaro FDA Approvals & Expanding Indications in the US 2026
Both drugs have seen their regulatory profiles expand significantly since their initial diabetes approvals, and the pipeline of new indications is reshaping how clinicians think about the long-term role of GLP-1 medications in American medicine.
| Indication / Approval | Ozempic (Semaglutide) | Mounjaro (Tirzepatide) |
|---|---|---|
| Type 2 Diabetes | ✅ Approved December 2017 | ✅ Approved May 2022 |
| Obesity / Weight Management | ✅ Via Wegovy (approved June 2021) | ✅ Via Zepbound (approved November 2023) |
| Cardiovascular risk reduction | ✅ Approved March 2024 (SELECT trial) | Non-inferior data (SURPASS-CVOT, July 2025); not yet formally approved for this |
| Chronic kidney disease risk reduction | ✅ Approved January 2025 | Not yet approved |
| MASH / liver disease | ✅ Wegovy accelerated approval — August 2025 | In trials |
| Obstructive sleep apnea | Under investigation | Under investigation |
| Alzheimer’s prevention | Under investigation | Under investigation |
| Global GLP-1 receptor agonist market size (2024) | $53.46 billion (all brands) | — |
| Projected global GLP-1 market size (2030) | $156.71 billion (17.46% CAGR) | — |
| North America share of global GLP-1 market (2024) | 64% of global total | — |
| U.S. share within North American GLP-1 market | 95.23% | — |
Data Sources: FDA Drug Approval Database; Healature GLP-1 Drug Comparison August 2025; Grand View Research GLP-1 Market Report; Toward Healthcare GLP-1 Market Analysis April 2026; SURPASS-CVOT Trial Results July 2025
The expansion of FDA-approved indications for both Ozempic and Mounjaro over 2024 and 2025 has fundamentally changed the clinical positioning of these drugs. What began as diabetes medications are now recognized by federal regulators as treatments for cardiovascular disease, kidney disease, and liver disease — and the science suggests the list will continue to grow. Ozempic’s January 2025 approval for chronic kidney disease risk reduction added a meaningful new patient population, building on its March 2024 cardiovascular approval based on the landmark SELECT trial’s demonstration of a 20% reduction in major adverse cardiovascular events. Wegovy’s August 2025 accelerated approval for MASH (metabolic dysfunction-associated steatohepatitis with significant liver fibrosis) opened another entirely new disease category. These expanding approvals are not peripheral — they each represent millions of additional U.S. patients who now have an FDA-sanctioned clinical pathway to these medications.
The global market context adds further perspective on the U.S.-centric nature of this phenomenon. North America accounts for 64% of the entire global GLP-1 market, and within North America, the United States alone accounts for 95.23% of that share — meaning the American market is, by an overwhelming margin, the primary driver of global GLP-1 adoption, pricing, and innovation. The 17.46% projected CAGR from 2025 to 2030 for the global GLP-1 market, taking it from $53.46 billion to an estimated $156.71 billion, represents one of the most aggressive growth forecasts for any established drug class in pharmaceutical industry history — and underscores why both Novo Nordisk and Eli Lilly are continuing to pour billions into manufacturing expansion, pipeline development, and market access programs despite already dominating a category that generates unprecedented revenue.
Disclaimer: This research report is compiled from publicly available sources. While reasonable efforts have been made to ensure accuracy, no representation or warranty, express or implied, is given as to the completeness or reliability of the information. We accept no liability for any errors, omissions, losses, or damages of any kind arising from the use of this report.