
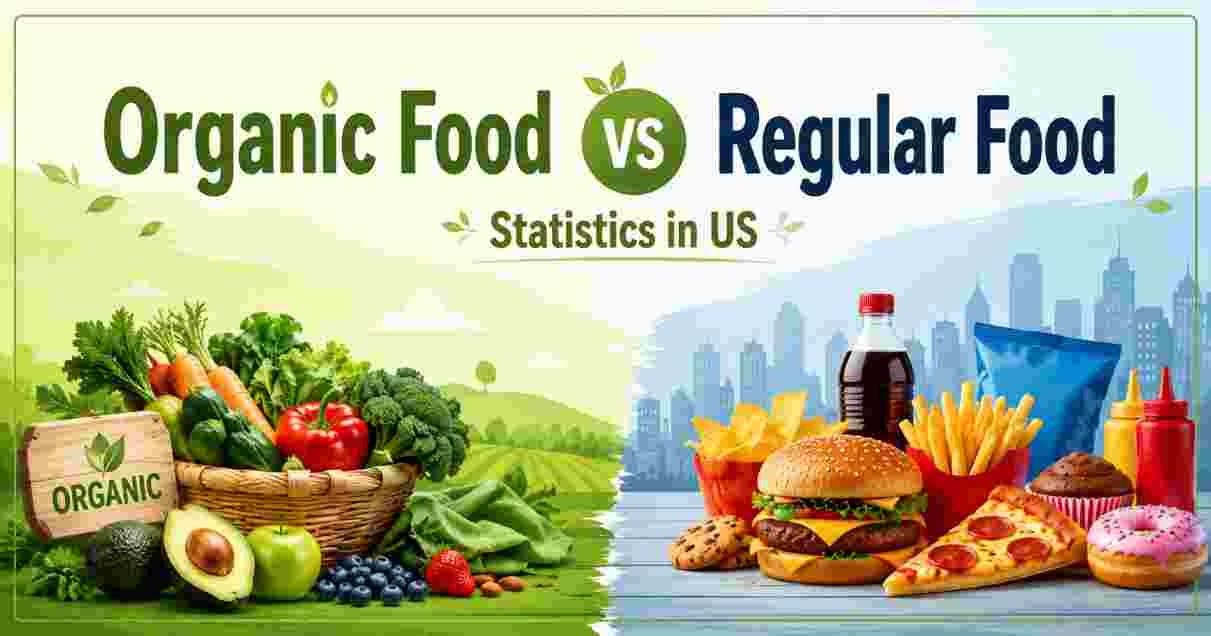
Organic vs. Conventional Food in 2026: What the Price Gap and the Science Actually Say
The organic food debate in 2026 is no longer framed as health-conscious vs. indifferent — it is increasingly a data argument about whether the price premium is justified, which products it matters most for, and what the science of nutrition research actually supports. The answer, like most things in nutrition, is nuanced. Organic Roma tomatoes cost 133.9% more than conventional at US retail in January 2026. Organic sweet potatoes run 158% more per pound than non-organic. Yet organic baby food carries only a 3% premium, and some organic products — artichokes, certain apple varieties — occasionally cost the same or less than conventional. The US organic food market continues to grow, the USDA’s 2026 data shows price premiums have shifted from item to item over the past decade, and a landmark 2025 study in Nature Plants confirms that organic farming produces measurable differences in certain nutritional compounds — while also finding that for macro nutritional content, the differences are minimal. What you choose to prioritise — pesticide reduction, antioxidant concentration, animal welfare, or cost per calorie — determines whether the premium makes sense for your household.
Key Fast Facts: Organic vs. Regular Food Statistics 2026
ORGANIC VS. CONVENTIONAL — FAST FACTS SNAPSHOT (2026)
════════════════════════════════════════════════════════════════
  Organic Roma Tomatoes Premium (Jan 2026)     ████████████████████  +133.9%
  Organic Bell Peppers Premium (Jan 2026)      ████████████████████  +131.5%
  Organic Sweet Potatoes Premium               ████████████████████  +158%
  Organic Blueberries Premium                  ████████████████████  +82%
  Items with ≥50% premium (of 52 analyzed)     ████████████████████  25 of 52 items
  Items with ≥75% premium                      ████████████          14 of 52 items
  Organic Baby Food Premium                    █                     +3% only
  Nutrition reviews finding organic superior   ████████████████████  12 of 15 studies
  Consumer Reports overall price premium avg   ████████████████████  ~+47% overall
  EWG Dirty Dozen items where organic matters  ████████████          12 categories
════════════════════════════════════════════════════════════════
| Price / Data Point | Verified Figure |
|---|---|
| Organic Roma tomatoes (Jan 2026) | $2.83/lb organic vs. $1.21/lb conventional — premium: +133.9% |
| Organic orange bell peppers (Jan 2026) | $2.50 each vs. $1.08 conventional — premium: +131.5% |
| Organic yellow bell peppers (Jan 2026) | $2.50 each vs. $1.08 conventional — premium: +131.5% |
| Organic sweet potatoes | ~158% more per pound than conventional — GoodRx analysis |
| Organic blueberries (1-pint) | 82% premium over conventionally grown — GoodRx |
| Of 52 produce items analyzed — items costing ≥50% more organic | 25 of 52 items (nearly half) — LendingTree USDA-based analysis, Jan 2026 |
| Of 52 items — costing ≥75% more organic | 14 of 52 items — LendingTree |
| Organic baby food premium | ~3% — one of the narrowest premium categories |
| Organic milk premium (historical avg) | ~88% over conventional per gallon |
| Organic eggs premium (historical avg) | ~86% over conventional |
| Organic bread premium (historical avg) | ~100% — roughly double conventional |
| Overall organic premium (Consumer Reports estimate) | ~47% more expensive across the basket |
| EWG 2026 Dirty Dozen | Strawberries, spinach, kale, peaches, pears, nectarines, apples, grapes, bell peppers, cherries, blueberries, green beans |
| EWG 2026 Clean Fifteen | Items with minimal/no detectable pesticide residues even when conventional |
| Science reviews finding organic more nutritious | 12 of 15 scientific reviews — organic showed higher vitamin C, antioxidants, omega-3 fatty acids |
| Calorie / macronutrient difference | Essentially identical — organic certification does not change caloric content |
| Pesticide residue reduction | Most consistent documented benefit of choosing organic |
Source: LendingTree USDA-based analysis (January 2026), GoodRx (updated May 6, 2026), organicfoodguides.com (April 22, 2026), EWG 2026 Dirty Dozen/Clean Fifteen, Nature Plants 2025 meta-analysis, Consumer Reports, Time — 2025–2026
The LendingTree analysis — which compared USDA retail prices for 52 fruit and vegetable items across organic and conventional versions at the same time points in January 2025 and January 2026 — is the most methodologically rigorous current snapshot of the organic price gap. The finding that 25 of 52 produce items carry at least a 50% premium when purchased organic, and that 14 carry at least a 75% premium, helps explain why the organic decision is not a simple yes-or-no question for most households. The premium is not uniformly applied: it is heavily concentrated in specific categories — nightshades, berries, certain root vegetables — where organic farming practices diverge most sharply from conventional in terms of labour and input costs.
The 12-of-15 studies finding organic nutritionally superior from the Nature Plants meta-analysis is real but requires interpretation. The differences are documented most consistently for antioxidant compounds, vitamin C, and omega-3 fatty acids — all areas where growing conditions affect the plant’s stress-response biology or the animal’s diet. They are not documented for calories, macronutrients, or the majority of micronutrients. For someone choosing organic ultra-processed food — organic cookies, organic chips — the certification means the grain or oil inputs were organic; it does not improve the nutritional profile of a food that is structurally poor regardless of ingredient source.
Organic vs. Conventional Price Comparison 2026 | Item-by-Item Data
ORGANIC PRICE PREMIUMS — SELECTED ITEMS (2026 RETAIL DATA)
════════════════════════════════════════════════════════════════
  Sweet Potatoes    ████████████████████████████████████████  +158%
  Roma Tomatoes     ████████████████████████████████████████  +133.9%
  Bell Peppers      ████████████████████████████████████████  +131.5%
  Blueberries (pt)  ██████████████████████████               +82%
  Eggs              ██████████████████████████               ~+86%
  Milk (gallon)     ███████████████████████████              ~+88%
  Bread (loaf)      █████████████████████████████████        ~+100%
  Baby Food         █                                        +3%
  (Some artichokes) ░                                        ≤0% (at parity/cheaper)
════════════════════════════════════════════════════════════════
  Source: USDA retail price data, LendingTree analysis Jan 2026, GoodRx May 2026
| Product | Conventional Price | Organic Price | Premium |
|---|---|---|---|
| Roma tomatoes (Jan 2026) | $1.21/lb | $2.83/lb | +133.9% |
| Orange bell peppers (Jan 2026) | $1.08 each | $2.50 each | +131.5% |
| Sweet potatoes | Conventional baseline | ~2.58x the conventional price | +158% |
| Blueberries (1-pint) | Conventional baseline | ~1.82x the conventional price | +82% |
| Whole milk (gallon, historical avg) | ~$2.53 | ~$4.76 | +88% |
| Eggs (dozen, historical avg) | Conventional price | ~1.86x conventional | +86% |
| Bread (loaf, historical avg) | ~$2.44 | ~$4.89 | +100% |
| Baby food (jars) | Conventional price | ~1.03x conventional | +3% |
| Kale (bunch, historical data) | Conventional baseline | ~+5% | Near parity |
| Organic at parity or lower | Artichokes, soy milk, select apple varieties | At or below conventional | 0% or negative premium |
| 25 of 52 produce items | Conventional price | At least 1.5x conventional | ≥50% premium |
| 14 of 52 produce items | Conventional price | At least 1.75x conventional | ≥75% premium |
Source: LendingTree USDA analysis (January 2026), GoodRx (May 2026), USDA ERS organic price premium data, Nielsen historical data, organicfoodguides.com (April 2026)
The dairy and egg premiums — 86–88% above conventional — are among the highest and most durable in the organic category, and they reflect real cost differences in production. Organic dairy certification requires cows to graze on certified organic pasture for at least one-third of their food intake, with no synthetic hormones or routine antibiotic use. Those production requirements have genuine cost implications that the premium reflects, and they also carry genuine animal welfare and antibiotic-resistance benefits that conventional production does not. The antibiotic resistance concern — a documented public health issue directly linked to routine antibiotic use in conventional livestock — is perhaps the most compelling systemic argument for paying organic premiums on animal products, even for consumers who are unmoved by nutritional arguments.
The USDA ERS data showing narrowing price premiums for some high-volume organic categories — apples, strawberries, spinach — since 2015 suggests that scale and competition in organic supply chains do eventually compress the premium, at least for commodity produce. Whether that compression reaches the more premium items where premiums currently run 100–158% is a question of market development and consumer demand.
Should You Buy Organic? 2026 Data-Driven Framework | Dirty Dozen, Clean Fifteen & Cost Priorities
DECISION FRAMEWORK — WHEN ORGANIC PREMIUM IS MOST/LEAST JUSTIFIED (2026)
════════════════════════════════════════════════════════════════
  HIGHEST PRIORITY — BUY ORGANIC (EWG 2026 Dirty Dozen):
  Strawberries · Spinach · Kale/Collard Greens · Peaches
  Pears · Nectarines · Apples · Grapes · Bell/Hot Peppers
  Cherries · Blueberries · Green Beans

  LOWER PRIORITY — CONVENTIONAL ACCEPTABLE (EWG 2026 Clean Fifteen):
  Items with minimal/no detectable pesticide residue even when conventional
  (Avocados, sweet corn, pineapples, onions, papayas, sweet peas,
   asparagus, honeydew melon, kiwi, cabbage, mushrooms, mangoes,
   sweet potatoes*, watermelon, carrots)

  ORGANIC ADDS LITTLE VALUE:
  Ultra-processed organic foods (cookies, chips, cereals)
  — same poor nutritional profile regardless of organic inputs
════════════════════════════════════════════════════════════════
| Decision Category | Guidance | Evidence Base |
|---|---|---|
| EWG 2026 Dirty Dozen — buy organic | 12 produce items with highest pesticide residue loads when conventional | EWG 2026 annual analysis — strongest case for organic premium |
| EWG 2026 Clean Fifteen — conventional acceptable | Items with minimal/no detectable residue even when conventional | EWG 2026; conventionally grown versions test safe |
| Animal products (meat, dairy, eggs) | Organic premium justified for antibiotic resistance + animal welfare | Public health case for antibiotic-free production |
| Ultra-processed organic food | Organic adds no health value for inherently poor-quality food | organicfoodguides.com April 2026: “nutritional profile does not improve” |
| Budget-constrained households | Prioritise Dirty Dozen organic; buy conventional for Clean Fifteen items | LendingTree analyst Matt Schulz: premiums “can make something that seemed like a necessity feel more like a luxury” |
| Nutritional differences | Most consistent: pesticide reduction, antioxidants, vitamin C, omega-3 | Nature Plants 2025 meta-analysis |
| No difference: calories, macronutrients, most micronutrients | Caloric content is essentially identical organic vs. conventional | USDA studies; multiple nutrition reviews |
| Organic farming profitability | PNAS 2015 meta-analysis: organic is 22–35% more profitable for farmers at ~30% premium | Organic premium only needs to be ~5% to break even with conventional profits |
Source: EWG 2026 Dirty Dozen and Clean Fifteen, organicfoodguides.com (April 22, 2026), LendingTree January 2026 analysis, USDA ERS, Nature Plants meta-analysis 2025, PNAS organic farming economics — 2025–2026
The most practical framework for making organic purchasing decisions in 2026 runs through the EWG Dirty Dozen and Clean Fifteen. The Dirty Dozen identifies the 12 conventional produce items that consistently test with the highest pesticide residue loads — including strawberries, spinach, bell peppers, and blueberries, all of which appear in both the residue-risk list and the highest-premium list. For these items, the organic premium most directly delivers the clearest documented benefit. The Clean Fifteen — items that test with minimal or no detectable residues even when grown conventionally — represent the categories where the organic premium delivers the least return, and where conventional purchases free up the household food budget for other priorities.
The LendingTree analyst’s warning that organic prices “can make something that seemed like a necessity feel more like a luxury” is the honest framing that nutrition advocates and organic advocates rarely lead with. At a 133.9% premium on tomatoes and 158% on sweet potatoes, organic eating across an entire produce budget is not a realistic option for most American households. Targeted organic purchasing — prioritising the Dirty Dozen and animal products, buying conventional for the Clean Fifteen — represents the evidence-based middle path that delivers most of the documented benefit at a fraction of the full-organic budget impact.
US Organic Food Market Statistics 2026 | Industry Size, Growth & Consumer Trends
US ORGANIC FOOD MARKET — KEY FIGURES (2026)
════════════════════════════════════════════════════════════════
  US Organic Food Market Size (2025)          ████████████████████  ~$67 billion
  Annual Market Growth Rate (CAGR)            ████████████          ~8–10% per year
  Organic Share of Total US Food Sales        ████████              ~6%
  US Certified Organic Operations (2024)      ████████████████████  ~30,000+
  Consumers buying organic at least sometimes ████████████████████  ~82% of US households
  Consumers buying organic regularly          ████████████████████  ~40% of US households
  Top reason consumers buy organic            ████████████████████  Pesticide/chemical avoidance
  Second reason                               ████████████          Environmental concerns
  Third reason                                ████████              Perceived health benefits
  Organic produce as % of all produce sales   ████████████████████  ~15%
════════════════════════════════════════════════════════════════
| Market / Consumer Metric | Data Point | Context |
|---|---|---|
| US organic food market size (2025) | ~$67 billion | One of the world’s largest organic markets; grown from ~$3.6B in 1997 |
| Annual market growth rate | ~8–10% CAGR | Outpacing overall food market growth consistently |
| Organic share of total US food sales | ~6% | Small but growing share of the total $1+ trillion US food market |
| Certified organic farms (US, 2024) | ~30,000+ | USDA certified; includes both livestock and crop operations |
| Households buying organic at least sometimes | ~82% | OTA (Organic Trade Association) consumer survey data |
| Households buying organic regularly | ~40% | Regular purchasers — at least weekly organic buying |
| Top consumer motivation | Pesticide/chemical avoidance | Consistently the #1 reason across consumer surveys |
| Second motivation | Environmental sustainability | Growing as a driver, particularly among under-35 consumers |
| Third motivation | Perceived health benefits | Despite limited macro nutritional evidence, perception drives purchasing |
| Organic produce as % of all produce | ~15% of total US produce sales | Highest organic penetration category — fruits and vegetables |
| Organic dairy as % of dairy sales | ~8% | Strong growth since early 2000s; stabilising in recent years |
| Fastest-growing organic categories | Snacks, beverages, and condiments | Packaged organic food growing faster than fresh organic produce |
| Income correlation | Organic purchasing strongly correlated with higher income | LendingTree analyst: premiums “can make a necessity feel like a luxury” for lower-income households |
Source: Organic Trade Association (OTA), USDA National Organic Program, LendingTree January 2026, organicfoodguides.com April 2026, GoodRx May 2026 — 2024–2026
The $67 billion US organic food market is now large enough that it operates according to the same commercial dynamics as the broader food industry — volume discounting, private label organic, commodity supply chains, and retailer own-brand organics that compress margins and, gradually, premiums. The evidence of that compression is visible in the USDA ERS data showing that price premiums for high-volume organic categories like apples, strawberries, and spinach have been declining since 2015, even as the overall market grows. Retailers like Costco, Walmart, and Aldi have accelerated this by introducing competitive-price organic lines that reduce the premium gap in the most commonly purchased produce categories.
The fastest-growing organic segments — snacks, beverages, and condiments — present a more complicated value proposition than fresh produce. An organic granola bar or organic ketchup carries the USDA organic certification because its grain or tomato inputs were grown without synthetic pesticides, but the product category itself may still be nutritionally poor. This is where the pesticide-reduction benefit of organics applies most narrowly: if the concern is pesticide residue reduction, fresh produce organic choices on the Dirty Dozen list deliver far more benefit per dollar than organic packaged snack purchases. Consumer awareness of this distinction remains limited, and marketing of the “organic” label across all categories continues to benefit from the health halo that research most clearly supports for fresh produce.
Disclaimer: This research report is compiled from publicly available sources. While reasonable efforts have been made to ensure accuracy, no representation or warranty, express or implied, is given as to the completeness or reliability of the information. We accept no liability for any errors, omissions, losses, or damages of any kind arising from the use of this report.