
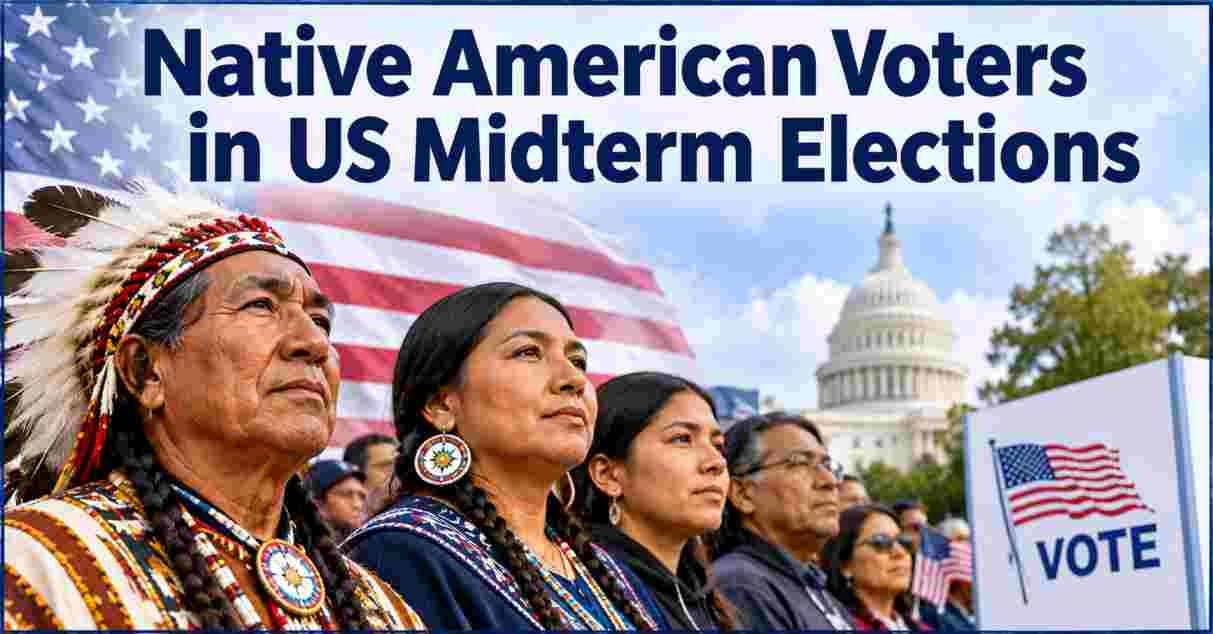
Native American voters in the US backed Democratic candidates 57% to 41% in the 2026 midterms, and a record 359 Native candidates ran across 36 states. About 4.7 million Native Americans are eligible to vote, roughly 66% are registered, and Deb Haaland and Peggy Flanagan won historic firsts for Native women on November 3, 2026.
Native American Voters in US Midterm Elections 2026 – Introduction
Native American voters make up one of the smallest and least measured parts of the US electorate. About 4.7 million Native Americans are eligible to vote, and many live on rural reservations, far from polling places and sometimes without a standard street address. In 2026, those Native American voters also faced new court rulings on the Voting Rights Act and a record number of Native names on the ballot.
The 2026 midterms produced two historic wins. Deb Haaland became the first Native American woman elected governor, and Peggy Flanagan became the first Native American woman elected to the US Senate. This report covers eligibility, registration, turnout, party preferences, voting barriers, tribal voting rights law and the Native candidates who won. Figures run through November 8, 2026, and some races remain uncalled.
Interesting Facts about Native American Voters in US Midterm Elections 2026
DEMOCRATIC SHARE OF HOUSE VOTE BY GROUP, 2026 (percent)
Black voters             | ████████████████████████████████████████ 85
Latino voters            | ████████████████████████████ 67
Asian American voters    | █████████████████████████ 64
Native American voters   | ████████████████████ 57
White voters             | ████████████ 44
| Fact | 2026 Data |
|---|---|
| Native American vote, Democratic vs Republican | 57% to 41% |
| Native Americans eligible to vote | About 4.7 million |
| Registered share of eligible Native Americans | About 66% |
| Estimated average Native turnout | 36.4% in 12 states |
| Native candidates running | At least 359 across 36 states |
| Native candidates in 2024 | 268 across 25 states |
| First Native woman governor | Deb Haaland, New Mexico |
| First Native woman senator | Peggy Flanagan, Minnesota |
| First woman president of the Navajo Nation | Crystalyne Curley |
| Native senators in history | 4 before Flanagan, all men |
Source: African American Research Collaborative and BSP Research 2026 Midterm Election Voter Poll; Native American Rights Fund; Advanced Native Political Leadership; Associated Press; CBS News.
The 57% to 41% Democratic split comes from a national voter poll of more than 10,000 people taken from October 20 to Election Day. Native voters sat between white voters, who backed Republicans 53% to 44%, and Latino voters, who backed Democrats 67% to 31%. The Native sample is small, so treat the figure as an estimate.
The candidate numbers show a surge. At least 359 Native candidates ran in 36 states, up from 268 in 25 states in 2024. The estimate that 36.4% of Native Americans vote comes from a Native American Rights Fund calculation across 12 states, averaged over presidential and midterm years. The Census Bureau does not report Native registration or turnout.
Native American Voter Eligibility and Registration 2026: Who Can Vote
NATIVE AMERICAN VOTER REGISTRATION (percent of eligible)
Registered         | █████████████████████████████████████████████████ 66
Not registered     | █████████████████████ 34
| Measure | Data |
|---|---|
| Native Americans eligible to vote | About 4.7 million |
| Registered to vote | About 66% |
| Share living in rural and small-town areas on or within 20 miles of reservations | 54% |
| New registrations in select counties, 2020 to 2024 | Down 59% |
| Registration rejections, high-Native counties | Up about 200% on average |
| Registration drive rejection rate | 25% |
| Official Census registration data for Native Americans | Not published |
Source: Native American Rights Fund and National Conference of State Legislatures; Native American Rights Fund and Blockwell Consulting, “Obstacles Persist,” August 2026; First Nations Development Institute census analysis.
About 4.7 million Native Americans can vote, and about 66% are registered, which leaves roughly one in three off the rolls. Those figures come from the Native American Rights Fund, because the Census Bureau does not publish registration or turnout for Native Americans. Another 54% of American Indians and Alaska Natives live in rural and small-town areas on or within 20 miles of reservations.
The 2026 registration data points to problems before Election Day. In counties where Native Americans are more than 25% of the population, new registrations fell 59% from 2020 to 2024. Mail and motor vehicle office registration rejections rose about 200% on average. Registration drives, a common tool in Indian Country, carried a 25% rejection rate in the report’s data.
Native American Voter Turnout 2026: The Reservation Gap
NATIVE AMERICAN TURNOUT GAP ON TRIBAL LANDS (percentage points, 21 states)
Presidential elections  | ███████████████ 15
Midterm elections       | ███████ 7
| Measure | Value |
|---|---|
| Estimated Native turnout, presidential and midterm average | 36.4% |
| Gap below white turnout | 18.4 percentage points |
| Turnout gap on tribal lands, presidential years | 15 percentage points |
| Turnout gap on tribal lands, midterm years | 7 percentage points |
| States in tribal land study | 21 |
| 2026 national turnout | About 48.8% |
| 2026 Native-specific turnout | Not yet published |
Source: Native American Rights Fund estimate via NCSL; Brennan Center for Justice study of 21 states; University of Florida Election Lab.
No official 2026 Native turnout figure exists yet. The Native American Rights Fund estimates that Native turnout averaged 36.4% across 12 states with large Native populations, which is 18.4 points below white turnout. A Brennan Center study of 21 states, published in 2024, found voters on federally recognized tribal lands turned out 15 points lower than others in presidential years and 7 points lower in midterms.
The midterm gap is narrower, in part because turnout falls among all voters. National turnout in 2026 was about 48.8%. The Brennan study also found that as the Native share of a tribal area grows, turnout tends to fall, which points to barriers in heavily Native communities. Final 2026 Native turnout estimates will take months and will depend on state voter files.
Native American Party Preferences 2026: How Native Voters Voted
NATIVE AMERICAN VOTE, DEMOCRATIC VS REPUBLICAN (percent)
2022 midterm  | D ████████████████████████████ 56 | R ████████████████████ 40
2024 president| D ████████████████████████████ 57 | R ███████████████████ 39
2026 midterm  | D ████████████████████████████ 57 | R ████████████████████ 41
| Election | Democratic | Republican |
|---|---|---|
| 2022 midterm | 56% | 40% |
| 2024 presidential | 57% | 39% |
| 2026 midterm | 57% | 41% |
| 2024 Trump voters who backed a Democrat in 2026 | 9.8% | Not applicable |
| Black voters, 2026 | 85% | 13% |
| Latino voters, 2026 | 67% | 31% |
| White voters, 2026 | 44% | 53% |
Source: African American Research Collaborative and BSP Research polls, 2022 to 2026; First Nations Development Institute; Brookings Institution.
Native voters leaned Democratic in all three recent elections, by roughly 16 to 18 points. They backed Democrats 56% to 40% in 2022, 57% to 39% in 2024 and 57% to 41% in 2026. About 9.8% of Native voters who backed Trump in 2024 voted Democratic in 2026, about the same as Black voters (10%) and smaller than Asian American voters (17%).
The Native share for Democrats ran below that of Latino voters (67%) and Black voters (85%) and above white voters (44%). In the 2024 poll, younger Native men were more likely to vote Republican than older Native men, and researchers caution against reading too much into small subgroups. A reader survey by Native News Online found 75% planning to vote Democratic, but it had just 107 responses and is not representative.
Native American Vote Polling Accuracy 2026: Why Exit Polls Miss Native Voters
NATIVE VOTERS FOR TRUMP IN 2024, BY POLL (percent)
National exit poll (about 228 respondents)  | ████████████████████████████ 65
Voter poll (500 respondents) | ██████████████ 39| Poll | Native Sample | Finding |
|---|---|---|
| 2024 national exit poll (Edison Research) | About 228 | 65% to 68% for Trump |
| 2024 American Electorate Voter Poll | 500 | 57% Harris, 39% Trump |
| Tribal land interview sites in exit poll | None | Not included |
| 2026 Voter Poll (AARC and BSP Research) | Part of 10,141 voters | 57% Democratic, 41% Republican |
| 2024 Native voters on or near reservations who considered tribal issues | 82% | Compared with 72% of urban Native voters |
Source: Brookings Institution; First Nations Development Institute; High Country News; American Community Media.
In 2024, a national exit poll suggested 65% to 68% of Native voters backed Donald Trump. That sample had about 228 Native respondents and no interview sites on tribal lands. A separate nationally representative poll of 500 Native voters found 57% backed Kamala Harris and 39% backed Trump. The gap shows how much sample design matters for a group this small.
The 2026 poll came from the same research partners as the 2024 American Electorate poll. It surveyed 10,141 voters and was fielded by the African American Research Collaborative and BSP Research with First Nations Development Institute. The 2024 poll also found 82% of Native voters on or near reservations considered tribal issues, against 72% of urban Native voters. Compare Native numbers only within a single poll.
Native American Voter Issues 2026: Sovereignty, Land and Cost of Living
TRIBAL ISSUES THAT SHAPED NATIVE VOTES IN 2024 (percent)
Land rights                | ████████████████████████████ 59
Tribal sovereignty         | ███████████████████████████ 58
Considered tribal issues   | ██████████████████████████████████████████████ 78
| Measure | Data |
|---|---|
| Considered tribal issues when voting (2024) | 78% |
| Land rights as a deciding issue (2024) | 59% |
| Tribal sovereignty as a deciding issue (2024) | 58% |
| On or near reservations, considered tribal issues | 82% |
| Urban Native voters, considered tribal issues | 72% |
| Common economic concerns | Inflation, housing, health care |
| 2026 issue results | Pending from the national poll |
Source: Brookings Institution; First Nations Development Institute, 2024 American Electorate Poll; American Community Media, October 2026.
In 2024, 78% of Native respondents said they weighed tribal issues when they voted. Land rights mattered to 59% and tribal sovereignty to 58%. Those numbers are from 2024, because First Nations had not published 2026 issue results at the time of this report. They show that Native voters treat sovereignty as a voting issue alongside the economy.
Advocates say these concerns connect. Native families worry about grocery bills, housing costs and health care, and those pressures tie to land rights, language revitalization and sovereign authority. Candidates such as Flanagan campaigned on tribal sovereignty, treaty and trust responsibilities and the cost of living. Advocates also cited federal funding cuts to tribal programs as a 2026 concern.
Native American Voting Barriers 2026: Registration, Mail Ballots and Provisional Ballots
CHANGES IN HIGH-NATIVE COUNTIES, 2020 TO 2024 (percent)
Registration rejections        | ████████████████████████████████████████ +200
Missed-deadline rejections     | ███████████████████████████ +134
Missed-deadline, national      | ███████████ +55
Counted provisional rate vs national | -15
| Barrier | Data |
|---|---|
| Counties studied | 30 with Native population over 25% |
| States studied | 13 with the most Native residents |
| Registration rejection increase | About 200% on average |
| Missed-deadline rejections, high-Native counties | Up 134% |
| Missed-deadline rejections, national | Up 55% |
| Provisional ballots counted, vs national rate | 15% lower |
| Provisional rejection rate | Roughly double the national rate |
| Mail ballot rejection effect in a 100% Native county | 2.8 points higher than a county with no Native residents |
Source: Native American Rights Fund and Blockwell Consulting, “Obstacles Persist: According to the Data,” August 2026, using U.S. Election Assistance Commission data for 2020, 2022 and 2024.
The Native American Rights Fund and Blockwell Consulting studied 30 counties where Native Americans are more than 25% of the population and 13 states with large Native populations. Between 2020 and 2024, rejections for missed deadlines rose 134% in those counties, against 55% nationally. Mail ballot rejection rates rose even as the number of mail votes fell. The average county rejection rate was 1%.
Provisional ballots show the same pattern. The share counted in high-Native areas rose but remained 15% below the national counted rate, and provisional ballots are rejected at roughly double the national rate. Researchers cite unreliable mail, nonstandard addresses, limited broadband and poll workers who refuse tribal identification. In Apache County, Arizona, drop box availability fell from the midterm to the presidential election.
Tribal Voting Rights Law 2026: Callais, Turtle Mountain and Section 2
KEY 2026 COURT DATES
Apr 29  | Louisiana v. Callais decided (6 to 3)
May 18  | Supreme Court vacates Turtle Mountain ruling
Jul 7   | Eighth Circuit sends case to trial court
| Date | Event |
|---|---|
| May 14, 2025 | Eighth Circuit rules private parties cannot sue under Section 2 |
| April 29, 2026 | Louisiana v. Callais decided 6–3; Section 2 limited |
| May 18, 2026 | Supreme Court vacates the Turtle Mountain ruling and sends it back |
| July 7, 2026 | Eighth Circuit sends the case to the trial court |
| 2023 | Trial court struck North Dakota’s legislative map |
| Plaintiffs | Turtle Mountain Band, Spirit Lake Tribe, Native voters |
| Eighth Circuit status | Only circuit to bar private Section 2 suits |
Source: U.S. Supreme Court; Native American Rights Fund; Tribal Supreme Court Project; Loyola Law School All About Redistricting; Indianz.
The Voting Rights Act is the main tool Native voters have used to challenge discriminatory maps. In Turtle Mountain Band of Chippewa Indians v. Howe, a trial court struck North Dakota’s legislative map in 2023. The Eighth Circuit ruled in May 2025 that private parties could not sue under Section 2, and it is the only circuit to hold that. The Supreme Court vacated that ruling on May 18, 2026.
The order followed Louisiana v. Callais, decided 6–3 on April 29, 2026, in which the Court held that Louisiana’s second majority-Black district was unconstitutional. NARF and the National Congress of American Indians said the ruling weakened Section 2. The Eighth Circuit sent the case back to the trial court on July 7. The remand did not decide whether private suits are allowed.
Native American Candidates and Winners 2026: Haaland, Flanagan and Tribal Presidents
NATIVE CANDIDATES RUNNING (count)
2024  | ██████████████████████████ 268
2026  | ███████████████████████████████████ 359
| Office | Winner |
|---|---|
| New Mexico governor | Deb Haaland (Laguna Pueblo), beat Gregg Hull |
| Minnesota Senate | Peggy Flanagan (White Earth), beat Michele Tafoya by about 10 points |
| Kansas House | Sharice Davids (Ho-Chunk), re-elected |
| Oklahoma House | Josh Brecheen (Choctaw), re-elected |
| New York House | Claire Valdez (Ysleta del Sur Pueblo), first Native member from New York |
| Michigan House | Sean McCann (Citizen Potawatomi), first Native member from Michigan |
| Navajo Nation president | Crystalyne Curley, first woman; unofficial results |
| Seneca Nation president | Tina Abrams, first woman |
| Alaska Senate | Mary Peltola (Yup’ik); race unsettled |
Source: Associated Press (Global Indigenous Reporting Network); CBS News; NBC News; CBC News; Advanced Native Political Leadership.
At least 359 Native candidates ran in 36 states in 2026, up from 268 in 25 states in 2024. Haaland won New Mexico’s governorship over Republican Gregg Hull. Flanagan beat Republican Michele Tafoya by about 10 points, becoming the first Native American woman in the Senate. Only four Native people have served in the Senate before, all men.
In the House, Sharice Davids and Josh Brecheen won re-election, and Claire Valdez and Sean McCann became the first Native Americans elected to Congress from New York and Michigan. Mary Peltola’s Alaska Senate race was still unsettled; a win would put three Native people in the Senate at once. Crystalyne Curley won the Navajo Nation presidency by a narrow unofficial margin and Tina Abrams won the Seneca Nation presidency.
Native American Voters by State 2026: Where Native Votes Mattered
NATIVE WINS BY OFFICE, NOVEMBER 2026 (count)
Governor           | █ 1
U.S. Senate        | █ 1 (plus 1 unsettled)
U.S. House         | ████ 4
Tribal presidents  | ██ 2
| State | 2026 Native Vote Fact |
|---|---|
| New Mexico | Haaland elected governor; youth registration rose 27% after automatic registration began |
| Minnesota | Flanagan elected to the Senate by about 10 points |
| Alaska | Peltola’s Senate race unsettled; a win would put 3 Native people in the Senate |
| Arizona | Navajo Nation elected its first woman president; Apache County cut drop boxes in presidential years |
| North Dakota | Turtle Mountain redistricting case returned to the trial court on July 7 |
| Nevada | Paiute tribes won a reservation voting center in 2022, serving over 500 registered voters |
| Kansas, Oklahoma | Davids and Brecheen re-elected to the House |
| New York, Michigan | Valdez and McCann became their states’ first Native members of Congress |
Source: Associated Press (Global Indigenous Reporting Network); CIRCLE at Tufts University; Native American Rights Fund; American Community Media; CBS News.
Native candidates won 1 governorship, 1 Senate seat, 4 House seats and 2 tribal presidencies in the table above. New Mexico stands out because the state introduced automatic voter registration in July 2025, and youth registration there rose 27% compared with 2022. Haaland, who traces her ancestry in the region back 800 years, won the governorship. The Navajo Nation, the largest tribal land base, spans 27,000 square miles across Arizona, New Mexico and Utah, and its new president takes office in January. Curley plans to move the tribe away from coal development after taking office.
Other states show the access side of the story. Paiute tribes sued Elko County in 2022 and won the first voting center on their Nevada reservation, which serves more than 500 registered voters. In Apache County, Arizona, drop box availability fell in presidential elections, when turnout is highest. North Dakota’s redistricting case shows why map fights matter for Native representation, because the case returned to a trial court on July 7, 2026.
Native American Voters in US Midterm Elections 2026 FAQ
How did Native American voters vote in the 2026 midterms?
They backed Democrats 57% to 41%, according to the AARC and BSP Research Voter Poll of more than 10,000 voters.
How many Native Americans are eligible to vote?
About 4.7 million, and about 66% are registered, per the Native American Rights Fund.
What was Native American voter turnout in 2026?
No official figure exists yet. The Native American Rights Fund estimates an average of 36.4% across presidential and midterm years in 12 states.
Did Deb Haaland win in 2026?
Yes. She won New Mexico’s governorship and is the first Native American woman elected governor.
Did Peggy Flanagan win the Minnesota Senate race?
Yes. She beat Michele Tafoya by about 10 points and is the first Native American woman elected to the Senate.
How many Native candidates ran in 2026?
At least 359 across 36 states, up from 268 across 25 states in 2024.
Who is the first woman president of the Navajo Nation?
Crystalyne Curley won on November 3, 2026, by a narrow unofficial margin.
Why do exit polls miss Native voters?
Samples are small and often skip tribal lands. The 2024 exit poll had about 228 Native respondents and no tribal land interview sites.
What barriers do Native voters face?
Registration rejections, rejected mail and provisional ballots, unreliable mail, nonstandard addresses and tribal identification that poll workers refuse.
How much did registration rejections rise in high-Native counties?
About 200% on average from 2020 to 2024 in counties where Native Americans are more than 25% of the population.
What is the Turtle Mountain case about?
Whether private parties can sue under Section 2 of the Voting Rights Act. The Supreme Court vacated the Eighth Circuit’s ruling on May 18, 2026.
What did Louisiana v. Callais decide?
On April 29, 2026, a 6–3 Court held Louisiana’s second majority-Black district unconstitutional, narrowing Section 2.
Is Mary Peltola’s Senate race decided?
No. It was still unsettled as of November 8, 2026.
Do Native Americans vote differently on or off reservations?
In 2024, 82% of Native voters on or near reservations considered tribal issues, against 72% of urban Native voters.
Does the Census Bureau report Native American turnout?
No. It does not publish registration or turnout for Native Americans.
Which Native Americans won seats in Congress in 2026?
Sharice Davids and Josh Brecheen won re-election, and Claire Valdez and Sean McCann became the first Native members of Congress from New York and Michigan.
How many Native senators have there been?
Only four before Peggy Flanagan, all men. A win by Mary Peltola would put three Native people in the Senate at once.
Who is the first woman president of the Seneca Nation?
Tina Abrams won the Seneca Nation presidency on November 3, 2026.
Disclaimer: This research report is compiled from publicly available sources. While reasonable efforts have been made to ensure accuracy, no representation or warranty, express or implied, is given as to the completeness or reliability of the information. We accept no liability for any errors, omissions, losses, or damages of any kind arising from the use of this report.