
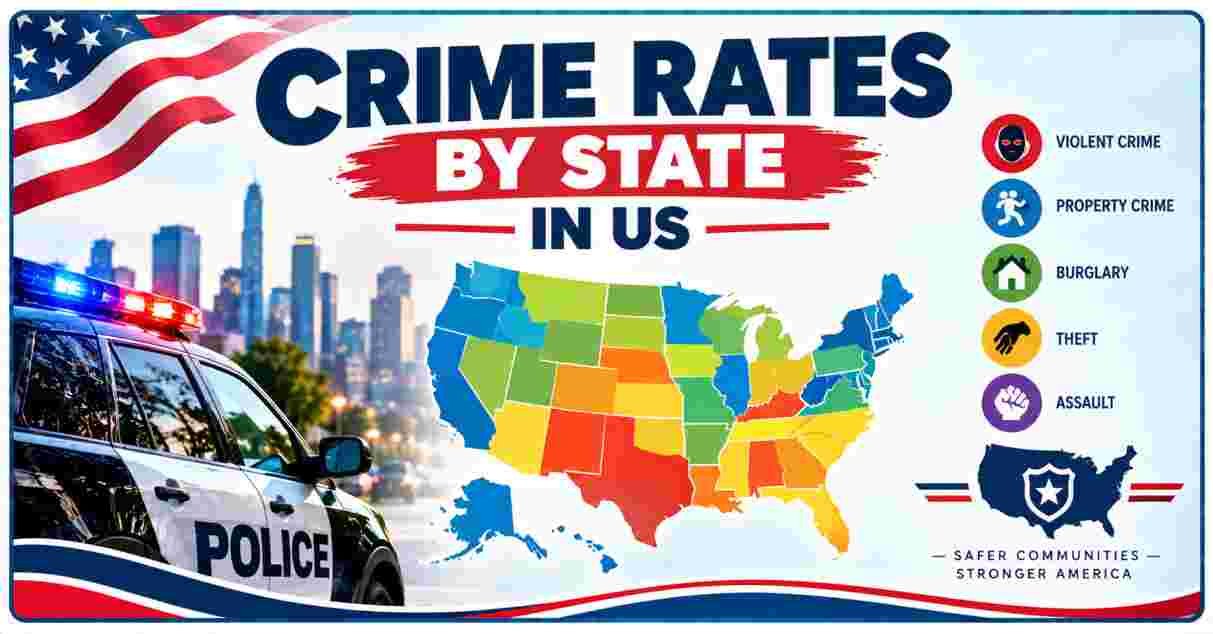
Crime rates by state in US 2026 show violent crime at its lowest national level in nearly 90 years, with a 9.3% drop from 2024 to 2025, yet the gap between states remains enormous. Alaska and New Mexico post violent crime rates over seven times higher than Maine and New Hampshire, the nation’s safest states.
Crime Rates by State in US 2026 – Introduction
Crime rates by state in US 2026 reveal a country experiencing one of the sharpest nationwide safety improvements on record, even as the distance between the safest and most dangerous states keeps growing wider. The FBI’s newly released full-year 2025 data shows violent crime fell 9.3% from 2024, the largest single-year decline since the agency began compiling estimates in 1936, and the national murder rate now sits at 4.1 per 100,000 residents, tied with 1955 and 1956 for the lowest rate ever recorded. Yet these national averages mask staggering state-by-state variation that has persisted for decades regardless of the overall trend line.
This report breaks down crime rates by state in US 2026 across every major dimension: the states with the highest and lowest violent and property crime rates, murder rate rankings, regional patterns, firearm-related crime, demographic breakdowns, and the state policy factors researchers link to these persistent differences. The most current state-level breakdown available uses 2024 FBI data, since the agency’s 2025 topline figures have not yet been fully disaggregated by state and offense category, a reporting lag this report addresses directly wherever it applies. What the data consistently shows is that geography still matters more than almost any other single factor in determining an American’s statistical odds of experiencing violent crime.
Interesting Facts About Crime Rates by State in 2026
| Statistic | 2026 Data |
|---|---|
| National Violent Crime Change (2024 to 2025) | -9.3% |
| National Murder Rate (2025) | 4.1 per 100,000, tied for lowest ever |
| National Violent Crime Rate (2024, latest by-state data) | 359.1 per 100,000 |
| Most Dangerous State (Violent Crime) | Alaska, 724.1 per 100,000 |
| Safest State (Violent Crime) | Maine, 100.1 per 100,000 |
| Gap Between Safest and Most Dangerous State | 7.2x (Alaska vs. Maine) |
| Most Dangerous Jurisdiction Overall | District of Columbia, 1,005.5 per 100,000 |
| Highest Property Crime Rate | New Mexico, 2,751.1 per 100,000 |
| States Where Violent Crime Fell in 2024 | 46 of 50 states |
| States Where Violent Crime Rose in 2024 | 5 states |
| Total US Violent Crimes (2025) | ~1.12 million |
| Property Crime Change (2024 to 2025) | -12.4% |
Data Source: FBI Uniform Crime Reporting Program, USAFacts, FBI Crime Data Explorer (2026)
The numbers above capture a nation where the overall trend line and the state-by-state reality tell two different, equally important stories. Nationally, the 9.3% drop in violent crime between 2024 and 2025 marks the steepest single-year decline since the FBI began compiling estimates in 1936, and the 4.1 per 100,000 murder rate ties the lowest level ever recorded in American history. That improvement built on 46 of 50 states already recording violent crime declines in 2024, with only 5 states moving in the opposite direction, suggesting the 2025 national drop reflects a genuinely broad-based trend rather than a handful of large states pulling down the average.
Even against that backdrop of historic improvement, the gap between individual states remains stark. Alaska’s violent crime rate of 724.1 per 100,000 residents runs more than seven times higher than Maine’s 100.1 per 100,000, the lowest of any state, and Washington, D.C., treated as a state-equivalent for ranking purposes, posts a rate exceeding 1,000 per 100,000, roughly ten times Maine’s figure. These persistent gaps mean that where an American lives continues to shape their statistical exposure to violent crime far more dramatically than the encouraging national headline numbers suggest on their own.
National Crime Trends Context 2026
US National Violent Crime & Murder Rate (2020-2025)
2020 |████████████████████████ Pandemic-era surge begins
2021 |██████████████████████████ Peak, ~6.9/100k murder rate
2023 |████████████████████ 5.7/100k murder rate
2024 |██████████████████ 5.0/100k murder rate, 359.1/100k violent
2025 |███████████████ 4.1/100k murder rate, -9.3% violent crime
| Metric | 2024 Value | 2025 Value | Change |
|---|---|---|---|
| National Violent Crime Rate | 359.1 per 100,000 | ~327.6 per 100,000 | -9.3% |
| National Murder Rate | 5.0 per 100,000 | 4.1 per 100,000 | -18.1% |
| Robbery | Baseline | -18.5% YoY | Declining |
| Aggravated Assault | Baseline | -7.2% YoY | Declining |
| Rape | Baseline | -7.6% YoY | Declining |
| Property Crime | Baseline | -12.4% YoY | Declining |
Data Source: FBI Releases 2025 Reported Crimes in the Nation Statistics, FBI Crime Data Explorer
National crime trends heading into 2026 confirm that the historic post-pandemic reversal in violent crime has not just continued but accelerated. Every major violent crime category declined between 2024 and 2025: murder and non-negligent manslaughter fell 18.1%, robbery dropped 18.5%, rape decreased 7.6%, and aggravated assault fell 7.2%. FBI Director Kash Patel highlighted the murder rate specifically, noting it now ties 1955 and 1956 for the lowest level since the agency began estimating national homicide rates, a benchmark that stood for nearly seventy years before this latest decline matched it.
Property crime followed a similar trajectory, falling 12.4% nationally in 2025 after an 8.1% decline the year before, with motor vehicle theft posting the single largest one-year drop ever recorded at 18.6% in 2024 alone. More than 13 million criminal offenses were reported to the FBI by participating law enforcement agencies for 2025, and hate crime reports also declined, with 10,881 criminal incidents and 13,026 related offenses recorded, both down from the prior year. This across-the-board improvement, spanning violent crime, property crime, and hate crime simultaneously, distinguishes 2025 from prior post-crisis recoveries that often showed uneven progress across categories.
States with the Highest Violent Crime Rates in 2026
Highest Violent Crime Rates by State, per 100,000 (2024 Data)
DC (state-equiv.) |████████████████████████████████████████ 1,005.5
Alaska            |█████████████████████████████ 724.1
New Mexico        |████████████████████████████ 717.1
Tennessee         |███████████████████████ 592.3
Arkansas          |██████████████████████ 579.4
Louisiana         |████████████████████ 519.8
| State | Violent Crime Rate (per 100,000) | National Rank |
|---|---|---|
| District of Columbia | 1,005.5 | 1st (state-equivalent) |
| Alaska | 724.1 | 1st (state) |
| New Mexico | 717.1 | 2nd |
| Tennessee | 592.3 | 3rd |
| Arkansas | 579.4 | 4th |
| Louisiana | 519.8 | 5th |
| Missouri | 462.0 | Mid-tier example |
Data Source: FBI Uniform Crime Reporting Program via USAFacts, FBI Crime Data Explorer (2024 data, most recent by-state breakdown)
The states posting the highest violent crime rates in the most recent by-state FBI data share several structural characteristics that researchers consistently point to when explaining the pattern. Alaska, at 724.1 per 100,000, leads all fifty states, a rate driven heavily by geographic isolation, limited law enforcement resources across vast rural areas, and elevated rates of domestic violence and sexual assault documented extensively in state and federal reports. New Mexico, close behind at 717.1, faces similar rural isolation challenges compounded by cross-border trafficking dynamics along its stretch of the US-Mexico border and persistent economic disparities in several of its largest counties.
Tennessee, Arkansas, and Louisiana round out the top tier of states, all falling within the broader Southern region that consistently records higher violent crime rates than the Northeast or Midwest according to Census Bureau regional breakdowns. Washington, D.C., while technically a federal district rather than a state, is routinely included in these rankings as a state-equivalent and posts the single highest rate of any jurisdiction at 1,005.5 per 100,000, though the city’s own 2025 data shows a dramatic 40% year-over-year improvement following a historically difficult 2023. Missouri’s rate of 462.0 per 100,000 illustrates a useful mid-tier reference point, roughly 29% above the national average, showing that elevated crime rates extend meaningfully beyond just the handful of states topping the list.
States with the Lowest Violent Crime Rates in 2026
Lowest Violent Crime Rates by State, per 100,000 (2024 Data)
Maine          |████ 100.1
New Hampshire  |████ 110.1
Connecticut    |█████ 136.0
Rhode Island   |██████ 153.6
Wyoming        |████████ 203.4
| State | Violent Crime Rate (per 100,000) | National Rank (Safest) |
|---|---|---|
| Maine | 100.1 | 1st (safest) |
| New Hampshire | 110.1 | 2nd |
| Connecticut | 136.0 | 3rd |
| Rhode Island | 153.6 | 4th |
| Wyoming | 203.4 | 5th |
Data Source: FBI Uniform Crime Reporting Program via USAFacts (2024 data, most recent by-state breakdown)
The states posting the lowest violent crime rates cluster heavily in the Northeast, with Maine, New Hampshire, Connecticut, and Rhode Island occupying four of the five safest spots nationally. Maine’s rate of 100.1 per 100,000 is more than three-and-a-half times lower than the national average of 359.1, a gap researchers attribute to the region’s relatively low poverty concentration, smaller urban cores with less concentrated disadvantage, an aging population that statistically commits and experiences less violent crime, and consistently high levels of state and local investment in social services and community policing.
Wyoming’s inclusion at fifth safest, despite sitting outside the Northeastern cluster entirely, illustrates that low population density and rural character can produce similarly low violent crime rates even in a very different regional and political context than New England. What unites all five safest states is a common absence of the large, high-poverty urban centers that tend to concentrate violent crime incidents in states further up the rankings, though researchers caution that low overall state rates can still mask meaningfully higher crime concentrations within a state’s largest city or specific high-poverty neighborhoods, a pattern documented consistently in national crime research.
States with the Highest Property Crime Rates in 2026
Highest Property Crime Rates by State, per 100,000 (2024 Data)
New Mexico   |████████████████████████████████████████ 2,751.1
Colorado     |█████████████████████████████████████ 2,592.8
Washington   |█████████████████████████████████████ 2,466.5
Oregon       |███████████████████████████████████ 2,388.0
Louisiana    |████████████████████████████████ 2,296.4
| State | Property Crime Rate (per 100,000) | National Rank |
|---|---|---|
| New Mexico | 2,751.1 | 1st |
| Colorado | 2,592.8 | 2nd |
| Washington | 2,466.5 | 3rd |
| Oregon | 2,388.0 | 4th |
| Louisiana | 2,296.4 | 5th |
Data Source: FBI Uniform Crime Reporting Program via USAFacts (2024 data, most recent by-state breakdown)
Property crime, which the FBI defines to include burglary, larceny-theft, and motor vehicle theft, follows a notably different geographic pattern than violent crime, with Western states dominating the highest-rate rankings rather than the Southern states that lead violent crime tables. New Mexico tops both lists, at 2,751.1 per 100,000 for property crime, while Colorado, Washington, and Oregon round out three of the top four spots, a Western concentration researchers link to factors including higher rates of vehicle theft in car-dependent metro areas, drug-related property crime tied to regional substance use patterns, and, in Colorado specifically, frequent burglary, larceny, and arson incidents affecting businesses across the state.
Nationally, roughly 89% of burglaries go unsolved, a clearance rate that helps explain why property crime remains persistently elevated in certain states even as violent crime falls sharply nationwide. Encouragingly, 2025 data shows this trend improving even in high-property-crime states: nonresidential burglaries fell an additional 18% nationally in 2025 alone, and Denver specifically saw its violent crime decline 58% in early 2025 compared to the same period the year before, suggesting that even states and cities with historically elevated property crime rates are participating meaningfully in the broader 2025 national improvement.
Regional Crime Patterns Across the US 2026
Violent Crime Rate by US Region (2024, per 100,000, illustrative)
South      |████████████████████████████████ Highest regional average
West       |███████████████████████████ Elevated, driven by AK/NM
Midwest    |████████████████████ Moderate
Northeast  |███████████████ Lowest regional average
| US Census Region | General Violent Crime Pattern | Representative High-Rate States |
|---|---|---|
| South | Consistently highest regional rate | Tennessee, Arkansas, Louisiana |
| West | Elevated, driven by specific states | Alaska, New Mexico, Colorado |
| Midwest | Moderate, wide internal variation | Missouri, Illinois |
| Northeast | Lowest regional average | Maine, New Hampshire, Connecticut |
Data Source: US Census Bureau Regional Classifications, FBI Uniform Crime Reporting Program
The South consistently records higher violent crime rates than any other US Census region, a pattern that has held for decades across multiple economic cycles and shows no sign of reversing even amid the broader 2025 national decline. States like Tennessee, Arkansas, and Louisiana anchor this Southern elevation, though researchers emphasize this reflects a complex mix of historically higher poverty rates, weaker social safety nets in several Southern states, and demographic and economic legacies tracing back generations rather than any single explanatory factor. The West shows a bifurcated pattern, with a handful of states, namely Alaska and New Mexico, posting exceptionally high rates that pull up the regional average even as other Western states like California and Utah sit closer to the national middle.
The Midwest presents the widest internal variation of any region, ranging from Missouri’s elevated rate to considerably safer states like Iowa and Minnesota within the same broad geographic and economic zone. The Northeast’s consistently low regional average, anchored by Maine, New Hampshire, Connecticut, and Rhode Island all appearing among the five safest states nationally, stands as the clearest regional pattern in the entire dataset. This concentration is significant enough that a resident moving from a typical Northeastern state to a typical Southern state faces a meaningfully different statistical crime environment purely based on that regional relocation, independent of which specific city or neighborhood they settle in.
Murder Rate by State and Major City in 2026
Murder Rate Change, Selected Major Cities (2024-2025)
Denver, CO     |████████████████████████████████████████ -41%
DC             |███████████████████████████████████████ -40%
Los Angeles    |██████████████████████████████████████ -39%
Chicago        |██████████████████████████████ -30%
New York City  |██████████ -10%
| City/Jurisdiction | 2024-2025 Homicide Change | Additional Context |
|---|---|---|
| Denver, CO | -41% | 37 total homicides in 2025 |
| Washington, D.C. | -40% | 187 homicides in 2024, down from 274 in 2023 |
| Los Angeles, CA | -39% | Historic reduction for the city |
| Chicago, IL | -30% | 49% below 2021 peak levels |
| New York City, NY | -10% | Continuing multi-year decline |
Data Source: Council on Criminal Justice Year-End 2025 Crime Trends Report, FBI Crime Data Explorer
State-level murder rates connect directly to dramatic city-level improvements documented in far greater detail in the Murder Rate Statistics in US report, which found that 31 of 35 major cities tracked by the Council on Criminal Justice recorded homicide declines in 2025. Denver posted the steepest drop among major cities at 41%, bringing its total to just 37 homicides for the entire year, while Washington, D.C., despite still carrying the highest overall violent crime rate of any state-equivalent jurisdiction, saw homicides fall 40% after peaking at 274 killings in 2023, its worst year since 1997.
These city-level murder trends often move independently of a state’s broader violent crime ranking, since a single large metro area can drive a disproportionate share of a state’s total homicide count. Los Angeles’s 39% decline and Chicago’s 30% drop, which brought the city 49% below its 2021 peak, both illustrate how the largest cities within otherwise moderate-ranking states can experience swings that outpace their state’s overall trend line. New York City’s more modest 10% reduction reflects the fact that the city had already achieved comparatively low crime rates before this latest wave of national improvement began, leaving less room for further dramatic percentage gains even as the absolute homicide count continued falling.
Crime by Race and Demographic Patterns 2026
Violent Crime Arrests by Race, US National (2024, latest breakdown)
White      |████████████████████████████████████████ 52.7%
Black      |████████████████████████████████████ 43.2%
Asian      |██ 2.0%
Other      |██ 2.1%
| Demographic Metric | Value (2024, Latest Available) |
|---|---|
| Total Violent Crime Arrests | 363,930 |
| Black Share of Violent Crime Arrests | 43.2% (vs. 13.7% of population) |
| White Share of Violent Crime Arrests | 52.7% (vs. 58.9% of population) |
| Black Homicide Victimization Rate | 22.4 per 100,000 |
| White Homicide Victimization Rate | 3.5 per 100,000 |
Data Source: FBI Uniform Crime Reporting Program, CDC Mortality Data (2024, most recent race-disaggregated breakdown)
State-level crime rates intersect with significant demographic disparities that require careful interpretation, detailed extensively in the Violent Crime by Race in US report. Black Americans accounted for 43.2% of violent crime arrests nationally in 2024, the most recent year with an official race breakdown, compared to representing 13.7% of the population, an overrepresentation ratio of roughly 3.2 times. On the victimization side, Black Americans faced a homicide victimization rate of 22.4 per 100,000, more than six times the White rate of 3.5 per 100,000, with state-level analysis showing this gap has widened dramatically in specific states, including Missouri, where the Black homicide victimization rate more than doubled from 30.7 to 65.7 per 100,000 between 2013 and 2022.
Importantly, these race-disaggregated figures still reflect 2024 data, since the FBI’s 2025 topline crime decline has not yet been broken out by race in any federal release, meaning it remains an open question whether the historic 2025 national improvement was distributed evenly across demographic groups or concentrated more heavily among some communities than others. Researchers studying these disparities consistently point to concentrated poverty, residential segregation, and differences in age structure across racial groups as significant correlates, cautioning against treating race itself as a standalone explanatory variable independent of these deeper structural and socioeconomic factors that vary considerably by state and region.
Firearm-Related Crime and State Gun Laws 2026
Fatal Shootings by State, per 100,000 (2025)
Louisiana     |████████████████████████████████████████ 12.1
Tennessee     |█████████████████████████ 7.6
Illinois      |███████████████████████ 7.1
Florida       |███████████████████ 5.8
National Avg  |██████████████ 4.3
| State | Fatal Shooting Rate (2025, per 100,000) | Total Deaths (2025) |
|---|---|---|
| Louisiana | 12.1 | 556 |
| Tennessee | 7.6 | 534 |
| Illinois | 7.1 | 891 |
| Florida | 5.8 | 1,289 |
| National Average | 4.3 | 14,655 (all states) |
Data Source: Gun Violence Archive, CDC WONDER Database
Firearm-related crime accounts for the large majority of violent crime severity differences between states, and state-level fatal shooting data shows patterns that partially, but not perfectly, mirror the broader violent crime rankings. Louisiana’s fatal shooting rate of 12.1 per 100,000 stands nearly three times the national average of 4.3, despite the state recording only 556 total deaths, illustrating how a comparatively small population state can post an outsized per-capita rate. States implementing stricter firearm regulations show measurably different outcomes: universal background check requirements, now active in 24 states covering roughly 45% of the US population, are associated with an estimated 8% reduction in gun homicides in states that have adopted them, while permit-to-purchase laws in 14 states show the strongest documented impact at an 11% reduction.
Nationally, fatal shooting deaths fell to 14,655 in 2025, the lowest total since 2015 and a 13.7% decline from 2024, a national trajectory covered in full in the Fatal Shooting Statistics in US report, even as firearm suicides continued a slower upward trajectory that runs somewhat counter to the broader positive trend in shooting homicides. State-level compliance with these firearm laws varies considerably, with extreme risk protection order laws showing only a 45% compliance rate despite documented effectiveness, suggesting that the gap between a state passing a law and that law being consistently applied on the ground remains a meaningful factor in explaining why some states with relatively strong gun regulations still post firearm crime rates above the national average.
State Policy Factors Driving Crime Rate Differences in 2026
Factors Correlated with Lower State Crime Rates (2026)
Community Violence Intervention Programs |███████████████████████ Strong evidence
Federal/State Funding for Prevention     |████████████████████ Significant
Permit-to-Purchase Firearm Laws          |█████████████████████ Strong evidence
Universal Background Checks              |████████████████ Moderate evidence
| Policy Factor | States Implementing | Estimated Impact |
|---|---|---|
| Community Violence Intervention Programs | 67 cities nationally | 15-30% reduction in target areas |
| Permit-to-Purchase Firearm Laws | 14 states | ~11% reduction in gun homicides |
| Universal Background Checks | 24 states | ~8% reduction in gun homicides |
| Extreme Risk Protection Order Laws | 21 states | ~10% reduction in firearm suicides/violence |
| American Rescue Plan Act Funding | All states, $362 billion total | Major contributing factor through 2025 |
Data Source: RAND State Firearm Law Database, Council on Criminal Justice Expert Analysis, Everytown Law Tracker
Researchers point to several concrete policy levers when explaining why some states have improved faster than others during the 2025 national crime decline. Community Violence Intervention programs, now operating in 67 cities and employing trained outreach workers to mediate conflicts before they escalate, show some of the strongest documented evidence of impact, achieving 15% to 30% reductions in violent crime within specifically targeted neighborhoods. Federal funding played a substantial supporting role nationally, with the American Rescue Plan Act’s $362 billion in state and local government aid helping stabilize municipal budgets and fund violence prevention programs during the critical 2021 through 2024 recovery period.
Firearm-specific policies show more variable but still meaningful effects: permit-to-purchase laws, now active in 14 states, demonstrate the strongest evidence among gun regulations at an estimated 11% reduction in gun homicides, ahead of universal background checks at roughly 8%. Experts caution that sustaining these state-level gains faces real headwinds heading into 2027 and beyond, since American Rescue Plan Act funds must be fully disbursed by the end of 2026, meaning states and cities that relied heavily on this federal support for violence prevention programming will need to identify replacement funding sources or risk losing ground on the historic progress achieved through 2025.
Crime Rates by State – Frequently Asked Questions
Which state has the highest violent crime rate in 2026? Alaska has the highest violent crime rate among states at 724.1 per 100,000 residents, though Washington, D.C., treated as a state-equivalent, posts an even higher rate of 1,005.5 per 100,000.
Which state has the lowest violent crime rate in 2026? Maine has the lowest violent crime rate in the country at 100.1 per 100,000 residents, followed closely by New Hampshire at 110.1.
Is crime going up or down in the US in 2026? Crime is falling sharply. National violent crime dropped 9.3% between 2024 and 2025, the largest single-year decline since the FBI began tracking estimates in 1936.
What is the national murder rate in 2026? The national murder rate stands at 4.1 per 100,000 residents, based on 2025 data, tied with 1955 and 1956 for the lowest rate ever recorded.
Which state has the highest property crime rate? New Mexico has the highest property crime rate at 2,751.1 per 100,000 residents, followed by Colorado, Washington, Oregon, and Louisiana.
How many states saw crime decrease in 2024? 46 of 50 states recorded a decrease in violent crime during 2024, with only 5 states seeing an increase.
Which region of the US has the highest crime rates? The South consistently records the highest regional violent crime rate, driven by states including Tennessee, Arkansas, and Louisiana.
How big is the gap between the safest and most dangerous states? The gap between Alaska, the most dangerous state, and Maine, the safest, is roughly 7.2 times, and the gap widens to 10 times when Washington, D.C. is included as a state-equivalent.
Does state gun legislation affect crime rates? Yes. States with permit-to-purchase firearm laws show an estimated 11% reduction in gun homicides, while universal background check states show roughly an 8% reduction.
What is driving the historic 2025 crime decline? Researchers cite post-pandemic economic stabilization, federal funding through the American Rescue Plan Act, expanded community violence intervention programs, and enhanced law enforcement activity as the leading contributing factors.
Disclaimer: This research report is compiled from publicly available FBI, Census Bureau, and criminal justice research sources. While reasonable efforts have been made to ensure accuracy, no representation or warranty is given as to the completeness or reliability of the information presented. We accept no liability for any errors, omissions, losses, or damages of any kind arising from the use of this report.