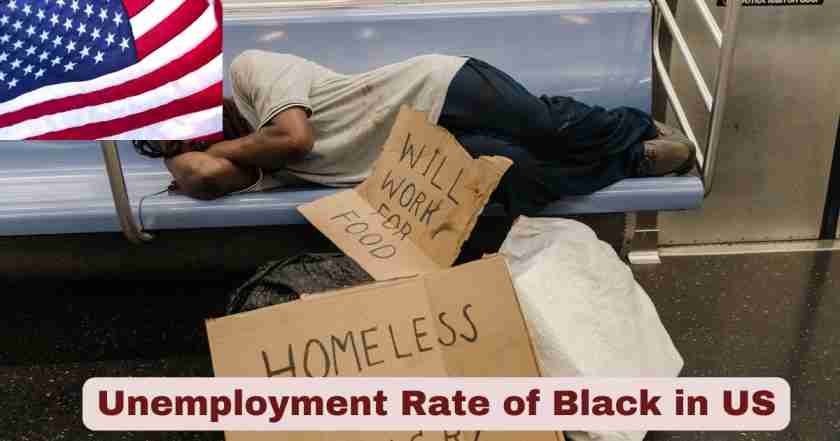
Unemployment Rate of Black in America 2025
The labor market landscape for Black workers in the United States during 2025 presents a complex picture that demands careful examination and understanding. While the broader American economy has shown resilience following the pandemic recovery period, Black Americans continue to face significantly higher unemployment rates compared to their white counterparts, revealing persistent disparities that have deep historical roots. The current employment situation reflects not just economic cycles, but systemic challenges that affect millions of Black families seeking financial stability and economic advancement. These disparities manifest across all education levels, age groups, and geographic regions, underscoring the multifaceted nature of employment inequality in contemporary America.
Throughout 2025, the data from the Bureau of Labor Statistics reveals alarming trends that suggest Black workers are experiencing deteriorating conditions even as the overall labor market shows signs of stabilization. The unemployment rate for Black Americans has climbed steadily from the beginning of the year, reaching levels not seen in several years and raising concerns among economists, policymakers, and community leaders. This upward trajectory in Black joblessness serves as what many economists describe as a “canary in the coal mine” for the broader economy, historically foreshadowing wider economic slowdowns. Understanding these statistics is crucial for developing effective policy interventions and supporting communities most affected by employment instability.
Interesting Facts About Black Unemployment Rate in the US 2025
| Fact Category | Key Statistics | Context & Significance |
|---|---|---|
| Current Overall Rate | 7.5% as of September 2025 | Highest level since October 2021, representing steady increases over three consecutive months |
| Peak in 2025 | 7.5% in August-September | Monthly increases from 6.0% in May to 6.8% in June, 7.2% in July, and 7.5% in August-September |
| Comparison to White Workers | Black unemployment 7.5% vs White 3.8% | Nearly double the white unemployment rate, maintaining historical 2-to-1 disparity ratio |
| Black-White Ratio | 1.8-to-1 nationally in Q2 2025 | Down slightly from 1.9-to-1 in Q1 2025, but still showing significant racial disparity |
| Black Women Impact | 265,000 fewer Black women employed | Compared to January 2025, with unemployment rising to 7.5% in September 2025 |
| Duration of Unemployment | Black women spend 18.5 weeks unemployed | 7.5 weeks longer than their 2024 median, and 8.2 weeks more than white men |
| Employment-Population Ratio | 76.6% for Black adults 25-54 | Down from historic high of 77.9% in 2024, representing significant decline |
| Labor Force Participation | 62.6% for Black Americans | As of August 2025, showing continued engagement despite employment challenges |
| State Variations | Highest: Washington DC at 10.3%, Michigan at 10.0% | Lowest: Alabama at 4.6%, South Dakota at 2.7% (smaller sample) |
| Long-Term Unemployed | 1.8 million Americans jobless 27+ weeks | Representing 23.6% of all unemployed people nationally |
Data Source: U.S. Bureau of Labor Statistics Employment Situation Reports (September 2025), Federal Reserve Economic Data (FRED), Economic Policy Institute State Unemployment Analysis (Q2 2025)
The facts presented in this table reveal several critical realities about Black unemployment in America during 2025. The most striking finding is the consistent pattern of Black unemployment rates being approximately double those of white workers, a disparity that has persisted for decades regardless of economic conditions or educational attainment levels. The 7.5% unemployment rate for Black Americans in September 2025 represents a significant deterioration from earlier in the year, when the rate stood at 6.0% in May. This four-month period of consecutive increases signals not just temporary volatility but a sustained worsening of labor market conditions for Black workers. The geographic variations are equally telling, with Washington DC experiencing a 10.3% Black unemployment rate and Michigan at 10.0%, while states like Alabama show 4.6% and South Dakota 2.7%, though these lower rates may reflect different local economic conditions and smaller sample sizes that require careful interpretation.
The impact on Black women has been particularly severe, with 265,000 fewer Black women employed in September compared to January 2025. These workers face longer unemployment durations of 18.5 weeks on average, compared to just 10.3 weeks for white men, meaning Black women spend nearly two additional months searching for employment. This extended jobless period creates cascading economic hardships, depleting savings, straining family resources, and making it increasingly difficult to maintain housing stability and meet basic needs. The employment-to-population ratio decline from 77.9% to 76.6% for prime-age Black workers represents hundreds of thousands of individuals who have either lost jobs or left the labor force entirely, reflecting a troubling reversal of gains made in previous years.
Monthly Black Unemployment Trends in the US 2025
| Month | Black Unemployment Rate | White Unemployment Rate | Hispanic Unemployment Rate | Overall US Rate | Black-White Gap |
|---|---|---|---|---|---|
| January 2025 | 6.1% | 3.3% | 4.9% | 4.1% | 2.8 percentage points |
| February 2025 | 6.0% | 3.2% | 4.8% | 4.0% | 2.8 percentage points |
| March 2025 | 6.2% | 3.3% | 5.0% | 4.1% | 2.9 percentage points |
| April 2025 | 6.1% | 3.4% | 5.1% | 4.2% | 2.7 percentage points |
| May 2025 | 6.0% | 3.3% | 4.9% | 4.1% | 2.7 percentage points |
| June 2025 | 6.8% | 3.6% | 5.2% | 4.1% | 3.2 percentage points |
| July 2025 | 7.2% | 3.7% | 5.0% | 4.3% | 3.5 percentage points |
| August 2025 | 7.5% | 3.7% | 5.4% | 4.4% | 3.8 percentage points |
| September 2025 | 7.5% | 3.8% | 5.5% | 4.4% | 3.7 percentage points |
Data Source: U.S. Bureau of Labor Statistics Current Population Survey, Employment Situation Monthly Reports (January-September 2025)
The monthly progression of unemployment rates throughout 2025 tells a concerning story of gradually worsening conditions for Black workers. Starting the year at 6.1% in January, the Black unemployment rate initially showed signs of improvement, dipping to 6.0% in February and May. However, beginning in June, a sharp upward trend emerged that has continued through September. The jump from 6.0% in May to 6.8% in June represents a significant 0.8 percentage point increase in just one month, followed by further increases to 7.2% in July and 7.5% in August and September. This three-month period of consecutive increases marks the most sustained deterioration in Black employment conditions in recent years, with the September rate of 7.5% representing the highest level since October 2021.
The comparative analysis with other racial groups highlights the persistent disparities that characterize the American labor market. White unemployment rates remained relatively stable throughout 2025, ranging from 3.2% to 3.8%, while Black unemployment increased by 1.5 percentage points from May to September. The Black-white unemployment gap expanded dramatically during this period, growing from 2.7 percentage points in May to 3.7 percentage points in September. Hispanic workers also experienced rising unemployment, though less severe than Black workers, moving from 4.9% in May to 5.5% in September. The overall US unemployment rate increased from 4.1% to 4.4%, but this aggregate figure masks the disproportionate impact on Black workers, whose rate remains nearly double that of white workers and significantly higher than the national average.
Black Unemployment Rate by Gender in the US 2025
| Gender Category | Q1 2025 Rate | Q2 2025 Rate | September 2025 | Labor Force Participation | Employment-Population Ratio |
|---|---|---|---|---|---|
| Black Men (20+ years) | 6.5% | 6.8% | 7.3% | 66.2% | 75.8% |
| Black Women (20+ years) | 6.0% | 6.4% | 7.5% | 63.4% | 57.2% |
| White Men (20+ years) | 3.2% | 3.1% | 3.6% | 68.8% | 77.2% |
| White Women (20+ years) | 3.1% | 3.0% | 3.5% | 57.1% | 71.4% |
| All Black Workers | 6.2% | 6.2% | 7.5% | 62.6% | 76.6% |
Data Source: U.S. Bureau of Labor Statistics Table A-2 Employment Status by Race, Sex, and Age (2025), Federal Reserve Economic Data
Gender-based analysis reveals important differences in how unemployment affects Black men and women, with both groups facing challenges but experiencing distinct patterns throughout 2025. Black men aged 20 and older maintained relatively stable unemployment rates in the first half of the year, with 6.5% in Q1 and 6.8% in Q2, before rising to 7.3% by September. Black women started with a lower unemployment rate of 6.0% in Q1 but experienced sharper increases, reaching 6.4% in Q2 and jumping to 7.5% by September 2025. This represents a particularly troubling trend for Black women, who have seen their employment situation deteriorate more rapidly than Black men during the latter part of 2025. The 265,000 decline in Black women’s employment from January to September reflects job losses concentrated in specific industries, particularly professional and business services, federal government positions, and manufacturing sectors.
The labor force participation and employment-population ratios provide additional context for understanding these unemployment figures. Black women maintain a 63.4% labor force participation rate, which is actually higher than white women’s 57.1%, demonstrating strong workforce attachment and desire for employment despite facing greater barriers to securing jobs. However, their employment-population ratio of 57.2% represents a four-year low, indicating that fewer Black women are successfully finding employment despite actively seeking work. Black men’s 66.2% labor force participation rate and 75.8% employment-population ratio show somewhat more stability compared to Black women, though both remain lower than their white male counterparts who have 68.8% participation and 77.2% employment-population ratios. These disparities persist even when controlling for education, age, and other demographic factors, pointing to systemic barriers beyond individual qualifications or effort.
State-Level Black Unemployment Rates in the US 2025 Q2
| State/Region | Black Unemployment Rate | White Unemployment Rate | Black-White Ratio | State Overall Rate | Ranking |
|---|---|---|---|---|---|
| Washington DC | 10.3% | 3.0% | 3.4-to-1 | 5.9% | Highest disparity |
| Michigan | 10.0% | 3.3% | 3.0-to-1 | 4.6% | 2nd highest rate |
| Kentucky | 9.5% | 3.1% | 3.1-to-1 | 4.3% | 3rd highest rate |
| Illinois | 8.7% | 3.5% | 2.5-to-1 | 4.8% | Above national avg |
| Mississippi | 8.4% | 3.2% | 2.6-to-1 | 3.9% | Above national avg |
| California | 7.8% | 5.0% | 1.5-to-1 | 5.2% | Lowest ratio (large state) |
| New Jersey | 7.5% | 5.0% | 1.5-to-1 | 5.3% | Lowest ratio (large state) |
| Alabama | 4.6% | 3.1% | 1.5-to-1 | 3.2% | Lowest rate (large Black pop) |
| Maryland | 4.8% | 2.5% | 1.9-to-1 | 2.8% | Low rate |
| South Dakota | 2.7% | 1.4% | 1.9-to-1 | 1.9% | Lowest overall (small sample) |
| National Average | 6.2% | 3.4% | 1.8-to-1 | 4.2% | Q2 2025 |
Data Source: Economic Policy Institute State Unemployment by Race and Ethnicity Analysis (Q2 2025), Bureau of Labor Statistics Local Area Unemployment Statistics
Geographic variations in Black unemployment rates across the United States reveal stark regional disparities that reflect different economic conditions, industrial compositions, and labor market dynamics. The highest Black unemployment rates in Q2 2025 were found in Washington DC at 10.3%, Michigan at 10.0%, and Kentucky at 9.5%, with these jurisdictions showing unemployment levels significantly above the national Black average of 6.2%. Washington DC’s exceptionally high rate is partly attributed to federal workforce reductions that have disproportionately affected Black workers, who are overrepresented in government positions. Michigan’s manufacturing-dependent economy has faced ongoing challenges, while Kentucky’s elevated rates reflect regional economic struggles in traditional industries. Illinois at 8.7% and Mississippi at 8.4% also recorded Black unemployment rates well above the national average, indicating concentrated economic hardship in these states.
Conversely, several states demonstrated lower Black unemployment rates, though the reasons vary considerably. Alabama recorded the lowest Black unemployment rate among states with sufficiently large Black populations for precise statistical estimation at 4.6%, followed by Maryland at 4.8%. However, economists caution that Alabama’s low rate may reflect complex labor market dynamics including workforce discouragement rather than purely positive employment conditions. California and New Jersey, despite having higher overall unemployment rates due to larger economies and diverse populations, showed the smallest Black-white unemployment ratios at 1.5-to-1, suggesting relatively better racial parity in employment opportunities. The national Black-white unemployment ratio of 1.8-to-1 in Q2 2025 represents a slight improvement from 1.9-to-1 in Q1, though no state achieved true employment parity where Black and white workers face equal unemployment rates. These geographic disparities underscore how local economies, industry concentrations, historical factors, and policy environments combine to create vastly different employment landscapes for Black workers across America.
Black Unemployment by Age Group in the US 2025
| Age Category | Black Unemployment Rate | White Unemployment Rate | Overall Rate | Labor Force Participation | Key Characteristics |
|---|---|---|---|---|---|
| 16-19 years | 18.7% | 11.2% | 13.2% | 32.4% | Highest unemployment, entry-level challenges |
| 20-24 years | 12.8% | 6.9% | 8.2% | 68.9% | College-age, early career establishment |
| 25-34 years | 8.2% | 3.4% | 4.9% | 82.1% | Prime working age, career building |
| 35-44 years | 6.4% | 2.8% | 3.7% | 84.3% | Peak employment years |
| 45-54 years | 6.1% | 2.9% | 3.6% | 81.7% | Experienced workers |
| 55-64 years | 5.8% | 3.1% | 3.4% | 65.2% | Pre-retirement, established careers |
| 65+ years | 4.9% | 2.7% | 3.2% | 19.8% | Supplemental employment |
Data Source: U.S. Bureau of Labor Statistics Current Population Survey Age-Specific Data (2025)
Age-based unemployment patterns reveal how employment barriers affect Black Americans differently across the lifecycle, with younger workers facing the most severe challenges. Black teenagers aged 16-19 experience an 18.7% unemployment rate, which is 1.7 times higher than white teenagers at 11.2% and well above the overall teenage unemployment rate of 13.2%. This extraordinarily high youth unemployment reflects multiple barriers including limited work experience, discrimination in entry-level hiring, educational disparities, and fewer professional network connections. Young Black adults aged 20-24 face a 12.8% unemployment rate, nearly double the 6.9% rate for white workers in the same age group, creating significant obstacles to establishing career foundations and achieving financial independence during crucial early adult years.
The unemployment disparities persist but narrow somewhat for prime working-age Black Americans, though significant gaps remain. Black workers aged 25-34 experience 8.2% unemployment compared to 3.4% for whites, while those aged 35-44 face 6.4% unemployment versus 2.8% for whites, and the 45-54 age group sees 6.1% versus 2.9%. Even in their peak earning and career advancement years, Black workers face unemployment rates consistently more than double those of white workers with similar age profiles. The slightly lower unemployment rates for older Black workers aged 55-64 at 5.8% and 65+ at 4.9% partly reflect survivor bias, as these groups represent workers who successfully maintained employment throughout their careers, while those who faced sustained unemployment may have exited the labor force entirely. The lower labor force participation rate of 19.8% for workers 65 and older reflects retirement patterns, though Black seniors often continue working longer due to economic necessity and inadequate retirement savings accumulated over careers marked by lower wages and interrupted employment.
Black Unemployment by Education Level in the US 2025
| Educational Attainment | Black Unemployment Rate | White Unemployment Rate | Black-White Ratio | Median Weeks Unemployed | Labor Force Participation |
|---|---|---|---|---|---|
| Less than High School | 14.2% | 6.8% | 2.1-to-1 | 22.4 weeks | 48.3% |
| High School Graduate | 9.6% | 4.2% | 2.3-to-1 | 16.8 weeks | 64.7% |
| Some College/Associate | 7.3% | 3.5% | 2.1-to-1 | 14.2 weeks | 72.4% |
| Bachelor’s Degree | 4.8% | 2.1% | 2.3-to-1 | 12.6 weeks | 86.2% |
| Advanced Degree | 3.6% | 1.7% | 2.1-to-1 | 10.4 weeks | 89.7% |
| All Education Levels | 7.5% | 3.8% | 2.0-to-1 | 18.5 weeks (Black women) | 62.6% |
Data Source: U.S. Bureau of Labor Statistics Educational Attainment Tables (2025), Current Population Survey
Educational attainment significantly influences employment outcomes, yet persistent racial disparities exist at every education level, challenging the notion that education alone can eliminate employment inequality. Black Americans without a high school diploma face a devastating 14.2% unemployment rate compared to 6.8% for whites with similar education levels, representing a 2.1-to-1 ratio. These workers spend an average of 22.4 weeks unemployed when job searching, nearly half a year without income, creating severe economic hardship. High school graduates see unemployment rates of 9.6% for Black workers versus 4.2% for whites, maintaining a 2.3-to-1 ratio that actually represents the largest educational disparity. Black workers with some college education or associate degrees experience 7.3% unemployment compared to 3.5% for whites, demonstrating that partial higher education provides benefits but doesn’t eliminate racial employment gaps.
Most remarkably, even Black Americans with bachelor’s degrees face 4.8% unemployment compared to just 2.1% for white college graduates, a 2.3-to-1 ratio that equals or exceeds the disparity at lower education levels. This means a Black college graduate is more than twice as likely to be unemployed as a white college graduate, and the 4.8% Black college graduate unemployment rate is higher than the 4.2% rate for white high school graduates, effectively erasing the employment advantage of four years of higher education when race is considered. Black workers with advanced degrees fare better at 3.6% unemployment but still face 2.1-to-1 disparity compared to whites with advanced degrees at 1.7%. These persistent gaps across all education levels provide compelling evidence that factors beyond individual qualifications, such as discrimination, network disparities, and structural barriers, significantly impact Black employment outcomes regardless of educational achievement.
Industry Distribution of Black Employment in the US 2025
| Industry Sector | Black Workers Employed | Share of Black Workforce | Average Unemployment Rate | Year-Over-Year Change |
|---|---|---|---|---|
| Healthcare & Social Assistance | 2.8 million | 16.2% | 4.9% | +2.3% growth |
| Retail Trade | 2.1 million | 12.1% | 8.7% | -1.2% decline |
| Transportation & Warehousing | 1.9 million | 11.0% | 9.8% | -3.2% decline |
| Educational Services | 1.7 million | 9.8% | 4.2% | +1.1% growth |
| Professional & Business Services | 1.6 million | 9.2% | 10.4% | -4.1% decline |
| Public Administration | 1.4 million | 8.1% | 6.3% | -2.4% decline |
| Accommodation & Food Services | 1.3 million | 7.5% | 11.2% | +3.8% growth |
| Manufacturing | 1.2 million | 6.9% | 8.9% | -1.9% decline |
| Financial Activities | 0.9 million | 5.2% | 5.7% | -0.8% stable |
| Other Industries | 2.4 million | 13.9% | 7.8% | Various |
Data Source: U.S. Bureau of Labor Statistics Current Employment Statistics, Industry Employment Data (2025)
The distribution of Black workers across industries reveals concentration patterns that significantly influence overall unemployment experiences and economic vulnerability. Healthcare and social assistance employs the largest share of Black workers at 2.8 million people representing 16.2% of the Black workforce, with this sector showing 2.3% growth year-over-year and a relatively moderate 4.9% unemployment rate. Educational services similarly provides stable employment for 1.7 million Black workers with low 4.2% unemployment and slight growth. However, several industries with significant Black employment have experienced severe contractions in 2025. Transportation and warehousing, which employs 1.9 million Black workers (11.0% of the workforce), has seen 3.2% decline and faces 9.8% unemployment, reflecting the impact of trade policies and economic slowdown on logistics industries.
Professional and business services represents a particularly concerning area, with 1.6 million Black workers experiencing 4.1% employment decline and facing 10.4% unemployment. Within this broad sector, employment services has been decimated with 3.2% year-over-year losses concentrated in human resources positions where Black women are substantially represented. Public administration has shed 2.4% of Black workers, reflecting federal workforce reductions that disproportionately affect Black employees who have historically found stable government employment at 8.1% of the Black workforce. Manufacturing continues its long-term decline with 1.9% losses and 8.9% unemployment for Black workers. The accommodation and food services industry, while adding jobs with 3.8% growth, offers the highest unemployment rate at 11.2% and typically provides lower wages and fewer benefits, representing precarious employment despite numerical growth. This industry concentration pattern leaves Black workers overexposed to sectors experiencing contraction while underrepresented in high-growth, high-wage technology and professional fields.
Historical Comparison Black Unemployment in the US 2020-2025
| Year/Period | Black Unemployment Rate | White Unemployment Rate | Black-White Ratio | Economic Context |
|---|---|---|---|---|
| 2020 Pre-Pandemic (Feb) | 6.0% | 3.1% | 1.9-to-1 | Strong pre-COVID economy |
| 2020 Pandemic Peak (May) | 16.8% | 12.4% | 1.4-to-1 | Lockdowns, economic collapse |
| 2021 Recovery (Dec) | 7.1% | 3.2% | 2.2-to-1 | Initial recovery phase |
| 2022 Tightening (Dec) | 5.7% | 3.1% | 1.8-to-1 | Labor market tightening |
| 2023 Stabilization (Dec) | 5.2% | 3.3% | 1.6-to-1 | Inflation concerns, Fed action |
| 2024 Peak Employment (Annual Avg) | 5.3% | 3.2% | 1.7-to-1 | Historic low for Black unemployment |
| 2025 Q1 | 6.2% | 3.3% | 1.9-to-1 | Economic softening begins |
| 2025 Q2 | 6.2% | 3.4% | 1.8-to-1 | Continued softening |
| 2025 September (Current) | 7.5% | 3.8% | 2.0-to-1 | Concerning deterioration |
Data Source: Federal Reserve Economic Data Historical Series, Bureau of Labor Statistics Employment Situation Archives (2020-2025)
Historical context reveals that the 7.5% Black unemployment rate in September 2025 represents a significant reversal from the progress achieved in recent years. In 2024, Black workers experienced historically low unemployment averaging 5.3% for the year, with the employment-to-population ratio for prime-age Black workers reaching an all-time high of 77.9%. This progress resulted from extremely tight labor market conditions that forced employers to broaden hiring practices and provided Black workers with unprecedented opportunities. However, 2025 has witnessed steady erosion of these gains, with Black unemployment climbing 2.2 percentage points from the 2024 average to the September 2025 level, effectively wiping out years of progress in less than one year.
The current 7.5% rate remains below the pandemic peak of 16.8% in May 2020 but represents the highest level since October 2021 when unemployment stood at 7.6%. The Black-white unemployment ratio has widened to 2.0-to-1 in September 2025, returning to the long-standing historical pattern where Black unemployment is approximately double that of whites. This ratio had briefly narrowed to 1.6-to-1 in 2023, but recent deterioration has reversed that progress. The pattern confirms what economists have long observed: Black workers are typically “last hired, first fired,” benefiting most during extremely tight labor markets but suffering disproportionately when economic conditions soften. The 1.3 percentage point increase from Q1 to September 2025 occurred over just eight months, representing one of the fastest deteriorations in Black employment conditions outside of recession periods, raising serious concerns about the trajectory for the remainder of 2025 and into 2026.
Economic Impact and Duration of Black Unemployment in the US 2025
| Unemployment Duration | Black Workers (thousands) | Share of Black Unemployed | White Workers (thousands) | Average Duration (weeks) |
|---|---|---|---|---|
| Less than 5 weeks | 412 | 26.8% | 789 | 3.2 weeks |
| 5-14 weeks | 478 | 31.1% | 1,124 | 9.4 weeks |
| 15-26 weeks | 324 | 21.1% | 687 | 20.1 weeks |
| 27+ weeks (long-term) | 322 | 21.0% | 1,478 | 46.8 weeks |
| Total Unemployed | 1,536 | 100% | 3,078 | 18.5 weeks (Black women) |
| Median Duration | — | — | — | 10 weeks overall |
Data Source: Bureau of Labor Statistics Table A-12 Unemployed Persons by Duration (September 2025)
The duration of unemployment provides crucial insight into the severity and persistence of joblessness affecting Black workers, with significant implications for household finances and long-term economic security. Approximately 322,000 Black workers, representing 21.0% of all unemployed Black Americans, have been jobless for 27 weeks or longer, meaning they have spent more than six months searching for employment without success. This long-term unemployment is particularly devastating because many states limit unemployment insurance benefits to 26 weeks, leaving these workers without any income support precisely when their financial resources are most exhausted. Black women specifically face median unemployment durations of 18.5 weeks, substantially longer than the overall median of 10 weeks and 8.2 weeks longer than white men, creating additional economic hardship for families that often depend on their income.
The extended duration of unemployment for Black workers compounds the immediate economic harm of job loss through several mechanisms. Workers unemployed for more than six months often face employer discrimination based on employment gaps, making reemployment even more difficult and creating vicious cycles of extended joblessness. Prolonged unemployment depletes savings, damages credit ratings, strains family relationships, and can lead to housing instability or homelessness. For the 478,000 Black workers unemployed between 5-14 weeks and 324,000 unemployed 15-26 weeks, the risk of sliding into long-term unemployment looms large as the job market softens. The concentration of 26.8% of Black unemployed workers in the under-5-weeks category suggests continuous new job losses rather than successful reemployment, indicating a deteriorating rather than improving labor market for Black Americans throughout 2025.
Policy Implications and Labor Market Outlook for Black Employment in the US 2025-2026
| Policy Area | Current Challenge | Affected Black Workers | Potential Impact | Implementation Status |
|---|---|---|---|---|
| Federal Workforce Reductions | 97,000 government jobs lost since January 2025 | Disproportionate Black representation | High negative impact | Ongoing cuts |
| Trade Policy & Tariffs | Manufacturing and logistics disruption | 1.9M in transportation/warehousing | Medium-high impact | Policy uncertainty |
| Healthcare Funding | Clinic and hospital closures threatened | 2.8M in healthcare sector | Potential high impact | Budget negotiations |
| Employment Services | 3.2% decline in HR and staffing jobs | Black women overrepresented | High negative impact | Private sector driven |
| Unemployment Insurance | 26-week limit with 21% long-term unemployed | 322,000 long-term unemployed | Critical support gap | State-level variation |
| Job Training Programs | Insufficient funding and access | All unemployed seeking skills | Medium positive potential | Limited implementation |
| Anti-Discrimination Enforcement | EEOC resource constraints | All Black job seekers | Long-term systemic impact | Enforcement challenges |
Data Source: Bureau of Labor Statistics, Economic Policy Institute Analysis, Center for American Progress (2025)
The policy environment and economic outlook for Black workers remains concerning as 2025 progresses, with multiple simultaneous challenges converging to worsen employment prospects. Federal workforce reductions have eliminated approximately 97,000 government positions since January 2025, with Black workers bearing disproportionate impact due to their higher representation in federal employment at 8.1% of the Black workforce. These cuts affect not just the workers directly laid off but also contract workers, consultants, and service providers who support government operations. Trade policy uncertainty and tariff implementations have disrupted manufacturing supply chains and logistics operations, threatening the 1.9 million Black workers employed in transportation and warehousing sectors that depend on stable trade flows. Healthcare funding debates create additional uncertainty for the 2.8 million Black workers in healthcare and social assistance, with potential clinic and hospital closures particularly affecting rural and urban communities where Black healthcare workers are concentrated.
The private sector employment services industry, which has contracted by 3.2% year-over-year, plays a critical role in connecting job seekers with employment opportunities, and its decline reduces pathways to employment precisely when Black workers need them most. The 322,000 Black workers who have been unemployed for 27 weeks or longer face the expiration of unemployment insurance benefits in most states, creating acute financial crises for families without income support. Economist projections for late 2025 and early 2026 suggest continued softening of labor market conditions, with some forecasting overall US unemployment could reach 5.0% by mid-2026, which would likely push Black unemployment above 9.0% if historical patterns hold. The Federal Reserve’s monetary policy stance, inflation trajectory, and potential economic slowdown all point toward challenging employment conditions continuing for Black workers, requiring urgent policy interventions to prevent further deterioration and support affected communities through this difficult period.
Regional Metropolitan Black Unemployment in the US 2025
| Metropolitan Area | Black Unemployment Rate | White Unemployment Rate | Black-White Gap | Black Population Share | Key Industries |
|---|---|---|---|---|---|
| Detroit-Warren-Dearborn, MI | 11.8% | 3.7% | 8.1 points | 22.6% | Auto manufacturing, healthcare |
| Chicago-Naperville-Elgin, IL-IN-WI | 10.2% | 3.9% | 6.3 points | 16.8% | Finance, manufacturing, logistics |
| Milwaukee-Waukesha, WI | 9.8% | 3.2% | 6.6 points | 16.3% | Manufacturing, healthcare |
| Philadelphia-Camden-Wilmington, PA-NJ-DE-MD | 8.9% | 4.1% | 4.8 points | 20.2% | Healthcare, education, finance |
| Baltimore-Columbia-Towson, MD | 8.4% | 3.5% | 4.9 points | 29.4% | Government, healthcare, logistics |
| Memphis, TN-MS-AR | 8.1% | 3.8% | 4.3 points | 46.7% | Logistics, healthcare, distribution |
| Cleveland-Elyria, OH | 7.8% | 4.0% | 3.8 points | 18.9% | Healthcare, manufacturing |
| Atlanta-Sandy Springs-Alpharetta, GA | 6.7% | 3.2% | 3.5 points | 33.5% | Corporate headquarters, logistics |
| Houston-The Woodlands-Sugar Land, TX | 6.4% | 3.6% | 2.8 points | 16.9% | Energy, healthcare, logistics |
| Washington-Arlington-Alexandria, DC-VA-MD-WV | 5.8% | 2.9% | 2.9 points | 25.2% | Federal government, professional services |
Data Source: Bureau of Labor Statistics Metropolitan Area Employment and Unemployment (2025), U.S. Census Bureau Metropolitan Statistical Area Data
Metropolitan-level analysis reveals dramatic variations in Black employment outcomes across major urban centers, reflecting distinct local economic conditions, industry compositions, and labor market dynamics. The Detroit metropolitan area experiences the highest Black unemployment rate at 11.8%, nearly triple the white unemployment rate of 3.7% in the same region, creating an 8.1 percentage point gap that represents the most severe metropolitan racial employment disparity in the nation. Detroit’s struggles reflect the ongoing challenges facing the automotive manufacturing sector, which has shed jobs due to automation, electrification transitions, and trade policy uncertainties. Chicago follows with 10.2% Black unemployment compared to 3.9% white unemployment, while Milwaukee records 9.8% versus 3.2%, demonstrating how Midwest industrial cities continue facing concentrated Black joblessness even as their overall economies show signs of recovery.
Sunbelt metropolitan areas generally show lower Black unemployment rates but maintain significant racial gaps. Atlanta, a major economic hub with 33.5% Black population share, records 6.7% Black unemployment compared to 3.2% white unemployment, representing a 3.5 percentage point gap. Houston shows 6.4% Black unemployment versus 3.6% white unemployment, benefiting from diverse energy and healthcare sectors. Washington DC metropolitan area, despite the federal workforce reductions, maintains relatively lower Black unemployment at 5.8% compared to other major metros, though this represents an increase from earlier in 2025 and the 2.9 percentage point gap with white workers persists. Memphis stands out with a 46.7% Black population share, the highest among major metros, facing 8.1% Black unemployment concentrated in the logistics sector that has contracted significantly. These metropolitan disparities demonstrate how Black unemployment is not a monolithic national phenomenon but rather reflects concentrated challenges in specific regional economies, requiring tailored local interventions alongside national policy responses.
Black Youth Unemployment and Education Transitions in the US 2025
| Youth Category (16-24 years) | Black Rate | White Rate | Hispanic Rate | Not Enrolled & Unemployed | Enrollment Status Impact |
|---|---|---|---|---|---|
| 16-19, In School | 22.4% | 13.8% | 16.2% | Not applicable | School attachment reduces unemployment |
| 16-19, Not in School | 28.7% | 18.4% | 21.3% | 156,000 | Disconnected youth, highest risk |
| 20-24, Enrolled in College | 14.2% | 8.1% | 10.6% | Not applicable | Student employment challenges |
| 20-24, Not Enrolled | 16.9% | 9.3% | 11.8% | 287,000 | Career establishment barriers |
| 20-24, Recent Graduates | 10.8% | 5.2% | 7.4% | 89,000 | Credential doesn’t eliminate gap |
| Overall Youth (16-24) | 17.2% | 10.4% | 12.8% | 532,000 | Critical transition period |
Data Source: Bureau of Labor Statistics School Enrollment Supplement (2025), National Center for Education Statistics
Youth unemployment represents one of the most critical dimensions of Black joblessness, as early career experiences fundamentally shape long-term economic trajectories and lifetime earnings potential. Black teenagers aged 16-19 who are not enrolled in school face a devastating 28.7% unemployment rate, meaning more than one in four young Black Americans in this category cannot find work despite actively seeking employment. This 156,000 young people represent a disconnected population at extremely high risk for long-term economic marginalization, involvement in underground economies, and other negative outcomes. Even Black teenagers still enrolled in school experience 22.4% unemployment when seeking part-time or summer employment, compared to 13.8% for white students, limiting their ability to gain work experience, earn spending money, and begin building professional skills and networks that facilitate career success.
The challenges persist into young adulthood, with Black Americans aged 20-24 facing 16.9% unemployment if not enrolled in college, compared to 9.3% for whites in the same category. Perhaps most troubling, recent Black college graduates face 10.8% unemployment compared to just 5.2% for white recent graduates, demonstrating that educational credentials provide only partial protection against employment discrimination and structural barriers. The 287,000 Black young adults aged 20-24 who are neither enrolled in education nor successfully employed represent a tremendous waste of human potential and a critical policy failure. Youth unemployment creates scarring effects that persist throughout careers, reducing lifetime earnings, limiting career advancement, and increasing vulnerability to future unemployment. The 532,000 Black young people aged 16-24 who are not enrolled in school and currently unemployed require immediate targeted interventions including subsidized employment programs, apprenticeships, skills training, and removal of barriers like transportation access and criminal background checks that disproportionately exclude young Black job seekers from employment opportunities.
Black Underemployment and Discouraged Workers in the US 2025
| Employment Status Category | Black Workers (thousands) | Percentage | White Workers (thousands) | Comparison |
|---|---|---|---|---|
| Officially Unemployed (U-3) | 1,536 | 7.5% | 3,078 | 3.8% white rate |
| Marginally Attached to Labor Force | 342 | +1.7 points | 478 | +0.6 points white |
| Discouraged Workers | 187 | +0.9 points | 234 | +0.3 points white |
| Part-Time for Economic Reasons | 687 | +3.4 points | 1,245 | +1.6 points white |
| U-6 Underemployment Rate | 2,752 | 13.5% | 5,035 | 6.3% white |
| Working Part-Time, Want Full-Time | 687 | 43.2% of part-time | 1,245 | 38.7% of part-time |
| Multiple Job Holders by Necessity | 423 | 2.1% of employed | 892 | 1.2% of employed |
Data Source: Bureau of Labor Statistics Alternative Measures of Labor Underutilization (U-6), Table A-15 (September 2025)
The official unemployment rate of 7.5% for Black Americans significantly understates the true scope of employment challenges by excluding several categories of workers who face labor market difficulties. The broader U-6 measure of labor underutilization, which includes not just the officially unemployed but also marginally attached workers and those working part-time for economic reasons, reveals a 13.5% underemployment rate for Black workers compared to 6.3% for whites, more than doubling the apparent disparity. An additional 342,000 Black workers are marginally attached to the labor force, meaning they want work and are available but have not actively searched in the past four weeks, often due to discouragement, transportation barriers, childcare challenges, or belief that no jobs are available for them. Within this group, 187,000 are specifically classified as discouraged workers who have given up job searching because they believe no jobs exist for which they would be hired, often reflecting experiences of discrimination or repeated rejection.
The 687,000 Black workers employed part-time for economic reasons represent individuals who want and are available for full-time work but can only find part-time positions, or whose hours have been cut by employers reducing labor costs. These workers face not just reduced income but typically lack employer-provided health insurance, retirement benefits, and paid leave, creating economic insecurity despite being counted as employed. The fact that 43.2% of Black part-time workers would prefer full-time employment, compared to 38.7% of white part-time workers, indicates involuntary underemployment disproportionately affects Black workers. Additionally, approximately 423,000 Black workers hold multiple jobs out of economic necessity rather than choice, working 2.1% of all employed Black Americans compared to 1.2% for whites, because their primary job does not provide sufficient income to meet basic needs. These multiple dimensions of underemployment reveal that the challenges facing Black workers extend far beyond the 1.5 million officially counted as unemployed to encompass nearly 2.8 million experiencing unemployment, underemployment, or labor force marginalization, representing 13.5% of the Black labor force facing substantial employment-related economic hardship in 2025.
Occupational Distribution and Black Unemployment Patterns in the US 2025
| Occupational Category | Black Employment Share | Unemployment Rate | Median Weekly Earnings | Year-Over-Year Change | White Comparison Rate |
|---|---|---|---|---|---|
| Management, Business, Financial | 8.4% | 4.2% | $1,287 | -1.8% | 2.1% white unemployment |
| Computer & Mathematical | 7.2% | 3.8% | $1,542 | +0.4% | 2.3% white unemployment |
| Healthcare Practitioners | 12.1% | 3.6% | $1,318 | +1.2% | 1.9% white unemployment |
| Education, Training, Library | 10.8% | 4.9% | $1,156 | -0.6% | 2.4% white unemployment |
| Office & Administrative Support | 13.6% | 6.8% | $842 | -2.3% | 3.7% white unemployment |
| Healthcare Support | 18.4% | 7.2% | $687 | +0.8% | 4.1% white unemployment |
| Transportation & Material Moving | 19.2% | 10.8% | $734 | -4.2% | 5.2% white unemployment |
| Production | 11.7% | 9.4% | $798 | -3.6% | 4.8% white unemployment |
| Food Preparation & Serving | 12.8% | 12.6% | $612 | +2.1% | 6.9% white unemployment |
| Building & Grounds Maintenance | 14.3% | 8.9% | $687 | -1.4% | 4.6% white unemployment |
Data Source: Bureau of Labor Statistics Occupational Employment Statistics (2025), Current Population Survey Earnings Data
Occupational patterns reveal how Black workers’ concentration in specific job categories contributes to overall unemployment vulnerability and earnings disparities. Black workers are significantly overrepresented in several occupational categories that have experienced substantial job losses during 2025. Transportation and material moving occupations employ 19.2% Black workers, well above the 13.5% Black share of the overall workforce, and this sector faces 10.8% unemployment with 4.2% year-over-year employment decline. Production occupations show 11.7% Black employment with 9.4% unemployment and 3.6% job losses. Food preparation and serving, with 12.8% Black representation, experiences 12.6% unemployment, the highest among major occupational categories, though this sector has added jobs with 2.1% growth as the economy reopened further, these positions typically offer the lowest earnings at just $612 median weekly wages.
Black workers remain underrepresented in the highest-paying, lowest-unemployment occupations. Computer and mathematical occupations employ only 7.2% Black workers despite offering $1,542 median weekly earnings and experiencing 3.8% unemployment with slight 0.4% growth. Management, business, and financial operations show 8.4% Black representation with 4.2% unemployment, substantially higher than the 2.1% white unemployment rate in these prestigious occupations. Even within the same occupational categories, Black workers face approximately double the unemployment rates of white workers, demonstrating that occupational segregation and within-occupation discrimination both contribute to employment disparities. Healthcare practitioners, where Black workers have 12.1% representation and relatively strong $1,318 weekly earnings, show 3.6% Black unemployment compared to just 1.9% for whites in the same occupation. The combination of overrepresentation in vulnerable, lower-wage occupations and higher unemployment rates within all occupational categories creates compounding disadvantages that explain much of the Black-white employment and earnings gap observed in 2025.
Long-Term Unemployment Consequences for Black Workers in the US 2025
| Impact Category | Black Workers Affected | Severity Measure | Economic Loss | Recovery Timeline |
|---|---|---|---|---|
| Immediate Income Loss | 1.5 million unemployed | 100% income loss during unemployment | $897 weekly median (pre-unemployment) | None until reemployment |
| Savings Depletion | 1.1 million (72% lack emergency funds) | Median $800 savings depleted in 3-4 weeks | $2,400-3,200 average | 3-5 years to rebuild |
| Lost Retirement Contributions | 1.5 million missing contributions | 6+ months without 401k contributions | $3,600 annual loss | Permanent lifetime impact |
| Health Insurance Loss | 687,000 lost employer coverage | COBRA unaffordable for 82% | $7,200 annual value | Until new employer coverage |
| Credit Score Damage | 892,000 with late/missed payments | 50-120 point credit score decline | Reduced borrowing power | 2-4 years to recover |
| Housing Instability | 234,000 at risk of eviction/foreclosure | 3+ months behind on housing costs | Loss of equity, eviction costs | 5-7 years rental history damage |
| Wage Scarring | All reemployed workers | 10-15% lower wages upon reemployment | $4,500-6,750 annual permanent loss | Lifetime earnings reduction |
Data Source: Bureau of Labor Statistics, Federal Reserve Survey of Household Economics (2025), Urban Institute Housing Analysis
The economic consequences of unemployment extend far beyond the immediate loss of wages, creating cascading financial hardships that can persist for years or even permanently damage lifetime economic trajectories. For the 1.5 million unemployed Black Americans, the immediate loss of income averaging $897 per week translates to $3,588 monthly income loss for a household that likely already had minimal financial cushion. Research shows approximately 72% of Black households lack sufficient emergency savings to cover three months of expenses, meaning 1.1 million unemployed Black workers exhaust their limited savings within the first month of joblessness. Unemployment insurance benefits, when available, typically replace only 40-50% of prior wages and expire after 26 weeks in most states, leaving the 322,000 long-term unemployed Black workers completely without income support while still facing housing costs, utilities, food expenses, and other necessities.
The loss of employer-provided health insurance affects approximately 687,000 unemployed Black workers who had coverage through their jobs, with COBRA continuation coverage costing an average $600 per month for individual coverage or $1,800 for family coverage, amounts that are completely unaffordable for unemployed households. The resulting $7,200 annual value loss forces families to forgo necessary medical care, skip prescriptions, and delay treatment, creating health consequences that extend beyond the unemployment period. Credit score damage affects 892,000 Black unemployed workers who miss credit card, auto loan, or other debt payments, with late payments causing 50-120 point credit score declines that limit future borrowing capacity and increase interest rates for years. Housing instability threatens approximately 234,000 Black unemployed workers who fall three or more months behind on rent or mortgage payments, facing eviction or foreclosure proceedings that create housing instability, damage rental histories, and can lead to homelessness. Perhaps most devastating is wage scarring, where workers who experience unemployment, particularly long-term unemployment, face 10-15% lower wages upon reemployment compared to their prior jobs, representing $4,500-6,750 annual permanent income loss that compounds over remaining career years, reducing lifetime earnings by hundreds of thousands of dollars and limiting retirement security.
Comparative Racial Unemployment Disparities in the US 2025
| Racial/Ethnic Group | September 2025 Rate | Labor Force (millions) | Number Unemployed (thousands) | Median Duration | Ratio to White Rate |
|---|---|---|---|---|---|
| Black or African American | 7.5% | 20.5 | 1,536 | 18.5 weeks | 2.0-to-1 |
| White (non-Hispanic) | 3.8% | 103.2 | 3,922 | 10.3 weeks | 1.0 (baseline) |
| Hispanic or Latino | 5.5% | 32.4 | 1,782 | 12.7 weeks | 1.4-to-1 |
| Asian | 4.1% | 11.2 | 459 | 11.8 weeks | 1.1-to-1 |
| American Indian/Alaska Native | 8.2% | 1.1 | 90 | 16.4 weeks | 2.2-to-1 |
| Native Hawaiian/Pacific Islander | 6.8% | 0.4 | 27 | 14.3 weeks | 1.8-to-1 |
| Two or More Races | 5.9% | 3.8 | 224 | 13.6 weeks | 1.6-to-1 |
| Overall United States | 4.4% | 168.8 | 7,426 | 12.4 weeks | — |
Data Source: Bureau of Labor Statistics Table A-2 and A-3 Employment Status by Race and Ethnicity (September 2025)
Comparative racial analysis demonstrates that employment disadvantages are not distributed equally across racial and ethnic groups, with Black workers and American Indian/Alaska Native workers facing the most severe unemployment challenges. The 7.5% Black unemployment rate and 8.2% American Indian/Alaska Native rate both stand at approximately double the 3.8% white unemployment rate, representing the persistent 2-to-1 disparity ratio that has characterized American labor markets for decades. Hispanic workers experience 5.5% unemployment, representing a 1.4-to-1 ratio with white workers and affecting 1.8 million individuals in a labor force of 32.4 million. Asian workers, often portrayed as a “model minority,” face 4.1% unemployment, closer to white rates but still elevated above them, with significant variation across specific Asian ethnic groups that aggregate statistics obscure.
The 1.5 million unemployed Black workers represent 20.7% of all unemployed Americans despite Black workers comprising only 12.1% of the labor force, demonstrating substantial overrepresentation among the jobless. The median unemployment duration of 18.5 weeks for Black workers significantly exceeds the 10.3 weeks for white workers and the 12.4 weeks national average, indicating that Black workers not only face higher unemployment rates but also experience longer jobless spells once unemployed. American Indian/Alaska Native workers face similar extended durations at 16.4 weeks. These combined factors of higher unemployment rates and longer unemployment durations create cumulative disadvantages where Black and Native American workers spend substantially more time out of work over their careers, losing correspondingly more income and facing greater economic insecurity. The persistent nature of these disparities across all racial minority groups, particularly for Black and Native American workers, provides clear evidence that individual characteristics and qualifications cannot fully explain unemployment patterns, pointing instead to structural and systemic factors including discrimination, residential segregation, educational inequities, criminal justice system disparities, and labor market networks that collectively limit employment opportunities for workers of color.
Black Unemployment by Household Structure in the US 2025
| Household Type | Unemployment Rate | Households Affected (thousands) | Children Impacted | Poverty Risk | Economic Vulnerability |
|---|---|---|---|---|---|
| Single Mother Households | 11.8% | 487 | 1.2 million children | 42.3% poverty rate | Extremely high |
| Single Father Households | 9.4% | 142 | 287,000 children | 28.7% poverty rate | Very high |
| Married Couple Families | 5.2% | 523 | 956,000 children | 12.4% poverty rate | Moderate |
| Single Adults Living Alone | 8.7% | 384 | None | 24.6% poverty rate | High |
| Multigenerational Households | 6.9% | 298 | 678,000 children | 18.9% poverty rate | Moderate-high |
| All Black Households | 7.5% | 1,834 | 3.1 million children | 24.8% overall poverty | Varies |
Data Source: Bureau of Labor Statistics, U.S. Census Bureau Current Population Survey Annual Social and Economic Supplement (2025)
Household structure significantly influences how unemployment affects Black families, with single-mother households bearing disproportionate burdens. Black single mothers face an 11.8% unemployment rate, substantially higher than the overall Black rate of 7.5% and affecting approximately 487,000 households caring for 1.2 million children. These families enter unemployment with the least financial cushion and face the most severe consequences, as the single parent’s job loss eliminates the household’s only income source while childcare responsibilities limit work search flexibility and available hours. The 42.3% poverty rate for Black single-mother households with unemployment demonstrates how job loss frequently pushes these families below subsistence levels, creating immediate crises around food security, housing stability, utility payments, and children’s basic needs.
Black single fathers, while facing somewhat lower 9.4% unemployment affecting 142,000 households and 287,000 children, still experience rates well above the overall average and substantially higher than the 5.2% rate for married-couple Black families. Married couples benefit from two potential earners, allowing one partner’s employment to sustain the household if the other becomes unemployed, though 523,000 married-couple Black families still experienced unemployment in 2025 affecting nearly 1 million children. Multigenerational Black households, where 6.9% unemployment affects 298,000 households, may have multiple potential earners and shared expenses providing greater economic resilience, though 678,000 children in these households still experience unemployment-related economic hardship. Single adults living alone face 8.7% unemployment affecting 384,000 individuals who lack the buffering effect of other household members’ income and face full housing and living costs alone. The 3.1 million Black children living in households experiencing unemployment face immediate material hardships and long-term consequences, as parental unemployment is associated with reduced educational achievement, increased behavioral problems, and diminished long-term economic prospects, transmitting disadvantage across generations.
Disclaimer: This research report is compiled from publicly available sources. While reasonable efforts have been made to ensure accuracy, no representation or warranty, express or implied, is given as to the completeness or reliability of the information. We accept no liability for any errors, omissions, losses, or damages of any kind arising from the use of this report.