
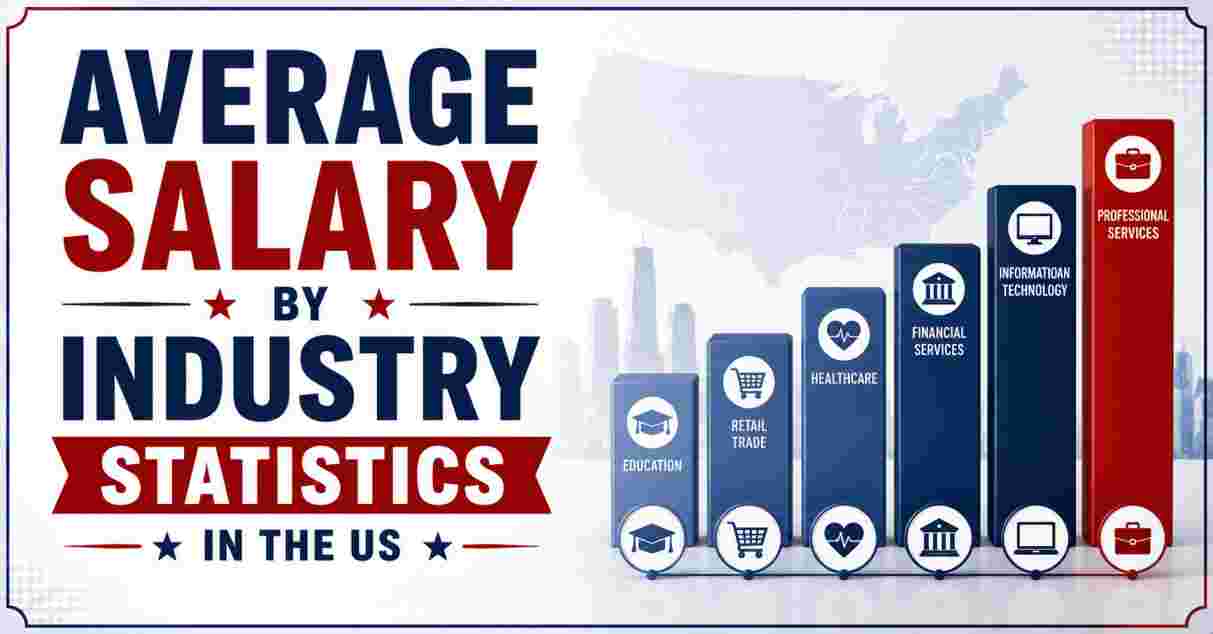
Average Salary by Industry in America 2026
Average salary by industry remains one of the sharpest ways to understand how unevenly pay is distributed across the American economy, and the 2026 data makes that inequality impossible to ignore. Using the most recent Bureau of Labor Statistics (BLS) Quarterly Census of Employment and Wages (QCEW) figures — the most comprehensive government dataset available, covering essentially every payroll job in the country — the gap between the highest- and lowest-paying sectors now runs to roughly six times, from an average of $184,220 a year in information down to just $30,935 in accommodation and food services. The all-industry average sits at $78,722, but that single number obscures a labor market where 11 of 20 major sectors pay above the mean while the three largest employing industries — health care, retail, and food service, together accounting for over 54 million jobs — all pay below it.
This report breaks down average salary by industry in the US for 2026 across all 20 major BLS sectors, highlights the highest- and lowest-paying occupations within those industries, and explains why a sector average can be a misleading number on its own without understanding the mechanics behind it — including why tech and finance produce very different pay curves despite ranking near each other at the top.
Interesting Facts About Average Salary by Industry in the US 2026
| Fact Category | Detail |
|---|---|
| All-industry average annual pay (2025 QCEW) | $78,722 |
| All-industry average hourly rate | $37.85/hour |
| Highest-paying sector | Information — $184,220 |
| Lowest-paying sector | Accommodation & food services — $30,935 |
| Top-to-bottom spread | 6.0× |
| Fastest one-year sector wage growth | Information, up +9.3% |
| Median full-time weekly wage (Q1 2026, BLS) | $1,235/week ≈ $64,220/year |
| Highest-paying single occupation (mean wage) | Pediatric surgeons — $502,050 |
| Highest-paying non-medical occupation | Airline pilots — $288,650 mean |
| Sectors paying above the all-industry average | 11 of 20 — but only ~40% of all jobs |
| Largest US employing sector | Health care & social assistance — 25.1 million jobs |
| Overall wage growth, all industries (past year) | +4.2% |
Source: US Bureau of Labor Statistics Quarterly Census of Employment and Wages (QCEW), 2025 annual averages; BLS Occupational Employment and Wage Statistics (OEWS), May 2025 data released May 2026; BLS Current Population Survey Q1 2026
Highest-Paying Industries by Average Salary 2026
| Industry (NAICS Sector) | Average Annual Pay | Jobs (US) | 1-Yr Change |
|---|---|---|---|
| Information | $184,220 | 3.0 million | +9.3% |
| Management of companies & enterprises | $165,866 | 2.6 million | +2.9% |
| Finance & insurance | $152,846 | 6.4 million | +6.9% |
| Professional, scientific & technical services | $134,893 | 10.9 million | +5.6% |
| Mining, quarrying, oil & gas extraction | $133,472 | 0.6 million | +2.8% |
| Utilities | $128,512 | 0.9 million | +4.8% |
| Wholesale trade | $105,838 | 6.0 million | +4.0% |
Source: US Bureau of Labor Statistics QCEW, 2025 annual averages
The information sector — encompassing software, streaming, telecom, and data processing — is by a wide margin the single highest-paying major industry in the US economy, averaging $184,220 per job, or 2.3 times the all-industry average. It employs a comparatively small slice of the workforce, just 3.0 million people (under 2% of all US jobs), which is precisely why it can sustain such an elevated average: a sector where capital, licensing, and software scale allow a relatively small headcount to capture an outsized share of revenue tends to concentrate high pay among fewer workers, rather than spreading modest raises across millions. Information also posted the fastest wage growth of any sector tracked, up 9.3% in a single year, reflecting continued heavy enterprise investment in AI infrastructure and software talent even as broader tech hiring elsewhere has cooled.
Management of companies and enterprises ($165,866) and finance and insurance ($152,846) round out the next two spots, both benefiting from workforces composed almost entirely of professional and managerial roles with essentially no lower-paid frontline staff to pull the average down. Professional, scientific, and technical services — the category covering law, accounting, consulting, engineering, and IT services — is notable for being both highly paid ($134,893) and enormous, at nearly 11 million jobs, making it the largest of the genuinely high-paying sectors and a meaningfully bigger share of the labor market than information or finance. Mining, quarrying, and oil and gas extraction ($133,472) and utilities ($128,512) close out the top six, though mining’s relatively small workforce of under 600,000 means its average tends to swing significantly with commodity price cycles.
Lowest-Paying Industries by Average Salary 2026
| Industry (NAICS Sector) | Average Annual Pay | Jobs (US) | 1-Yr Change |
|---|---|---|---|
| Administrative & waste services | $60,073 | 9.1 million | +3.6% |
| Other services | $54,509 | 4.7 million | +3.3% |
| Arts, entertainment & recreation | $51,215 | 3.0 million | +3.3% |
| Agriculture, forestry, fishing & hunting | $48,984 | 1.2 million | +4.0% |
| Retail trade | $43,454 | 15.4 million | +3.3% |
| Accommodation & food services | $30,935 | 14.2 million | +3.1% |
Source: US Bureau of Labor Statistics QCEW, 2025 annual averages
Accommodation and food services sits at the very bottom of the industry ranking at just $30,935 — less than a sixth of the top-paying information sector — but that figure is heavily distorted by part-time work rather than purely reflecting hourly rates. QCEW counts every part-time job at full weight when calculating the average, so a sector that runs on part-time restaurant and hotel shifts reports a low annual average even though full-time managers and skilled kitchen staff within that same sector often earn considerably more. Retail trade ($43,454) suffers from the same statistical effect, since a huge share of its 15.4 million jobs are part-time sales-floor positions. Together, retail and food service account for roughly 19% of all US jobs, meaning nearly one in five American workers is employed in one of the two lowest-paying broad sectors in the entire economy.
Agriculture, forestry, fishing and hunting ($48,984) and arts, entertainment, and recreation ($51,215) also sit well below the national mean, both characterized by seasonal work, physical demands, and — in agriculture’s case — a workforce with limited bargaining power and geographic concentration in lower cost-of-living regions. It’s worth noting that even a mid-range hourly job can look wildly different depending on location and household size; a useful next step for anyone comparing sector pay against real-world affordability is checking how a given salary stacks up against current minimum wage rates by state, since several of these lower-paying sectors employ large numbers of workers close to their state’s wage floor.
Highest-Paying Individual Occupations in the US 2026
| Occupation | Mean Annual Wage (BLS, May 2025 data) |
|---|---|
| Pediatric surgeons | $502,050 |
| Cardiologists | $454,940 |
| Oral & maxillofacial surgeons | $334,310 |
| Anesthesiologists | $339,470 |
| Airline pilots | $288,650 |
| Chief executives | $269,630 |
| Nurse anesthetists (CRNAs) | $248,320 |
| Computer & information systems managers | $185,310 |
| Financial managers | $166,050 |
| Lawyers | $163,770 |
| Software developers | $137,650 |
| Pharmacists | $136,030 |
Source: US Bureau of Labor Statistics Occupational Employment and Wage Statistics (OEWS), May 2025 data released May 2026
At the individual occupation level rather than the broad industry level, healthcare specialties dominate every seat at the top of the table. Pediatric surgeons lead all occupations nationally with a mean annual wage of $502,050, followed closely by cardiologists at $454,940 — both figures reflecting the extraordinarily long and expensive training pipeline required to reach independent practice, typically 12 to 15 years of post-secondary education between medical school, residency, and fellowship. Anesthesiologists ($339,470 mean; median closer to $391,490 per some datasets) and oral and maxillofacial surgeons ($334,310) round out the next tier, underscoring that surgical and procedural specialties consistently out-earn primary-care medical roles.
Outside of medicine, airline pilots stand out as the highest-paid non-healthcare occupation at a mean of $288,650, followed by chief executives at $269,630 — both figures notably exclude overtime and most bonus or equity compensation, meaning actual total pay for many executives runs considerably higher. In technology specifically, computer and information systems managers ($185,310) and software developers ($137,650) anchor a large cluster of six-figure occupations that, while well-compensated, sit meaningfully below the medical and executive tiers — a useful reminder that the “highest-paying industry” and “highest-paying job” rankings tell different stories depending on whether the lens is sector-wide averages or individual occupational ceilings. For a deeper look at how these figures play out specifically within technology roles, including entry-level versus senior compensation bands, the tech salary statistics for the US break the sector down role by role.
What These Salary Figures Actually Mean 2026
| Statistical Consideration | Explanation |
|---|---|
| Mean vs. median | All-industry mean is $78,722; median full-time wage is closer to $64,220 — the mean is pulled upward by high earners |
| Part-time jobs counted fully | Sectors like retail and food service average down because part-time shifts are counted at full weight in QCEW |
| Bonuses and stock included | Exercised stock options and bonuses count as wages, inflating tech and finance averages further |
| Tech vs. finance internal spread | Securities & commodity contracts (finance sub-industry) averages $334,624 — nearly double computer systems design at $176,368 |
| Depository credit intermediation (retail banking) | Averages closer to $116,000 — far below finance’s headline sector figure |
| Restaurants specifically (within food service) | Average $27,804 per job — below even the broader food-service sector average |
| Households earning above sector averages still below “upper-middle” thresholds in high-cost metros | A $150,000+ salary in Silicon Valley may not clear local upper-middle-class cost-of-living benchmarks |
Source: US Bureau of Labor Statistics QCEW 2025; BLS OEWS May 2025; salaryconverter.net industry analysis, 2026
Reading a sector average salary correctly requires understanding what the number is actually measuring, because three quirks in how it’s calculated explain almost every case where the figure seems implausible. First, it is pay per job, not per person — a sector saturated with part-time roles, like retail or food service, reports a low average even though the full-time staff within that same sector often earn considerably more than the headline number suggests. Second, it is a mean, not a median, meaning a relatively small number of very large paychecks — particularly in information and finance, where exercised stock options and outsized bonuses count as wages — pull the sector average well above what a typical worker in that industry actually takes home. Third, sector figures average across an entire hierarchy at once, from warehouse floor to executive suite, so a broad category like “finance and insurance” blends ordinary retail-banking salaries with the extraordinary compensation of a small number of traders and portfolio managers.
That last point becomes especially clear when comparing tech versus finance more closely. At the sector level, information leads finance by 21% ($184,220 vs. $152,846), which would suggest tech is simply the better-paying field. But finance actually has the higher ceiling: its securities and commodity contracts sub-industry — trading desks, brokerages, and asset managers — averages $334,624 per job, nearly double the $176,368 average in computer systems design, the sub-industry holding the bulk of software and IT-services jobs. The shape of pay in each sector is fundamentally different: technology pays a high, comparatively flat wage across millions of engineers, while finance pays ordinary money to the large population of retail bankers and extraordinary money to a small number of people at the very top of trading and investment roles. Which sector “pays more” ultimately depends entirely on where within it a given worker actually lands — a distinction that matters just as much when benchmarking against broader income tiers like upper-middle-class income thresholds, since a $150,000 salary in computer systems design and a $150,000 salary in retail banking represent very different positions within their respective industries’ internal pay distributions, even though both sit near the same dollar figure on paper.
Where Most Americans Actually Work and Earn 2026
| Largest Employing Sectors | Jobs (US) | Average Annual Pay | Above/Below National Mean |
|---|---|---|---|
| Health care & social assistance | 25.1 million | $68,445 | Below (-13%) |
| Retail trade | 15.4 million | $43,454 | Below (-45%) |
| Accommodation & food services | 14.2 million | $30,935 | Below (-61%) |
| Educational services | 13.3 million | $66,048 | Below (-16%) |
| Manufacturing | 12.6 million | $89,545 | Above (+14%) |
| Professional, scientific & technical services | 10.9 million | $134,893 | Above (+71%) |
| Construction | 8.4 million | $84,504 | Above (+7%) |
| Public administration | 7.9 million | $87,620 | Above (+11%) |
| Transportation & warehousing | 7.6 million | $70,063 | Below (-11%) |
Source: US Bureau of Labor Statistics QCEW, 2025 annual averages
One of the most important — and most frequently overlooked — facts in any discussion of average salary by industry is that most Americans do not actually work in a high-paying sector. The three largest employing industries in the country — health care and social assistance (25.1 million jobs), retail trade (15.4 million), and accommodation and food services (14.2 million) — collectively account for over 54 million jobs, more than a third of the entire US workforce, and every single one of them pays below the $78,722 all-industry average. Health care, the single largest sector in the country by employment, still averages just $68,445, a full 13% below the national mean, despite containing some of the highest-paid individual occupations in the entire economy (pediatric surgeons, cardiologists, and anesthesiologists all fall under this same broad sector classification). This is the clearest illustration of why a sector-wide average can simultaneously be true and misleading: health care contains both the highest-paid occupation in America and a massive base of lower-paid support staff, home health aides, and administrative workers, and the sector average reflects the weighted blend of both rather than either extreme.
Educational services ($66,048, 13.3 million jobs) and transportation and warehousing ($70,063, 7.6 million jobs) similarly sit below the national mean despite being essential, large-scale sectors of the economy. By contrast, manufacturing ($89,545) and construction ($84,504) — both sectors frequently associated in public perception with lower pay than white-collar office work — actually average above the national mean, a reflection of rising skilled-trades wages and the capital-intensive, often unionized nature of much of modern manufacturing work. The practical takeaway is that only about 40% of American jobs sit in the 11 sectors that pay above the all-industry mean, meaning the “average American salary” conversation is, for a clear majority of workers, actually a conversation about sectors that pay below whatever headline figure gets cited in the news.
Disclaimer: This research report is compiled from publicly available sources. While reasonable efforts have been made to ensure accuracy, no representation or warranty, express or implied, is given as to the completeness or reliability of the information. We accept no liability for any errors, omissions, losses, or damages of any kind arising from the use of this report.