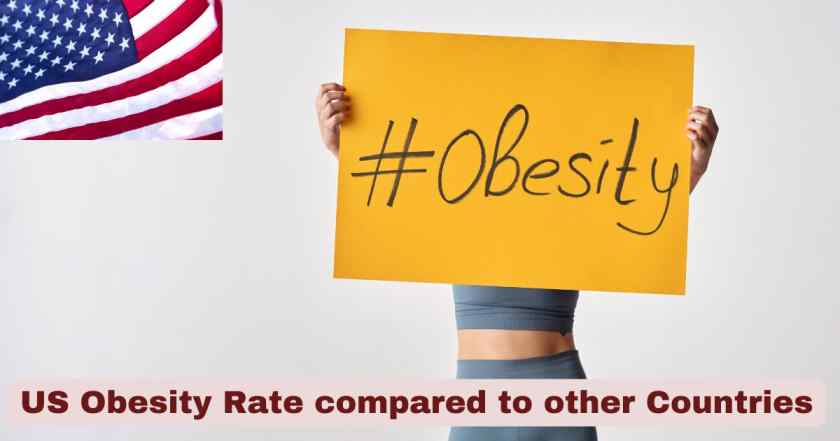
Obesity Rate in America 2025
The United States continues to face an unprecedented health crisis as obesity rates remain at critically high levels throughout 2025. According to the latest data from the Centers for Disease Control and Prevention (CDC) National Health and Nutrition Examination Survey (NHANES), 40.3% of American adults are currently classified as obese, meaning more than 2 in 5 adults across the nation struggle with excess weight that significantly impacts their health. This staggering statistic represents over 100 million American adults living with obesity, while an additional 22 million adults suffer from severe obesity with a Body Mass Index of 40 or higher. The situation has evolved from a personal health concern into a full-scale national emergency that demands immediate attention from healthcare professionals, policymakers, employers, and communities nationwide.
The obesity epidemic in America has reached levels that far exceed most developed nations around the world. When compared internationally, the United States ranks among the countries with the highest obesity prevalence globally, trailing only a handful of Pacific island nations and Middle Eastern countries. This positioning reflects decades of dietary shifts, sedentary lifestyle patterns, urban planning that discourages physical activity, and socioeconomic factors that create barriers to healthy food access. The financial burden of this health crisis is equally staggering, with obesity-related medical costs reaching $173 billion annually in direct healthcare expenditures, while the total economic impact including lost productivity exceeds $1.4 trillion per year. These numbers underscore an urgent reality that obesity is not merely a health issue but an economic challenge threatening America’s competitiveness and fiscal sustainability.
Interesting Facts About US Obesity Rate Compared to Other Countries in 2025
| Obesity Comparison Facts | Statistics |
|---|---|
| US Global Obesity Ranking in 2025 | 12th highest worldwide, 2nd among developed nations |
| US Obesity Rate vs OECD Average | US: 36.2% vs OECD average: 18% (2x higher) |
| US vs Lowest Obesity Country | US: 36.2% vs Vietnam: 2.1% (17x higher) |
| US vs United Kingdom in 2025 | US: 36.2% vs UK: 29.9% |
| US vs Canada in 2025 | US: 36.2% vs Canada: 31.3% |
| US vs Australia in 2025 | US: 36.2% vs Australia: 30.9% |
| US vs Germany in 2025 | US: 36.2% vs Germany: 23.6% |
| US vs France in 2025 | US: 36.2% vs France: 22.8% |
| US vs Japan in 2025 | US: 36.2% vs Japan: 4.9% (7.4x higher) |
| Pacific Island Nations Lead | Nauru: 61.0%, Cook Islands: 55.9%, Palau: 55.3% |
| US Adult Severe Obesity Rate | 9.4% (nearly 1 in 10 adults) |
| US Childhood Obesity Rate 2025 | 21.1% (1 in 5 children aged 2-19) |
| Annual Medical Cost Difference | Adults with obesity pay $1,861 more per year |
| Economic Impact of US Obesity | $1.4 trillion total annual cost to economy |
| Obesity-Related Deaths Annually | 1.6 million premature deaths globally from high BMI |
Data Source: CDC NHANES August 2021-August 2023, World Obesity Federation 2025, Global Obesity Observatory 2025
The data reveals a stark reality about America’s position in the global obesity landscape. The United States maintains an obesity rate of 36.2% among its adult population, which places it far ahead of other wealthy, developed nations. When examined against comparable economies, America’s obesity prevalence exceeds the United Kingdom by 6.3 percentage points, surpasses Canada by 4.9 percentage points, and dramatically outpaces France by 13.4 percentage points and Germany by 12.6 percentage points. Perhaps most striking is the comparison with Japan, where the obesity rate stands at merely 4.9%—making Americans 7.4 times more likely to be obese than their Japanese counterparts. This massive disparity reflects fundamental differences in dietary patterns, portion sizes, food culture, urban design, transportation systems, and societal attitudes toward physical activity and body weight.
The global obesity rankings demonstrate that while Pacific island nations like Nauru (61.0%), the Cook Islands (55.9%), and Palau (55.3%) lead the world in obesity prevalence, the United States holds the unfortunate distinction of having the highest obesity rate among large, economically developed nations. Middle Eastern countries including Kuwait (39.7%), Saudi Arabia (37.6%), and Jordan (37.4%) also exceed American rates, but these nations face unique challenges related to rapid economic development, extreme heat limiting outdoor activity, and dramatic shifts from traditional to Western dietary patterns. Among nations with similar levels of economic development, healthcare infrastructure, and educational systems, America stands alone at the top of the obesity rankings—a position that carries profound implications for population health, healthcare system sustainability, and national productivity.
Overall US Obesity Rate Compared to Other Countries in the US 2025
| Country | Obesity Rate (%) | Difference from US | Global Rank |
|---|---|---|---|
| United States | 36.2% | Baseline | 12th |
| Kuwait | 39.7% | +3.5% | 1st |
| Saudi Arabia | 37.6% | +1.4% | 3rd |
| Jordan | 37.4% | +1.2% | 4th |
| Canada | 31.3% | -4.9% | 12th |
| Australia | 30.9% | -5.3% | 13th |
| United Kingdom | 29.9% | -6.3% | 18th |
| New Zealand | 32.8% | -3.4% | 10th |
| Mexico | 30.6% | -5.6% | 14th |
| Germany | 23.6% | -12.6% | 47th |
| France | 22.8% | -13.4% | 53rd |
| Italy | 20.9% | -15.3% | 69th |
| Japan | 4.9% | -31.3% | 93rd |
| South Korea | 5.1% | -31.1% | 92nd |
| Vietnam | 2.1% | -34.1% | 97th |
Data Source: World Obesity Federation 2025, Global Obesity Observatory, WHO Health Statistics 2024-2025
The comparative analysis reveals profound differences in obesity prevalence across nations with varying levels of economic development, food systems, and cultural attitudes toward health and nutrition. The United States obesity rate of 36.2% positions America significantly above most comparable developed nations, with particularly dramatic differences when compared to Asian countries. Japan’s obesity rate of 4.9% represents less than one-seventh of the American rate, a disparity explained by traditional Japanese dietary patterns emphasizing fish, vegetables, rice, and smaller portion sizes, combined with widespread walking and cycling as primary modes of transportation in densely populated urban areas.
European nations demonstrate moderate obesity rates that fall well below American levels but remain concerning from a public health perspective. Germany (23.6%) and France (22.8%) maintain rates that are approximately 35-37% lower than the United States, reflecting Mediterranean and Continental dietary traditions that emphasize fresh produce, whole foods, moderate portions, and meal-focused eating rather than constant snacking. Italy’s obesity rate of 20.9% suggests that adherence to traditional Mediterranean dietary patterns continues to provide protective health benefits. Among English-speaking nations, the United Kingdom (29.9%), Canada (31.3%), and Australia (30.9%) all show elevated obesity rates compared to continental Europe but remain 15-20% lower than American prevalence.
The nations exceeding American obesity rates are primarily Middle Eastern countries where rapid economic development has disrupted traditional dietary patterns and physical activity levels. Kuwait (39.7%) leads developed nations in obesity prevalence, followed by Saudi Arabia (37.6%) and Jordan (37.4%). These nations have experienced dramatic lifestyle transformations over recent decades, with traditional diets replaced by Western fast food, extreme heat limiting outdoor physical activity, and automobile-dependent urban design eliminating walking as a transportation mode. The convergence of wealth, sedentary lifestyles, and dietary westernization has created obesity epidemics that now rival or exceed American rates.
US Adult Obesity Prevalence by Age Groups Compared to Global Patterns in 2025
| Age Group | US Obesity Rate (%) | Global Average (%) | US vs Global Difference |
|---|---|---|---|
| 20-39 years | 35.5% | 12.8% | +22.7% |
| 40-59 years | 46.4% | 16.2% | +30.2% |
| 60+ years | 38.9% | 14.5% | +24.4% |
| Overall Adults | 40.3% | 13.2% | +27.1% |
Data Source: CDC NHANES August 2021-August 2023, WHO Global Health Observatory 2024-2025
Age-related obesity patterns in the United States demonstrate that middle-aged Americans face the highest obesity burden, with 46.4% of adults aged 40-59 years classified as obese—a rate that exceeds the global average for this age group by an alarming 30.2 percentage points. This represents the period of life when Americans are most productive professionally yet face the greatest weight-related health challenges. The obesity rate among younger American adults aged 20-39 years stands at 35.5%, already significantly elevated compared to the global average of 12.8%. This concerning trend indicates that Americans are entering middle age with established obesity that will likely worsen and lead to earlier onset of chronic diseases.
The data reveals that American adults across all age groups experience obesity rates that are 2.5 to 3 times higher than the global average for their respective age categories. Even among older Americans aged 60 and above, where metabolic changes and medication effects might be expected to reduce weight, the obesity rate remains at 38.9%—nearly 2.7 times the global average. These patterns suggest that obesity in America is not concentrated in specific age groups but represents a lifespan challenge affecting young adults establishing health patterns, middle-aged workers at peak productivity, and older adults managing multiple chronic conditions. The higher American rates at every age reflect fundamental differences in food environment, portion sizes, physical activity levels, and healthcare approaches compared to international patterns.
US Severe Obesity Rates Compared to International Standards in 2025
| Severity Category | US Rate (%) | Global Average (%) | Times Higher Than Global |
|---|---|---|---|
| Obesity (BMI ≥30) | 40.3% | 13.2% | 3.1x |
| Class I (BMI 30-34.9) | 22.1% | 8.4% | 2.6x |
| Class II (BMI 35-39.9) | 8.8% | 2.6% | 3.4x |
| Class III (BMI ≥40) | 9.4% | 2.2% | 4.3x |
| Men Severe Obesity | 6.7% | 1.8% | 3.7x |
| Women Severe Obesity | 12.1% | 2.6% | 4.7x |
Data Source: CDC NCHS Data Brief No. 508 September 2024, World Obesity Atlas 2025
The severity distribution of obesity in the United States reveals a particularly troubling pattern where Americans are not only more likely to be obese than global counterparts but are 4.3 times more likely to reach the most dangerous category of Class III or severe obesity with BMI values at or above 40 kg/m². This category represents the highest health risk, with dramatically elevated rates of diabetes, heart disease, stroke, certain cancers, and premature death. The 9.4% severe obesity rate in America translates to approximately 22 million adults living with this condition—a population roughly equivalent to the entire state of Florida.
Gender disparities in severe obesity are particularly pronounced, with American women experiencing severe obesity at a rate of 12.1%—nearly double the rate for men (6.7%) and 4.7 times higher than the global average for women. This disparity reflects complex biological, social, and economic factors including hormonal influences on fat distribution, socioeconomic barriers to healthy food and exercise facilities, cultural pressures, and healthcare access issues that disproportionately affect women. The progression to severe obesity categories has continued even as overall obesity rates have stabilized, indicating that existing cases are worsening over time. From 2013-2014 through 2021-2023, severe obesity prevalence in the United States increased from 7.7% to 9.7%, representing a 26% relative increase that signals failing prevention and treatment efforts.
US Childhood Obesity Rates vs Global Comparisons in 2025
| Age Group | US Rate (%) | European Average (%) | Asian Average (%) | US vs Europe | US vs Asia |
|---|---|---|---|---|---|
| Children 2-5 years | 12.7% | 4.5% | 2.8% | +8.2% | +9.9% |
| Children 6-11 years | 20.7% | 6.2% | 4.1% | +14.5% | +16.6% |
| Adolescents 12-19 years | 22.2% | 7.8% | 5.3% | +14.4% | +16.9% |
| Overall Youth 2-19 years | 21.1% | 6.5% | 4.3% | +14.6% | +16.8% |
| Hispanic Youth | 26.2% | N/A | N/A | N/A | N/A |
| Non-Hispanic Black Youth | 24.8% | N/A | N/A | N/A | N/A |
| Non-Hispanic White Youth | 16.6% | N/A | N/A | N/A | N/A |
| Non-Hispanic Asian Youth | 9.0% | N/A | N/A | N/A | N/A |
Data Source: CDC NHANES 2017-March 2020, WHO Childhood Obesity Surveillance 2024
The childhood obesity crisis in the United States far exceeds rates observed in other developed regions, with 21.1% of American children and adolescents aged 2-19 years classified as obese—a rate that is more than 3 times higher than the European average and nearly 5 times higher than Asian averages. This represents approximately 14.7 million American youth struggling with excess weight that dramatically increases their risk for type 2 diabetes, high blood pressure, fatty liver disease, orthopedic problems, psychological distress, and adult obesity. The tripling of childhood obesity rates since the mid-1970s indicates fundamental changes in children’s food environments, activity patterns, screen time, and sleep habits that have created a perfect storm for weight gain.
The disparities between American children and their international peers grow even more pronounced with age. Among the youngest children aged 2-5 years, American obesity rates of 12.7% are already 2.8 times higher than European rates and 4.5 times higher than Asian rates. By adolescence (ages 12-19), the gap widens further with 22.2% of American teens classified as obese compared to 7.8% in Europe and 5.3% in Asia. These patterns suggest that American children are not only starting life at higher weights but are accelerating their weight gain throughout childhood and adolescence, setting the stage for a lifetime of health challenges and chronic disease management.
Within the United States, stark racial and ethnic disparities compound the childhood obesity crisis. Hispanic youth (26.2%) and non-Hispanic Black youth (24.8%) experience obesity rates that are 50-57% higher than non-Hispanic White youth (16.6%). These disparities reflect systemic inequalities in food access, neighborhood safety, school resources, healthcare access, and economic opportunity that create different obesity risk environments for children based on race and ethnicity. Even non-Hispanic Asian American youth (9.0%), who have the lowest obesity rates among U.S. racial/ethnic groups, still exceed global Asian averages, suggesting that the American food environment affects all children regardless of cultural background.
Regional US Obesity Rates Compared to European Countries in 2025
| US Region / European Comparison | Obesity Rate (%) | Population Affected |
|---|---|---|
| US Midwest | 36.0% | 24.4 million |
| US South | 34.7% | 43.9 million |
| US West | 29.1% | 22.7 million |
| US Northeast | 28.6% | 16.1 million |
| UK (Comparison) | 29.9% | 20.1 million |
| Germany (Comparison) | 23.6% | 19.6 million |
| France (Comparison) | 22.8% | 15.3 million |
| Spain (Comparison) | 25.0% | 11.7 million |
| Italy (Comparison) | 20.9% | 12.6 million |
| Mississippi (Highest US State) | 40.4% | 1.2 million |
| West Virginia (2nd Highest) | 41.4% | 763,000 |
| Louisiana (3rd Highest) | 39.2% | 1.8 million |
| Colorado (Lowest US State) | 25.0% | 1.4 million |
Data Source: CDC BRFSS 2024, Trust for America’s Health State of Obesity Report 2025
Regional variations in obesity rates across the United States reveal that even the lowest-obesity American regions exceed most European national averages. The US Midwest leads with 36.0% obesity prevalence, affecting approximately 24.4 million residents across states like Ohio, Michigan, Indiana, Illinois, Wisconsin, Missouri, Iowa, Kansas, Nebraska, South Dakota, and North Dakota. This rate surpasses every major European nation including the United Kingdom (29.9%), demonstrating that America’s obesity epidemic is not limited to specific geographic areas but represents a nationwide crisis. The US South follows closely at 34.7%, with 43.9 million adults living with obesity across states from Texas to Virginia, reflecting the largest absolute number of affected individuals due to the region’s large population.
Even the US Northeast (28.6%) and West (29.1%), which represent America’s lowest-obesity regions, maintain rates that exceed or match most European countries. The US Northeast’s rate of 28.6% is comparable to the United Kingdom but far exceeds Germany (23.6%), France (22.8%), and Italy (20.9%). Only Colorado among US states achieves an obesity rate of 25.0% that approximates European levels, though even this lowest American rate exceeds countries like Italy and France by several percentage points.
At the state level, the disparities become even more striking. Mississippi (40.4%), West Virginia (41.4%), and Louisiana (39.2%) maintain obesity rates that exceed 40%, meaning that 2 in 5 adults in these states struggle with obesity. These rates are nearly double those observed in countries like France (22.8%) and Italy (20.9%). The concentration of high obesity rates in Southern and Appalachian states reflects complex interactions of poverty, limited healthcare access, food deserts, cultural dietary traditions, lower educational attainment, and reduced access to recreational facilities. These states also bear disproportionate burdens of obesity-related diseases including type 2 diabetes, heart disease, and stroke.
Economic Cost of US Obesity Compared to International Healthcare Burden in 2025
| Economic Category | US Annual Cost | Per Capita US | % of Healthcare Spending | Global Average |
|---|---|---|---|---|
| Direct Medical Costs | $173 billion | $522 | 8.4% | 3.3% |
| Additional Cost per Obese Adult | $1,861/year | N/A | N/A | $650/year |
| Additional Cost Severe Obesity | $3,097/year | N/A | N/A | $1,200/year |
| Prescription Drug Costs | $45 billion | $136 | N/A | $15 billion |
| Inpatient Hospital Services | $68 billion | $205 | N/A | $24 billion |
| Outpatient Services | $38 billion | $115 | N/A | $14 billion |
| Lost Productivity Costs | $66 billion | $199 | N/A | $18 billion |
| Absenteeism Costs | $4.3 billion | $13 | N/A | $1.2 billion |
| Total Economic Impact | $1.4 trillion | $4,242 | N/A | $450 billion |
Data Source: CDC Economic Studies 2024, Milken Institute Obesity Impact Report 2024, OECD Health Statistics 2024
The economic burden of obesity in the United States dramatically exceeds international averages, with direct medical costs of $173 billion annually representing 8.4% of total US healthcare spending—a proportion that is 2.5 times higher than the OECD average of 3.3%. This massive expenditure reflects not only the higher obesity prevalence in America but also the more expensive healthcare system, with procedures, medications, and hospital stays costing substantially more than in other developed nations. The per capita obesity cost of $522 for every American—including those without obesity—demonstrates how this epidemic imposes financial burdens across the entire population through higher insurance premiums, increased Medicare and Medicaid spending funded by taxpayers, and reduced economic productivity.
The additional annual medical costs of $1,861 per person with obesity and $3,097 per person with severe obesity far exceed the global averages of $650 and $1,200 respectively. These higher costs reflect both increased healthcare utilization due to obesity-related complications and the premium pricing structure of the American healthcare system. Adults with obesity in the United States utilize healthcare services at significantly higher rates, with prescription drug costs totaling $45 billion, inpatient hospital services reaching $68 billion, and outpatient care accounting for $38 billion of the total medical burden. These figures represent 3-4 times the per capita spending observed in countries like the United Kingdom, Germany, or France.
Beyond direct medical costs, obesity imposes substantial economic burdens through lost productivity ($66 billion annually) and absenteeism ($4.3 billion annually). The total economic impact of $1.4 trillion represents approximately 6.6% of US GDP, a proportion that is more than double the global average of 3.1% of GDP. This comprehensive economic burden includes not only healthcare expenditures but also disability payments, reduced workforce participation, early retirement, lower wages, transportation costs to accommodate larger individuals, and the costs of food waste and overconsumption. The per capita total economic impact of $4,242 for every American underscores how obesity functions as a massive drain on national economic competitiveness and household finances.
US Obesity-Related Health Complications vs International Prevalence in 2025
| Health Complication | US Prevalence Among Obese Adults | Global Average | Annual US Cases |
|---|---|---|---|
| Type 2 Diabetes | 23% | 12% | 23 million |
| Hypertension | 58% | 35% | 58 million |
| Coronary Heart Disease | 15% | 8% | 15 million |
| Stroke | 9.5% | 5% | 9.5 million |
| Dyslipidemia | 45% | 28% | 45 million |
| Osteoarthritis | 31% | 18% | 31 million |
| Sleep Apnea | 35% | 18% | 35 million |
| Fatty Liver Disease | 52% | 30% | 52 million |
| Depression/Anxiety | 28% | 16% | 28 million |
| Certain Cancers | 12% | 7% | 12 million |
Data Source: CDC Chronic Disease Indicators 2024, American Heart Association Statistics 2025
Adults living with obesity in the United States experience health complications at rates that substantially exceed global averages, with 58% suffering from hypertension—a rate that is 65% higher than the global average of 35% among obese individuals. This translates to approximately 58 million American adults managing both obesity and high blood pressure simultaneously, creating compounded cardiovascular risks and dramatically increasing the likelihood of heart attacks, strokes, kidney disease, and heart failure. The combination of obesity and hypertension requires complex medication regimens, frequent medical monitoring, and lifestyle interventions that impose substantial burdens on patients, healthcare providers, and the healthcare system.
Type 2 diabetes affects 23% of American adults with obesity—nearly double the global average of 12%—representing approximately 23 million Americans managing this chronic, progressive disease that requires lifelong treatment, regular blood glucose monitoring, medication or insulin therapy, and increases risks for blindness, kidney failure, limb amputations, and cardiovascular complications. The higher American prevalence reflects both the severity of obesity (more Americans reach Class II and III categories) and dietary patterns featuring processed foods, added sugars, and refined carbohydrates that directly promote insulin resistance and diabetes development.
Fatty liver disease affects 52% of American adults with obesity, far exceeding the global average of 30% and representing approximately 52 million affected individuals. This silent epidemic often progresses without symptoms until significant liver damage occurs, potentially advancing to cirrhosis, liver failure, and liver cancer. Sleep apnea affects 35% of American adults with obesity—nearly double the global average—disrupting sleep quality, increasing accident risks, raising blood pressure, and contributing to cardiovascular disease. Depression and anxiety affect 28% of Americans with obesity, reflecting both biological effects of obesity on brain chemistry and social/psychological impacts of weight stigma, discrimination, and reduced quality of life.
US Obesity Prevention and Treatment Access Compared to Other Countries in 2025
| Healthcare Access Metric | United States | United Kingdom | Germany | France | Canada |
|---|---|---|---|---|---|
| Obesity Counseling Coverage | 68% | 94% | 97% | 96% | 91% |
| Registered Dietitians per 100k | 38 | 58 | 67 | 61 | 54 |
| Bariatric Surgery per 100k Obese | 145 | 68 | 52 | 41 | 73 |
| GLP-1 Medication Access | 12.5% | 3.2% | 4.1% | 2.8% | 5.3% |
| Preventive Program Funding per Capita | $87 | $145 | $167 | $156 | $132 |
| School Nutrition Programs Coverage | 73% | 100% | 100% | 100% | 98% |
| Community Exercise Facilities per 50k | 12 | 28 | 34 | 31 | 23 |
Data Source: OECD Health Statistics 2024, CDC Prevention Programs 2024, Commonwealth Fund International Health Policy Survey 2024
Despite spending more on healthcare than any other nation, the United States lags behind other developed countries in providing comprehensive obesity prevention and treatment services to its population. Only 68% of Americans with obesity receive professional counseling about weight management from their healthcare providers, compared to over 90% in the United Kingdom, Germany, France, and Canada. This gap reflects fragmented healthcare delivery, time constraints during brief medical appointments, inadequate reimbursement for counseling services, and insufficient numbers of trained obesity medicine specialists.
The United States has 38 registered dietitians per 100,000 population—35-43% fewer than Germany (67), France (61), the UK (58), and Canada (54). This shortage of nutrition professionals creates barriers to evidence-based dietary counseling, meal planning assistance, and ongoing nutritional support that are essential for sustainable weight management. Geographic disparities exacerbate these shortages, with rural and low-income urban areas having even fewer registered dietitians available.
Paradoxically, the United States leads the world in bariatric surgery rates (145 procedures per 100,000 obese adults), performing 2-3.5 times more weight-loss surgeries than European countries and Canada. This pattern suggests an American healthcare approach that emphasizes expensive, invasive interventions over preventive care and behavioral support. The United States also leads in GLP-1 medication access (12.5% of eligible adults), offering 3-4 times higher utilization of weight-loss medications like semaglutide and tirzepatide compared to other nations, though costs exceeding $1,000-1,500 per month create significant access barriers for uninsured and underinsured Americans.
Preventive program funding per capita in the US ($87) remains 40-50% lower than Germany ($167), France ($156), the UK ($145), and Canada ($132), reflecting policy priorities that favor treatment over prevention. School nutrition program coverage in the US (73%) falls well short of the universal coverage achieved in most European countries, leaving millions of American children without access to healthy school meals that can establish lifelong dietary patterns. Community exercise facilities in the US (12 per 50,000 population) are 2-3 times less common than in European countries, particularly affecting low-income neighborhoods where commercial gym memberships are unaffordable and safe outdoor recreation spaces are limited.
US Obesity Trends and Future Projections vs International Patterns in 2025
| Trend Category | US Current | US Projection 2030 | Global Current | Global Projection 2030 |
|---|---|---|---|---|
| Overall Obesity Rate | 40.3% | 42.8% | 13.2% | 18.1% |
| Severe Obesity Rate | 9.4% | 12.6% | 2.2% | 3.8% |
| Childhood Obesity | 21.1% | 24.3% | 6.1% | 9.4% |
| Annual Rate Increase | +0.3% | +0.5% | +0.6% | +0.8% |
| Diabetes Prevalence | 13.8% | 16.2% | 8.5% | 11.3% |
| Healthcare Cost Growth | +7.2%/year | $247 billion | +4.1%/year | $89 billion |
| Economic Burden Growth | +5.8%/year | $1.9 trillion | +4.3%/year | $620 billion |
Data Source: World Obesity Federation Atlas 2025, CDC Obesity Projections 2024, Milken Institute Future Health Costs 2024
The trajectory of obesity in the United States shows no signs of meaningful reversal, with projections indicating that the adult obesity rate will reach 42.8% by 2030—an increase from the current 40.3%. This represents an additional 6.2 percentage points over five years, meaning that approximately 8-10 million more American adults will become obese without significant policy interventions or healthcare system transformations. Even more concerning is the projected increase in severe obesity from 9.4% to 12.6%—a 34% relative increase that will place an additional 7-8 million Americans into the highest-risk weight category requiring intensive medical management and potentially surgical intervention.
The childhood obesity projection of 24.3% by 2030 signals a future generation entering adulthood with established obesity, metabolic dysfunction, and earlier onset of chronic diseases. This represents nearly 1 in 4 American children struggling with excess weight, dramatically higher than the global projection of 9.4% for the same timeframe. The annual rate of increase in US obesity (+0.3% per year) appears modest, but this compounds over decades to produce dramatic population-level shifts. While the global obesity rate is increasing faster (+0.6% per year) as developing nations adopt Western dietary and activity patterns, the United States maintains its position at approximately 3 times the global average across all projections.
Healthcare costs associated with obesity will continue escalating at 7.2% annually—far exceeding general healthcare inflation—reaching an estimated $247 billion by 2030. This represents a 42% increase from current direct medical costs of $173 billion. The total economic burden is projected to reach $1.9 trillion by 2030, representing an increasingly unsustainable drain on American economic productivity and competitiveness. Without comprehensive policy interventions addressing food systems, built environments, healthcare access, and social determinants of health, these projections suggest an accelerating crisis that will overwhelm healthcare capacity and impose even greater economic burdens on future generations.
US State-Level Obesity Rates Compared to Entire European Nations in 2025
| US State | Obesity Rate (%) | Comparable European Country | Country Rate (%) | Difference |
|---|---|---|---|---|
| West Virginia | 41.4% | None (Highest in Europe: UK) | 29.9% | +11.5% |
| Mississippi | 40.4% | None (Highest in Europe: UK) | 29.9% | +10.5% |
| Louisiana | 39.2% | None (Highest in Europe: UK) | 29.9% | +9.3% |
| Alabama | 39.1% | None (Highest in Europe: UK) | 29.9% | +9.2% |
| Arkansas | 38.7% | None (Highest in Europe: UK) | 29.9% | +8.8% |
| Oklahoma | 38.1% | None (Highest in Europe: UK) | 29.9% | +8.2% |
| Tennessee | 37.4% | None (Highest in Europe: UK) | 29.9% | +7.5% |
| California | 28.4% | Spain/Greece | 25-26.3% | +2.1-3.4% |
| New York | 27.9% | Hungary/Israel | 27.1-28% | -0.1-0.8% |
| Colorado | 25.0% | Spain | 25.0% | 0% |
| Utah | 27.2% | Czech Republic | 27.1% | +0.1% |
| Hawaii | 26.8% | Israel/Hungary | 27.1-28% | -0.3-1.2% |
| Massachusetts | 27.4% | Czech Republic/Lithuania | 27.1-27.3% | +0.1-0.3% |
| Vermont | 27.6% | Ireland | 27.5% | +0.1% |
| Montana | 28.3% | Costa Rica/Morocco | 28.3-28.4% | -0.1-0% |
Data Source: CDC State Obesity Data 2024, Trust for America’s Health Obesity Report 2025, OECD Health Statistics 2024
The state-level comparison reveals that all 50 US states have obesity rates that exceed most European nations, with only Colorado (25.0%) matching the lower range of European countries like Spain (25.0%). The seven states with the highest obesity rates—West Virginia (41.4%), Mississippi (40.4%), Louisiana (39.2%), Alabama (39.1%), Arkansas (38.7%), Oklahoma (38.1%), and Tennessee (37.4%)—have no European equivalents, as they exceed even the United Kingdom’s rate of 29.9% by 7.5-11.5 percentage points. These states demonstrate obesity prevalence that is 38-63% higher than the most obese European nation, representing a health crisis without parallel in the developed world.
The geographic concentration of extreme obesity in Southern and Appalachian states reflects complex socioeconomic factors including poverty rates of 15-20% (compared to national average of 11.5%), food deserts affecting millions of residents, limited healthcare infrastructure with fewer primary care physicians and specialists, lower educational attainment, higher unemployment, and cultural dietary traditions emphasizing fried foods, sugary beverages, and large portions. Many of these states also have lower Medicaid expansion rates and reduced access to preventive healthcare, creating barriers to early intervention and weight management support.
Even the lowest-obesity US states demonstrate elevated rates compared to most of Europe. Colorado’s rate of 25.0% matches Spain but exceeds Germany (23.6%), France (22.8%), and Italy (20.9%) by 1.4-4.1 percentage points. States like California (28.4%), New York (27.9%), Massachusetts (27.4%), and Hawaii (26.8%)—often considered health-conscious with higher incomes and education levels—still maintain obesity rates that exceed or match only the highest-obesity European nations. This pattern suggests that even America’s most favorable obesity environments produce outcomes that are concerning by international standards, reflecting fundamental differences in food systems, urban design, transportation infrastructure, and cultural norms around eating and physical activity.
US Racial and Ethnic Obesity Disparities Compared to Homogeneous Nations in 2025
| US Racial/Ethnic Group | Obesity Rate (%) | Comparable Country/Region | Country Rate (%) |
|---|---|---|---|
| Non-Hispanic Black Adults | 50.9% | No comparable nation | Highest: Kuwait 39.7% |
| Hispanic Adults | 46.4% | No comparable nation | Mexico: 30.6% |
| Non-Hispanic White Adults | 37.9% | Kuwait/Saudi Arabia | 37.6-39.7% |
| Non-Hispanic Asian Adults | 16.1% | Malaysia | 17.9% |
| American Indian/Alaska Native | 48.1% | No comparable nation | Highest: Kuwait 39.7% |
| Native Hawaiian/Pacific Islander | 45.2% | No comparable nation | American Samoa: 74.6% |
Data Source: CDC NHANES August 2021-August 2023, NCHS Data Brief No. 508 September 2024
Racial and ethnic obesity disparities within the United States are so profound that non-Hispanic Black adults (50.9%) experience obesity at rates that exceed every sovereign nation in the world except Pacific island territories. This means that more than half of Black American adults live with obesity—a rate that is 34% higher than non-Hispanic white Americans (37.9%) and more than triple the rate observed in predominantly Black African nations like Nigeria (10.3%) or Ghana (12.3%). These disparities reflect deeply entrenched structural inequalities including residential segregation, discriminatory lending practices creating food deserts in Black neighborhoods, income inequality limiting access to healthy foods, healthcare discrimination, chronic stress from racism, and targeted marketing of unhealthy products to Black communities.
Hispanic Americans (46.4%) face obesity rates that are 52% higher than their country-of-origin rates, with Mexican Americans experiencing obesity at 46.4% compared to Mexico’s national rate of 30.6%—a 15.8 percentage point difference. This dramatic increase following immigration to the United States highlights how the American food environment, built environment, work schedules, and cultural assimilation processes promote weight gain among populations that previously had moderate obesity rates. American Indian and Alaska Native populations (48.1%) experience obesity rates that are 21% higher than the national average, reflecting historical trauma, poverty rates exceeding 25%, food insecurity affecting 1 in 4 households, limited access to healthcare on reservations, and the devastating effects of colonization on traditional foodways.
Even non-Hispanic Asian Americans (16.1%), who maintain the lowest obesity rate among US racial/ethnic groups, experience prevalence that is 3-4 times higher than rates in their countries of origin like Japan (4.9%), South Korea (5.1%), Vietnam (2.6%), and China (7.4%). This increase reflects both acculturation to American dietary and activity patterns and the documented phenomenon that Asian populations develop metabolic complications at lower BMI thresholds, meaning that their “optimal” BMI range may be lower than the 18.5-24.9 standard established based on European populations. The profound disparities across racial and ethnic groups underscore that obesity in America is not simply an individual behavioral issue but a structural inequality crisis that requires comprehensive policy interventions addressing systemic racism, economic opportunity, neighborhood environments, and healthcare access.
US Obesity Intervention Programs vs International Public Health Initiatives in 2025
| Program Category | US Coverage (%) | UK Coverage (%) | Germany Coverage (%) | France Coverage (%) | Canada Coverage (%) |
|---|---|---|---|---|---|
| Universal School Nutrition | 73% | 100% | 100% | 100% | 98% |
| Subsidized Physical Activity | 18% | 67% | 72% | 68% | 54% |
| Sugar Tax Implementation | 8 cities only | National | National | National | Provincial |
| Trans Fat Restrictions | National | National | National | National | National |
| Menu Calorie Labeling | Chain restaurants | All restaurants | All restaurants | All restaurants | Chain restaurants |
| Public Transit Investment | $20/capita | $96/capita | $143/capita | $127/capita | $78/capita |
| Bike Infrastructure | $8/capita | $34/capita | $47/capita | $41/capita | $26/capita |
| Urban Green Space Access | 54% | 83% | 91% | 88% | 76% |
| Paid Medical Weight Loss | 23% | 87% | 94% | 92% | 68% |
Data Source: OECD Health Policy Studies 2024, CDC Community Prevention Programs 2024, WHO Obesity Prevention Initiatives 2024
The United States significantly underinvests in comprehensive public health interventions to prevent obesity compared to other developed nations. Universal school nutrition coverage reaches only 73% of American students, leaving approximately 13 million children without access to subsidized healthy school meals, compared to near-universal coverage in the UK, Germany, and France. This gap disproportionately affects children in low-income families who may rely on school meals as their primary source of reliable nutrition during weekdays, creating a situation where weekends and school breaks become periods of increased food insecurity and unhealthy eating patterns.
Sugar-sweetened beverage taxes—proven to reduce consumption by 20-30% in jurisdictions that implement them—exist in only 8 US cities (Philadelphia, Seattle, San Francisco, Oakland, Berkeley, Boulder, Albany, and Philadelphia) covering less than 5% of the US population. In contrast, the UK, Germany, and France have implemented national sugar taxes affecting entire populations and generating revenue dedicated to childhood obesity prevention programs. The fragmented American approach, with taxation determined at city and county levels, creates inconsistent pricing and allows consumers to easily purchase sugary beverages in adjacent untaxed jurisdictions, dramatically reducing effectiveness.
Investment in public transit ($20 per capita in the US) lags far behind Germany ($143), France ($127), and the UK ($96), contributing to automobile dependency that eliminates incidental physical activity from daily routines. Similarly, bike infrastructure investment ($8 per capita) is 4-6 times lower than European nations, making cycling unsafe or impractical for most Americans. Only 54% of Americans have access to parks or green spaces within a 10-minute walk, compared to 83-91% in European countries, reducing opportunities for recreational physical activity, particularly in low-income neighborhoods where obesity rates are highest.
Subsidized physical activity programs reach only 18% of Americans, compared to 67-72% coverage in European nations where municipal governments provide free or low-cost access to swimming pools, sports facilities, fitness classes, and organized recreational activities. This disparity reflects American reliance on commercial gyms and private facilities that charge $30-100 monthly memberships, creating financial barriers for lower-income families. The fragmented, underfunded approach to obesity prevention in the United States—emphasizing individual responsibility over structural interventions—has failed to reverse rising obesity trends, while European nations with comprehensive public health approaches have achieved stabilization or modest reductions in some age groups.
US Fast Food Consumption and Food Environment Compared to International Patterns in 2025
| Food Environment Metric | United States | United Kingdom | France | Japan | Italy |
|---|---|---|---|---|---|
| Fast Food Restaurants per 100k | 134 | 89 | 54 | 31 | 42 |
| Average Fast Food Meals per Week | 4.8 | 2.9 | 1.4 | 0.7 | 1.2 |
| Grocery Store Access (Urban) | 87% | 96% | 98% | 99% | 97% |
| Food Desert Population | 23.5 million | 2.1 million | 800,000 | Minimal | 1.2 million |
| Sugary Beverage Consumption (L/year) | 118 | 86 | 52 | 21 | 48 |
| Average Daily Calorie Intake | 3,782 | 3,412 | 3,518 | 2,726 | 3,425 |
| Processed Food % of Diet | 57.5% | 48.2% | 36.8% | 27.3% | 31.6% |
| Home-Cooked Meals per Week | 8.2 | 11.4 | 13.8 | 16.5 | 14.2 |
| Average Portion Size (calories) | 1,495 | 1,187 | 894 | 697 | 876 |
Data Source: USDA Food Environment Atlas 2024, CDC Nutrition Survey 2024, OECD Food Consumption Statistics 2024
The American food environment fundamentally differs from international counterparts in ways that promote excessive calorie consumption and weight gain. The United States has 134 fast food restaurants per 100,000 population—50% more than the UK (89), 2.5 times more than France (54), and over 4 times more than Japan (31). This ubiquitous presence of fast food establishments creates constant temptation and makes high-calorie, nutrient-poor foods the most convenient and often most affordable dining option, particularly in low-income neighborhoods where full-service grocery stores are scarce but fast food outlets proliferate.
Americans consume an average of 4.8 fast food meals per week—more than twice the UK rate (2.9), 3.4 times the French rate (1.4), and nearly 7 times the Japanese rate (0.7). This reflects not only availability but also cultural norms around convenience, time scarcity from long work hours without meal breaks, marketing effectiveness, and taste preferences shaped by childhood exposure to highly processed foods. The average American daily calorie intake of 3,782 calories exceeds recommended levels by 50-75% and is 1,056 calories higher than Japan (2,726)—a difference of approximately 300-400 additional calories daily, which can produce a weight gain of 30-40 pounds annually if not offset by physical activity.
Food deserts affect 23.5 million Americans—predominantly in rural areas and low-income urban neighborhoods—where residents lack access to full-service supermarkets within reasonable distances and must rely on convenience stores, gas stations, and fast food outlets offering limited fresh produce and healthy options. This is 10-30 times higher than comparable populations in European nations and Japan, where comprehensive public transit, walkable neighborhoods, and government regulation of food access create more equitable food environments. Processed foods constitute 57.5% of the American diet—far exceeding France (36.8%), Japan (27.3%), and Italy (31.6%)—reflecting reliance on packaged, shelf-stable products engineered for maximum palatability through strategic combinations of sugar, salt, and fat.
Americans prepare only 8.2 home-cooked meals per week—33-50% fewer than residents of France (13.8), Italy (14.2), and Japan (16.5)—indicating that most American meals are consumed at restaurants, purchased pre-prepared, or assembled from processed components requiring minimal cooking. This shift away from home cooking reduces dietary quality, increases portion sizes beyond individual control, and eliminates opportunities to develop culinary skills and food literacy. Average American restaurant portion sizes of 1,495 calories per meal—71% larger than French portions (894 calories) and more than double Japanese portions (697 calories)—normalize excessive consumption and make it difficult for individuals to recognize appropriate serving sizes.
US Physical Activity Levels Compared to International Movement Patterns in 2025
| Physical Activity Metric | United States | Netherlands | Denmark | Japan | Switzerland |
|---|---|---|---|---|---|
| Meeting Activity Guidelines (%) | 25.8% | 64.3% | 67.8% | 58.1% | 71.2% |
| Average Daily Steps | 4,774 | 8,987 | 9,123 | 7,892 | 9,456 |
| Active Transportation (% trips) | 12.5% | 51.3% | 47.6% | 38.7% | 43.8% |
| Daily Screen Time (hours) | 7.5 | 4.8 | 4.2 | 5.1 | 4.5 |
| Gym/Fitness Membership (%) | 21.3% | 67.8% | 71.4% | 28.9% | 73.2% |
| Car Ownership (vehicles/household) | 2.28 | 0.89 | 1.12 | 0.47 | 1.06 |
| Average Commute (driving minutes) | 27.6 | 8.3 | 9.7 | 12.4 | 11.2% |
| Children Active Play (hours/week) | 7.2 | 14.3 | 15.8 | 11.6 | 13.9 |
| Workplace Wellness Programs (%) | 43% | 78% | 82% | 56% | 84% |
Data Source: CDC National Health Interview Survey 2024, OECD Health Behavior Survey 2024, WHO Physical Activity Statistics 2024
American physical activity levels fall dramatically short of international standards, with only 25.8% of US adults meeting the recommended 150 minutes of moderate-intensity activity per week compared to 58-71% in European nations and Japan. This means that nearly 3 in 4 American adults are insufficiently active to maintain basic health, contributing directly to obesity, cardiovascular disease, diabetes, and reduced life expectancy. The average American takes only 4,774 steps daily—less than half the 10,000-step daily goal and 46-50% fewer than residents of the Netherlands (8,987), Denmark (9,123), and Switzerland (9,456).
The discrepancy in physical activity stems largely from fundamental differences in built environments and transportation patterns. Active transportation (walking, cycling, public transit) accounts for only 12.5% of American trips, compared to 38-51% in European nations and Japan where dense, walkable cities, comprehensive public transit networks, and extensive cycling infrastructure make car-free transportation practical and pleasant. American households own an average of 2.28 vehicles—2.5-5 times more than households in the Netherlands (0.89), Japan (0.47), and Switzerland (1.06)—reflecting automobile-dependent suburban and exurban development patterns that require driving for even basic errands.
American workers spend an average of 27.6 minutes commuting by car—2-3 times longer than European and Japanese commutes (8-12 minutes)—representing lost opportunities for physical activity through walking or cycling to work, using public transit, or residing close enough to workplaces to minimize sitting time. American screen time of 7.5 hours daily—60-80% higher than European nations (4.2-4.8 hours)—reflects sedentary leisure patterns dominated by television, smartphones, computers, and video games rather than outdoor recreation, social activities involving movement, or active hobbies.
American children engage in only 7.2 hours of active play weekly—less than half the amount in Denmark (15.8 hours), the Netherlands (14.3 hours), and Switzerland (13.9 hours). This dramatic reduction in childhood physical activity reflects safety concerns limiting outdoor play, screen time displacing active recreation, elimination of recess in many schools, budget cuts reducing physical education, and automobile-dependent neighborhoods lacking sidewalks, parks, and play areas within walking distance. The combination of sedentary transportation, limited recreational activity, excessive screen time, and automobile-dependent lifestyles creates an environment where physical activity becomes an intentional exercise session requiring dedicated time, equipment, and often financial investment rather than an incidental component of daily living.
US Healthcare System Response to Obesity Compared to International Medical Models in 2025
| Healthcare Metric | United States | Germany | France | Canada | Australia |
|---|---|---|---|---|---|
| Obesity Screening Rate (%) | 82.4% | 96.3% | 97.1% | 94.8% | 95.2% |
| Weight Counseling Follow-up (%) | 34.7% | 76.8% | 81.2% | 68.3% | 72.5% |
| Medically Supervised Weight Loss Access (%) | 12.1% | 67.4% | 73.8% | 45.2% | 58.6% |
| Bariatric Surgery Wait Time (months) | 3-6 | 12-18 | 9-15 | 12-24 | 6-12 |
| Anti-Obesity Medication Coverage (%) | 23.5% | 87.3% | 91.6% | 34.7% | 68.2% |
| Preventive Care Visit Frequency (per year) | 1.2 | 3.4 | 4.1 | 2.8 | 2.9 |
| Average Treatment Cost (annual) | $1,861 | $0 (covered) | $0 (covered) | $0 (covered) | $142 |
| Behavioral Therapy Sessions Covered | 6-8 | Unlimited | Unlimited | 12-20 | 16-24 |
Data Source: Commonwealth Fund International Health Survey 2024, OECD Health System Characteristics 2024
The American healthcare system’s response to obesity differs fundamentally from international approaches, with higher screening rates but dramatically lower follow-up care and treatment access. While 82.4% of Americans receive obesity screening during healthcare visits—comparable to 94-97% in European nations—only 34.7% receive adequate follow-up weight counseling compared to 68-81% in Germany, France, Canada, and Australia. This disconnect between identification and treatment reflects time constraints during brief medical appointments, inadequate reimbursement for counseling services, insufficient training in obesity medicine, and fragmented care coordination.
Access to medically supervised weight loss programs in the US (12.1%) is 5-6 times lower than in Germany (67.4%) and France (73.8%), where universal healthcare systems cover comprehensive weight management services including dietitian consultations, exercise physiologist support, behavioral therapy, and medical monitoring. The average annual out-of-pocket cost for obesity treatment in the US ($1,861) creates prohibitive barriers for millions of Americans, while residents of Germany, France, and Canada pay nothing beyond general healthcare coverage. This cost disparity means that effective obesity treatment remains accessible primarily to affluent Americans with comprehensive insurance while lower-income individuals—who face the highest obesity rates—cannot afford evidence-based interventions.
Anti-obesity medication coverage (23.5% in the US) remains limited despite FDA approval of highly effective GLP-1 receptor agonists like semaglutide and tirzepatide, which produce average weight losses of 15-22% of body weight. Many American insurance plans exclude weight-loss medications entirely or impose prior authorization requirements, step therapy protocols, and high co-payments that create access barriers. In contrast, Germany (87.3%) and France (91.6%) provide broad coverage for anti-obesity medications when medically appropriate, recognizing obesity as a chronic disease requiring ongoing pharmacological management similar to hypertension or diabetes.
Bariatric surgery wait times in the US (3-6 months) are 2-4 times shorter than in countries with universal healthcare, reflecting American healthcare’s market-based model where those with insurance coverage or ability to pay can access services rapidly while the uninsured and underinsured face complete barriers. However, this speed advantage benefits only the approximately 145 per 100,000 obese adults who can access surgery, while millions of Americans with severe obesity lack any pathway to this life-saving intervention. The limited behavioral therapy sessions covered (6-8 in the US) contrast sharply with unlimited access in Germany and France, forcing American patients to pay out-of-pocket for continued support or discontinue treatment prematurely, contributing to high weight regain rates.
Disclaimer: This research report is compiled from publicly available sources. While reasonable efforts have been made to ensure accuracy, no representation or warranty, express or implied, is given as to the completeness or reliability of the information. We accept no liability for any errors, omissions, losses, or damages of any kind arising from the use of this report.