Biggest City in Canada 2025
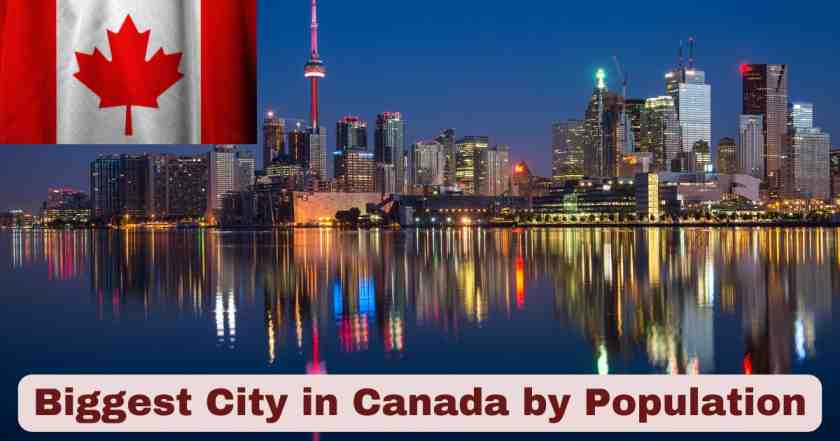
When it comes to urban population rankings across the vast Canadian landscape, one metropolis stands head and shoulders above all others. Toronto, located in the province of Ontario, holds the distinction of being the biggest city in Canada by population in 2025, maintaining its position as the country’s primary urban center and economic powerhouse. This bustling metropolitan area has experienced unprecedented growth patterns that distinguish it not only within Canadian borders but also positions it as one of the fastest-growing major cities across the entire North American continent.
The Toronto Census Metropolitan Area has achieved a remarkable milestone by surpassing the 7 million population mark as of July 1, 2024, according to official Statistics Canada data released in January 2025. This represents an extraordinary annual population increase of 268,911 people or a growth rate of 3.9%, making it the largest single-year population gain in Toronto’s recorded history. To put this explosive growth into perspective, the entire nation of Canada averaged only approximately 400,000 people in total annual population increases from 2010 to 2019, which means Toronto alone absorbed more than half of what the entire country typically gained in a single year during that period.
Interesting Stats & Facts about the Biggest City in Canada 2025
| Key Facts | Details |
|---|---|
| Largest City Status | Toronto is Canada’s most populous city and has been since surpassing Montreal in the 2001 census |
| Metro Population Milestone | Toronto CMA exceeded 7.1 million people as of July 2024 |
| City Proper Population | Approximately 2.79 million residents within city limits (2021 Census) |
| Annual Growth Rate | 3.9% year-over-year growth (July 2023-July 2024) |
| North American Ranking | 4th most populous city in North America |
| Population Density | 4,427.8 people per km² within city limits |
| Metro Area Size | 5,902 square kilometers spanning from Lake Simcoe to Lake Ontario |
| Immigration Impact | 46.7% of all Canadian immigrants settle in the top three CMAs, with 27.7% choosing Toronto |
| Foreign-Born Population | Nearly 50% of Toronto’s residents were born outside Canada |
| Economic Contribution | Toronto contributes approximately 20% of Canada’s total GDP |
| International Migration Driver | Over 200,000 non-permanent residents added in the 12-month period ending July 2024 |
| Fastest Growing in North America | Toronto’s 221,588 population increase (2022-2023) exceeded Dallas (152,598) and Houston (139,789) |
Data Source: Statistics Canada – Canada’s population estimates: Subprovincial areas, 2024 (Released January 16, 2025)
The remarkable statistics presented in this table reveal Toronto’s dominant position as the biggest city in Canada by population in 2025. The city’s status as the nation’s largest urban center has been uncontested since it overtook Montreal in the 2001 census, and the gap between Toronto and other Canadian cities continues to widen with each passing year. The 7.1 million population milestone achieved in mid-2024 represents a watershed moment in Canadian urban development, reflecting decades of sustained growth fueled primarily by international immigration and the arrival of non-permanent residents seeking employment and educational opportunities.
What makes these numbers particularly significant is the 3.9% annual growth rate recorded between July 2023 and July 2024, which not only exceeded the national Canadian average of 3.0% but also surpassed the growth rates of most major American metropolitan areas. The population density of 4,427.8 people per square kilometer within Toronto’s city limits demonstrates how urbanization continues to intensify in this already-crowded metropolis, though this density remains considerably lower than many comparable global cities like Barcelona or Paris. The foreign-born population statistic of nearly 50% underscores Toronto’s reputation as one of the world’s most multicultural cities, second only to Miami in terms of the proportion of residents born outside the country, according to UN Development Program rankings.
Top 5 Biggest Cities in Canada by Population 2025
| Rank | City | Province | CMA Population (2024) | City Proper Population | Annual Growth Rate | Area (km²) |
|---|---|---|---|---|---|---|
| 1 | Toronto | Ontario | 7,106,379 | 2,794,356 | 3.9% | 5,902 |
| 2 | Montreal | Quebec | 4,615,154 | 1,762,949 | 2.9% | 4,604 |
| 3 | Vancouver | British Columbia | 3,108,941 | 662,248 | 4.2% | 2,878 |
| 4 | Calgary | Alberta | 1,680,000 | 1,305,550 | 5.8% | 5,110 |
| 5 | Edmonton | Alberta | 1,560,000 | 1,062,643 | 4.5% | 9,416 |
Data Source: Statistics Canada – Canada’s population estimates: Subprovincial areas, 2024 (Released January 16, 2025)
The ranking of Canada’s top 5 biggest cities by population in 2025 clearly demonstrates Toronto’s commanding lead, with a Census Metropolitan Area population that is 54% larger than second-place Montreal. This substantial gap of more than 2.4 million people between the first and second-ranked cities highlights the extraordinary concentration of Canada’s urban population within the Greater Toronto Area. Montreal, despite being Canada’s second-largest city with 4.6 million residents in its metropolitan area, grew at a more modest 2.9% annual rate, adding close to 132,000 people in the year ending July 2024.
Vancouver’s position as the third-largest city in Canada was solidified when its metropolitan population surpassed the 3 million mark in 2024, reaching 3,108,941 residents. Remarkably, Vancouver’s 4.2% growth rate actually exceeded Toronto’s, making it one of the fastest-growing major metropolitan areas in the country. However, Vancouver’s significantly smaller base population means that despite its impressive growth percentage, it added approximately 127,000 people in absolute numbers, compared to Toronto’s 269,000 new residents.
The Alberta cities of Calgary and Edmonton round out the top 5 biggest cities in Canada in 2025, both experiencing extraordinary population surges. Calgary’s 5.8% growth rate represents the fastest expansion among all 41 Census Metropolitan Areas tracked by Statistics Canada, and remarkably, it stands as the fastest 12-month growth rate recorded by any CMA since comparable data collection began in 2001. Calgary gained more than 20,000 people through interprovincial migration alone, with Albertans moving from other provinces seeking employment opportunities in the energy sector and related industries. Edmonton’s 4.5% growth similarly reflects Alberta’s economic attractiveness, with the capital city benefiting from substantial interprovincial migration gains of nearly 14,000 people.
Population Growth Trends in Canada 2025
| Growth Factor | Toronto CMA | Montreal CMA | Vancouver CMA | National Average |
|---|---|---|---|---|
| Total Population Growth (2023–2024) | +268,911 | +131,952 | +127,118 | +1,030,000 |
| Growth Rate (%) | 3.9% | 2.9% | 4.2% | 3.0% |
| Non-Permanent Residents Added | +200,000+ | +100,000+ | +100,000+ | Major driver |
| New Immigrants | 128,662 | 76,394 | 11,872 | 464,265 |
| Interprovincial Migration | -9,819 | -6,667 | -5,709 | N/A |
| Intraprovincial Migration | -69,522 | -21,901 | -15,193 | N/A |
Data Source: Statistics Canada – Canada’s population estimates: Subprovincial areas, 2024 (Released January 16, 2025)
The population growth patterns observed in the biggest cities in Canada during 2025 reveal a complex demographic story driven primarily by international migration rather than domestic movement. For the second consecutive year, the increase in non-permanent residents emerged as the most important source of population growth among Canada’s three largest metropolitan areas. Non-permanent residents include temporary workers holding work permits, international students enrolled in Canadian educational institutions, and asylum claimants awaiting determination of their refugee status. Toronto added over 200,000 non-permanent residents in the 12-month period ending July 2024, representing the highest net gain in NPRs ever recorded for the city.
The arrival of permanent immigrants constituted the second-most significant contributor to population expansion in these major urban centers. Of the 464,265 immigrants who were granted permanent residency and settled in Canada during the measurement period, almost half (46.7%) chose to establish their new homes in one of the big three CMAs. Toronto alone attracted more than one-quarter (27.7% or 128,662) of all new immigrants to Canada, reinforcing its status as the nation’s primary destination for newcomers seeking opportunities in North America.
However, these substantial international migration gains were partially offset by negative internal migration patterns. All three of Canada’s largest cities experienced net losses through both interprovincial and intraprovincial migration, meaning more people moved away from these metropolitan areas to other parts of Canada than moved to them. Toronto recorded interprovincial migration losses of 9,819 people, though this represented an improvement over the previous year’s losses. More significantly, Toronto experienced intraprovincial migration losses of 69,522 residents, indicating that many people are choosing to relocate from Toronto to other communities within Ontario, likely driven by housing affordability concerns and the appeal of smaller urban centers or suburban communities.
Metropolitan Area vs City Proper Population in Canada 2025
| City | Census Metropolitan Area Population | City Proper Population | Difference | Metro-to-City Ratio |
|---|---|---|---|---|
| Toronto | 7,106,379 | 2,794,356 | 4,312,023 | 2.54:1 |
| Montreal | 4,615,154 | 1,762,949 | 2,852,205 | 2.62:1 |
| Vancouver | 3,108,941 | 662,248 | 2,446,693 | 4.69:1 |
| Calgary | 1,680,000 | 1,305,550 | 374,450 | 1.29:1 |
| Ottawa | 1,068,821 | 1,017,449 | 51,372 | 1.05:1 |
Data Source: Statistics Canada – 2021 Census and 2024 population estimates
Understanding the distinction between Census Metropolitan Area population and city proper population is essential when analyzing the biggest cities in Canada by population in 2025. A Census Metropolitan Area represents a much broader geographic region that includes the core city plus all surrounding municipalities that demonstrate high integration with the urban center, measured through commuting patterns and economic ties. In contrast, city proper population counts only those residents living within the official municipal boundaries of the primary city itself.
Toronto’s 2.54:1 ratio indicates that for every person living within Toronto’s official city limits, another 1.54 people reside in the surrounding communities that form part of the greater metropolitan region. This includes major urban municipalities such as Mississauga, Brampton, Markham, Vaughan, Richmond Hill, and Oakville, all of which function as integral components of the Greater Toronto economic and social ecosystem. The 4.3 million people living in Toronto’s metropolitan area but outside the city proper represents a population larger than the entire metropolitan area of Montreal.
Vancouver exhibits the most dramatic disparity, with a 4.69:1 ratio showing that the metropolitan area population is nearly five times larger than the city proper. This extreme ratio reflects Vancouver’s unique geographic constraints, with the core city occupying a relatively small peninsula surrounded by water and mountains, forcing suburban development to spread across multiple distinct municipalities throughout the Lower Mainland region. The 2.4 million people living in the Vancouver metropolitan area but outside the city itself reside in communities like Surrey, Burnaby, Richmond, Coquitlam, and dozens of other municipalities that together form Canada’s third-largest urban agglomeration.
Population Density Comparison of Major Canadian Cities 2025
| City | Population Density (per km²) | Land Area (km²) | Total Population | Density Rank in Canada |
|---|---|---|---|---|
| Vancouver | 5,493 | 115 | 662,248 | 1 |
| Toronto | 4,427.8 | 631.1 | 2,794,356 | 2 |
| Montreal | 4,917 | 365.1 | 1,762,949 | 3 |
| Calgary | 1,592 | 825.3 | 1,305,550 | 4 |
| Edmonton | 1,360 | 685.3 | 1,062,643 | 5 |
Data Source: Statistics Canada – 2021 Census data
The population density statistics for the biggest cities in Canada in 2025 reveal significant variations in how urban populations are distributed across the Canadian landscape. Vancouver maintains its position as Canada’s most densely populated major city with 5,493 people per square kilometer, a density that reflects the city’s geographic constraints and expensive real estate market that encourages vertical development and compact living arrangements. Despite this high density by Canadian standards, Vancouver remains far less crowded than comparable global cities, with New York and London both exceeding 10,000 people per square kilometer.
Toronto’s population density of 4,427.8 people per square kilometer ranks as the second-highest among major Canadian cities, though this figure has been steadily increasing as development intensifies along transit corridors and in the downtown core. The city has approved numerous high-rise residential towers in recent years, particularly in neighborhoods like the Waterfront Communities, Bay Street Corridor, and along the Yonge Street subway line. This density level, while substantial, remains approximately one-quarter of what Barcelona experiences (15,873 per km²) and roughly one-third of Paris’s density.
The significantly lower density figures for Calgary (1,592 per km²) and Edmonton (1,360 per km²) reflect the Prairie cities’ sprawling suburban development patterns and abundant land availability. Both cities have expanded their boundaries considerably over decades, incorporating extensive single-family residential neighborhoods, large commercial developments, and industrial zones that contribute to lower overall population density. However, even these less dense cities face increasing pressure to intensify development along transit routes and in established neighborhoods as population growth accelerates and concerns about urban sprawl intensify.
Immigration and Migration Patterns in Canada 2025
| Immigration Category | Toronto | Montreal | Vancouver | Total Canada | Toronto’s Share |
|---|---|---|---|---|---|
| New Permanent Residents | 128,662 | 76,394 | 11,872 | 464,265 | 27.7% |
| Non-Permanent Residents Added | 200,000+ | 100,000+ | 100,000+ | 800,000+ | 25%+ |
| Interprovincial Migration (Net) | -9,819 | -6,667 | -5,709 | Variable | Negative |
| Intraprovincial Migration (Net) | -69,522 | -21,901 | -15,193 | Variable | Negative |
| Total Population Growth | +268,911 | +131,952 | +127,118 | +1,030,000 | 26.1% |
Data Source: Statistics Canada – Canada’s population estimates: Subprovincial areas, 2024 (Released January 16, 2025)
The immigration and migration data for the biggest cities in Canada in 2025 illustrates how international arrivals have become the overwhelming driver of urban population growth while domestic migration patterns work in the opposite direction. Toronto’s ability to attract 128,662 new permanent residents in a single year, representing more than one-quarter of all immigrants to Canada, demonstrates the city’s continued appeal to newcomers from around the world. These permanent residents come predominantly from Asian countries, with India, Philippines, and China representing the top three source nations, though significant numbers also arrive from Middle Eastern countries, Africa, and Latin America.
The explosion in non-permanent resident populations has emerged as perhaps the most significant demographic trend affecting the biggest city in Canada by population in 2025. Toronto added over 200,000 non-permanent residents in the 12-month period ending July 2024, an unprecedented influx that includes international students attending the city’s numerous universities and colleges, temporary foreign workers filling labor shortages across various sectors, and asylum claimants awaiting determination of their refugee claims. This surge in temporary residents has placed enormous pressure on housing markets, healthcare systems, and other municipal services.
The negative interprovincial and intraprovincial migration figures paint a concerning picture for Toronto’s long-term demographic health. The 69,522 net loss through intraprovincial migration indicates that more Torontonians are relocating to other Ontario communities than are moving to Toronto from elsewhere in the province. This “urban flight” phenomenon appears driven primarily by housing affordability challenges, with the average home price in Toronto exceeding $1 million while smaller Ontario cities like Hamilton, London, and Kingston offer more affordable alternatives. Alberta emerged as the primary beneficiary of interprovincial migration, gaining 43,750 people from other provinces, with Calgary alone receiving a net gain of 20,859 residents through interprovincial moves.
Economic Impact of Population Growth in Canada 2025
| Economic Indicator | Toronto Impact | National Comparison | Growth Implications |
|---|---|---|---|
| GDP Contribution | 20% of Canada’s GDP | Largest metro contributor | Sustained economic engine |
| Employment Growth (2018–2019) | +46,000 jobs | 3.1% annual increase | Strong job market |
| New Business Establishments (2019) | 3,180 businesses | Leading entrepreneurship | Business-friendly environment |
| Labor Force Size | 4.7 million people | Largest in Canada | Talent pool advantage |
| Housing Market Value | $1+ million average | 3× Montreal average | Affordability crisis |
| Film Industry Employment | 28,000 people | $1.5 billion annually | Diversified economy |
| Financial Sector Employment | 25% of national workforce | Highest concentration | Finance hub status |
Data Source: Multiple sources including Statistics Canada and industry reports
The economic implications of Toronto’s status as the biggest city in Canada by population in 2025 extend far beyond simple demographic statistics. As the nation’s largest urban center, Toronto functions as Canada’s primary economic engine, generating approximately 20% of the country’s entire GDP despite housing only about 18% of the national population. This productivity premium reflects Toronto’s concentration of high-value economic activities including financial services, technology companies, professional services, and advanced manufacturing operations.
The city’s labor force of 4.7 million people provides Canadian and international companies with access to one of North America’s largest and most diverse talent pools. Toronto’s workforce includes substantial numbers of highly educated professionals in fields ranging from software engineering and data science to finance, law, and healthcare. The employment growth of 46,000 jobs between 2018 and 2019 (pre-pandemic) demonstrated the market’s dynamism, with the 3.1% annual increase exceeding both provincial and national averages. The financial services sector alone employs more people in Toronto than in any other Canadian city, with 25% of Canada’s national financial workforce concentrated in the Greater Toronto Area.
However, the explosive population growth has also created significant economic challenges, most notably in the housing market. The average price of homes sold in Toronto has surged past $1 million, creating an affordability crisis that affects younger workers, newcomers, and middle-income families. This represents more than triple Montreal’s average home price of approximately $385,000 and has forced many residents to either pay extremely high housing costs relative to their incomes or relocate to more affordable communities. The housing shortage has become so acute that it threatens Toronto’s ability to attract and retain the skilled workers necessary to sustain its economic growth trajectory.
Urban Development and Infrastructure Challenges in Canada 2025
| Infrastructure Category | Current Status | Growth Pressure | Future Requirements |
|---|---|---|---|
| Housing Units Needed | Significant shortage | 268,911 annual population increase | 100,000+ units annually |
| Public Transit Capacity | System at capacity | 7.1 million metro residents | Major expansion required |
| Healthcare Access | Strained system | Rising wait times | Additional hospitals and clinics |
| Educational Facilities | Overcrowded schools | Growing student population | New schools and expansions |
| Utilities and Services | Aging infrastructure | Increasing demand | Upgrades and expansion |
| Parks and Recreation | 8,000 hectares current | Density increasing | More public spaces needed |
| Transportation Networks | Congested roads | High vehicle volume | Road and transit improvements needed |
Data Source: City of Toronto planning documents and Statistics Canada
The infrastructure challenges facing the biggest city in Canada by population in 2025 represent one of the most pressing policy concerns for federal, provincial, and municipal governments. The annual population increase of 268,911 people in the Toronto metropolitan area during the 2023-2024 period is equivalent to adding a city the size of Kitchener or Windsor every single year. This explosive growth requires massive investment in housing construction, public transit expansion, healthcare facilities, schools, utilities, and recreational amenities to maintain livable conditions and quality of life standards.
The housing shortage stands as the most visible and politically contentious infrastructure deficit. With the metropolitan area gaining more than a quarter-million residents annually, Toronto would need to construct approximately 100,000 new housing units per year just to keep pace with demand, assuming average household sizes of 2.5 to 2.7 people. However, actual housing construction has fallen far short of this requirement, leading to escalating prices, deteriorating rental vacancy rates (below 2% in many neighborhoods), and increasing homelessness. The City of Toronto has approved numerous high-density residential developments, particularly in the downtown core and along transit corridors, but construction timelines and regulatory processes mean many of these units won’t become available for years.
Public transit capacity represents another critical bottleneck as the 7.1 million metropolitan residents place unprecedented demands on bus, subway, and commuter rail systems. The Toronto Transit Commission (TTC) operates the busiest urban transit system in Canada, carrying more than 500 million passenger trips annually (pre-pandemic levels), but many subway lines and bus routes operate at or beyond designed capacity during peak periods. Major transit expansion projects including the Ontario Line, Scarborough Subway Extension, and Eglinton Crosstown LRT are under construction, but even these multi-billion dollar investments will barely keep pace with population growth rather than meaningfully reducing congestion.
Comparative Growth Rates – Canadian vs North American Cities 2025
| City/Metro Area | Country | Annual Growth Rate | Population Added (2022-2023) | Total Population |
|---|---|---|---|---|
| Calgary | Canada | 5.8% | 91,000+ | 1,680,000 |
| Moncton | Canada | 5.1% | 15,000+ | 171,000 |
| Kitchener-Cambridge-Waterloo | Canada | 4.9% | 32,000+ | 687,000 |
| Peterborough | Canada | 4.5% | 5,700+ | 136,000 |
| Edmonton | Canada | 4.5% | 67,000+ | 1,560,000 |
| Vancouver | Canada | 4.2% | 127,118 | 3,108,941 |
| Toronto | Canada | 3.9% | 268,911 | 7,106,379 |
| Dallas-Fort Worth | USA | 1.9% | 152,598 | 8,100,000 |
| Houston | USA | 1.7% | 139,789 | 7,510,000 |
| Phoenix | USA | 1.5% | 72,000 | 4,900,000 |
Data Source: Statistics Canada and U.S. Census Bureau data
When comparing growth rates across North America, Canadian cities, and particularly the biggest cities in Canada in 2025, are experiencing population expansion at rates that dramatically exceed those of comparable American metropolitan areas. Calgary’s extraordinary 5.8% growth rate stands as the fastest among all 41 Census Metropolitan Areas in Canada and represents a pace of expansion unmatched by any major American city. This remarkable growth reflects Alberta’s strong economic fundamentals, relatively affordable housing compared to Toronto and Vancouver, and aggressive interprovincial migration from other Canadian provinces.
Toronto’s 3.9% growth rate, while lower than several smaller Canadian cities, translates into the largest absolute population gain of any metropolitan area in either Canada or the United States during the 2022-2023 measurement period. The 268,911 new residents added to the Toronto metropolitan area exceeded the growth experienced by much larger American metros including Dallas-Fort Worth (152,598) and Houston (139,789). To put this in perspective, Toronto’s annual population increase alone would rank as the 50th largest city in Canada if it were its own municipality.
The substantial gap between Canadian and American urban growth rates reflects fundamental differences in immigration policies and population dynamics between the two countries. Canada’s federal government has set aggressive immigration targets, welcoming more than 400,000 permanent residents annually, plus hundreds of thousands of temporary residents including international students and temporary workers. In contrast, the United States has experienced declining immigration levels and faces significant political controversy over immigration policy, resulting in more modest population growth in American cities despite their larger economic scale.
Future Population Projections for Canada 2025-2035
| Projection Category | Toronto CMA | Montreal CMA | Vancouver CMA | Canada Total |
|---|---|---|---|---|
| 2025 Estimated Population | 7,300,000 | 4,700,000 | 3,200,000 | 40,500,000 |
| 2030 Projected Population | 8,200,000 | 5,100,000 | 3,600,000 | 43,500,000 |
| 2035 Projected Population | 9,000,000+ | 5,500,000 | 4,000,000 | 46,500,000 |
| Growth 2025-2035 | +1,700,000 | +800,000 | +800,000 | +6,000,000 |
| Average Annual Growth | 170,000/year | 80,000/year | 80,000/year | 600,000/year |
Data Source: Statistics Canada population projections and Ontario Ministry of Finance forecasts
Population projection models for the biggest cities in Canada by population through 2035 suggest continued rapid expansion, though growth rates may moderate somewhat from the extraordinary peaks observed in 2023 and 2024. The Toronto Census Metropolitan Area is projected to reach 9 million residents by 2035, adding approximately 1.7 million people over the decade. This would represent a population larger than the current entire province of Quebec concentrated within the Greater Toronto region alone. The Ontario Ministry of Finance has published estimates suggesting the Greater Toronto Area population could reach 7.7 million by 2025 and potentially 9.7 million by 2036.
These projections assume that current immigration levels remain relatively stable, that Canada continues to welcome 400,000 to 500,000 permanent residents annually, and that Toronto maintains its market share of approximately 25-30% of all national immigration. However, these forecasts face significant uncertainty due to recent federal government policy changes announced in late 2024, which slashed immigration targets by approximately 20% and imposed new restrictions on international student work permits. These policy shifts could slow the influx of non-permanent residents, potentially reducing growth rates in the largest metropolitan areas.
Montreal’s projected growth to 5.5 million by 2035 would maintain its position as Canada’s second-largest city but would see the gap with Toronto widen to approximately 3.5 million people. Vancouver’s anticipated expansion to 4 million residents by 2035 would solidify its status as the country’s third-largest metropolitan area and would represent a doubling of the city’s population over roughly 30 years. These projections carry enormous implications for housing policy, infrastructure investment, environmental sustainability, and social cohesion across Canada’s largest urban regions.
Demographic Composition of the Biggest City in Canada 2025
| Demographic Category | Toronto Percentage | Toronto Population | National Comparison |
|---|---|---|---|
| Foreign-Born Population | 46.6% | 1,300,000+ | Highest in Canada |
| Visible Minorities | 55.7% | 1,550,000+ | Most diverse city |
| Asian Population | 34.81% | 961,325 | Largest in Canada |
| Age 65 and Over | 15.6% | 436,000+ | Below national average |
| Age 14 and Under | 14.5% | 405,000+ | Near national average |
| Median Age | 39.3 years | — | Younger than national average |
| Female Population | 52% | 1,453,000+ | Slightly above 50% |
| Male Population | 48% | 1,341,000+ | Slightly below 50% |
Data Source: Statistics Canada – 2021 Census and 2024 estimates
The demographic composition of the biggest city in Canada by population in 2025 reflects extraordinary diversity that distinguishes Toronto as one of the world’s most multicultural urban centers. The 46.6% foreign-born population represents one of the highest proportions among major global cities, exceeded only by Miami in North America. This means nearly half of all Toronto residents were born in another country and immigrated to Canada at some point in their lives. The visible minority population of 55.7% indicates that the majority of Toronto residents now identify as non-white, marking a historic demographic transition that reflects decades of immigration from Asia, Africa, Latin America, and the Middle East.
The Asian population of 34.81% or approximately 961,325 people makes Toronto home to the second-largest Asian population of any core North American city after New York. East Asians represent the largest subcategory at 33% of Toronto’s population, with substantial communities of Chinese, Filipino, Korean, and Japanese descent concentrated in neighborhoods like Markham, Scarborough, and North York. South Asians constitute approximately 28% of the population, including large Indian, Pakistani, Bangladeshi, and Sri Lankan communities that have established vibrant ethnic enclaves throughout the metropolitan area.
The age distribution in Toronto skews slightly younger than the Canadian national average, with a median age of 39.3 years compared to the national median of approximately 41 years. The proportion of residents aged 65 and over at 15.6% falls below the national average of around 19%, reflecting Toronto’s continued ability to attract younger workers and students from across Canada and around the world. However, the senior population is growing rapidly as the baby boom generation ages, creating increasing demands for healthcare services, long-term care facilities, and age-friendly urban design modifications.
Language and Cultural Diversity in Canada 2025
| Language/Cultural Indicator | Toronto | Montreal | Vancouver | National |
|---|---|---|---|---|
| English Mother Tongue | 60%+ | 15% | 50%+ | 56% |
| French Mother Tongue | 1% | 50%+ | 1% | 20.6% |
| Chinese Languages | 12%+ | 8% | 30%+ | 3.5% |
| Other Languages | 27% | 27% | 19% | 19.9% |
| Bilingual (English/French) | 10% | 60%+ | 7% | 18% |
| Multiple Languages Spoken | 85%+ | 70% | 75% | 65% |
| Number of Languages Spoken | 200+ | 100+ | 150+ | N/A |
Data Source: Statistics Canada – 2021 Census Language Data
The linguistic landscape of the biggest city in Canada by population in 2025 showcases remarkable diversity that extends far beyond the traditional English-French bilingualism that defines much of Canadian identity. While English remains the dominant language with over 60% of Toronto residents claiming it as their mother tongue, the city has evolved into a truly polyglot metropolis where more than 200 distinct languages are spoken across households throughout the metropolitan area. This extraordinary linguistic diversity reflects the city’s status as Canada’s primary destination for international immigrants, with newcomers arriving from virtually every country on the planet.
Chinese languages, including Mandarin, Cantonese, and various regional dialects, represent the second-most common linguistic group in Toronto at approximately 12% of the population, translating to more than 335,000 residents who grew up speaking Chinese as their first language. This substantial Chinese-speaking population has established thriving commercial districts in neighborhoods like Markham, Scarborough, and downtown Chinatown, where business signage, media outlets, and community services operate primarily in Chinese. The proportion of Chinese speakers in Vancouver is even more dramatic, exceeding 30% of that city’s population and making it the most Asian-influenced major city in North America outside of Hawaii.
The statistic showing 85% of Torontonians speaking multiple languages underscores how multilingualism has become the norm rather than the exception in Canada’s largest urban center. Many residents maintain fluency in their heritage languages while acquiring English proficiency necessary for education and employment. South Asian languages including Punjabi, Tamil, Urdu, Hindi, and Bengali collectively account for another significant portion of the linguistic mosaic, while European languages like Italian, Portuguese, Spanish, and Polish remain common among established immigrant communities. This multilingual environment creates both opportunities for international business and cultural exchange, as well as challenges for public service delivery in areas like healthcare, education, and legal services where language barriers can impede access.
Housing Market Dynamics in Canada 2025
| Housing Metric | Toronto | Montreal | Vancouver | Calgary |
|---|---|---|---|---|
| Average Home Price | $1,080,000 | $385,000 | $1,200,000 | $515,000 |
| Average Rent (1-Bedroom) | $2,400/month | $1,650/month | $2,800/month | $1,500/month |
| Rental Vacancy Rate | 1.5% | 2.8% | 0.9% | 4.5% |
| Price-to-Income Ratio | 11.3 | 5.1 | 12.8 | 6.2 |
| Housing Starts (2023) | 38,000 units | 22,000 units | 31,000 units | 18,000 units |
| Condo Price per Sq Ft | $1,100 | $450 | $1,300 | $375 |
| Detached Home Price | $1,700,000 | $650,000 | $2,100,000 | $750,000 |
Data Source: Canadian Real Estate Association, CMHC, and local real estate boards (2024 data)
The housing affordability crisis in the biggest city in Canada by population in 2025 has reached critical levels that threaten the metropolitan area’s long-term economic competitiveness and social sustainability. The average home price of $1,080,000 in Toronto represents more than triple the average price in Montreal and has placed homeownership completely out of reach for most young professionals, newcomers, and middle-income families. The price-to-income ratio of 11.3 means the typical Toronto home costs more than 11 times the median household income, far exceeding the historical norm of approximately 3 to 4 times income that characterized affordable housing markets.
The rental market presents equally challenging conditions, with the average one-bedroom apartment commanding $2,400 per month in rent, consuming approximately 60% of the gross monthly income for someone earning Ontario’s median wage. The rental vacancy rate of 1.5% indicates an extremely tight market where available units receive multiple applications within hours of listing, forcing many renters to compete by offering above-asking rent payments or multiple months of advance payment. This scarcity has pushed many residents into precarious housing situations, including overcrowding, illegal basement apartments, and extended commutes from distant suburban communities where housing remains somewhat more affordable.
Despite these astronomical prices, housing construction has failed to keep pace with population growth in the biggest city in Canada by population in 2025. The 38,000 housing units started in Toronto during 2023 fall dramatically short of the estimated 100,000 units needed annually to accommodate the metropolitan area’s population growth of approximately 270,000 people per year. This supply-demand imbalance has persisted for more than a decade, with restrictive zoning regulations, neighborhood opposition to density, lengthy approval processes, high development charges, and construction labor shortages all contributing to the chronic undersupply. Vancouver faces even more severe affordability challenges, with an average home price of $1,200,000 and a price-to-income ratio of 12.8 that ranks among the worst in the developed world.
Employment and Economic Sectors in Canada 2025
| Employment Sector | Toronto Jobs | Percentage of Total | Average Annual Salary | Growth Rate |
|---|---|---|---|---|
| Financial Services | 450,000 | 12% | $95,000 | 2.5% |
| Professional Services | 380,000 | 10% | $78,000 | 3.2% |
| Technology/IT | 320,000 | 8.5% | $92,000 | 5.8% |
| Healthcare | 280,000 | 7.5% | $68,000 | 3.8% |
| Manufacturing | 260,000 | 7% | $55,000 | 0.5% |
| Retail Trade | 240,000 | 6.4% | $35,000 | 1.2% |
| Construction | 210,000 | 5.6% | $62,000 | 4.5% |
| Education | 195,000 | 5.2% | $71,000 | 2.1% |
Data Source: Statistics Canada Labour Force Survey and industry estimates (2024)
The employment landscape in the biggest city in Canada by population in 2025 demonstrates a sophisticated, service-oriented economy dominated by high-value sectors including financial services, professional services, and technology. The 450,000 jobs in financial services include employment at Canada’s major banks, insurance companies, pension funds, investment firms, and fintech startups, consolidating Toronto’s status as the nation’s undisputed financial capital. This represents approximately 25% of all financial services employment in Canada concentrated within a single metropolitan area, creating a powerful cluster effect that attracts talent and investment from around the world.
The technology sector has emerged as one of the fastest-growing components of Toronto’s economy, with employment expanding at a 5.8% annual rate that outpaces most other industries. The 320,000 technology jobs span software development, artificial intelligence research, cybersecurity, data analytics, e-commerce, and digital media, reflecting Toronto’s evolution into one of North America’s leading tech hubs. Major technology companies including Google, Microsoft, Amazon, and Facebook have established significant Canadian operations primarily in Toronto, attracted by the city’s deep talent pool, relatively lower costs compared to Silicon Valley, and favorable immigration policies that facilitate recruitment of skilled international workers.
Healthcare employment of 280,000 jobs reflects both the size of Toronto’s population requiring medical services and the city’s role as a provincial and national center for specialized medical care, research hospitals, and biomedical innovation. Major institutions like University Health Network, Sunnybrook Health Sciences Centre, and SickKids Hospital employ thousands of physicians, nurses, technicians, and administrative staff while conducting cutting-edge medical research. The 3.8% growth rate in healthcare employment responds to both population aging and the ongoing need to recover from pandemic-related service backlogs.
Transportation and Mobility in Canada 2025
| Transportation Mode | Daily Trips (000s) | Mode Share (%) | Infrastructure Investment | Capacity Issues |
|---|---|---|---|---|
| Private Automobile | 5,200 | 55% | Highway expansion | Severe congestion |
| Public Transit | 2,800 | 30% | $28 billion projects | Overcrowding |
| Walking | 950 | 10% | Sidewalk improvements | Limited pedestrian infrastructure |
| Cycling | 285 | 3% | Bike lane expansion | Safety concerns |
| Rideshare/Taxi | 190 | 2% | Private sector | Traffic addition |
Data Source: Transportation Tomorrow Survey and City of Toronto Transportation Services (2023-2024)
Transportation challenges in the biggest city in Canada by population in 2025 represent one of the most pressing quality-of-life issues affecting residents and businesses throughout the metropolitan region. Despite decades of investment in public transit infrastructure, the private automobile remains the dominant transportation mode at 55% of all daily trips, contributing to severe traffic congestion that costs the regional economy an estimated $11 billion annually in lost productivity, wasted fuel, and delayed goods movement. The 5.2 million daily automobile trips overwhelm highway capacity during peak periods, with major routes like the 401, Gardiner Expressway, and Don Valley Parkway experiencing gridlock conditions that can extend commute times to multiple hours.
Public transit accounts for approximately 30% of daily trips or 2.8 million boardings across the Toronto Transit Commission subway, streetcar, and bus network, plus GO Transit regional rail and bus services. While this represents a higher transit mode share than most North American cities, the system operates at or beyond designed capacity during rush hours, with subway trains packed to uncomfortable density levels and buses frequently passing by waiting passengers due to lack of space. The region has embarked on an unprecedented $28 billion transit expansion program including four new subway projects, LRT lines, and GO Train electrification, but these projects face construction delays and won’t reach completion until the late 2020s or early 2030s.
The cycling mode share of 3% or approximately 285,000 daily bike trips has grown substantially over the past decade as the city has invested in protected bike lane infrastructure and cycling advocacy has strengthened. However, Toronto’s cycling infrastructure remains fragmented, with protected lanes concentrated in downtown areas while many suburban neighborhoods lack safe cycling routes. The relatively low 10% walking mode share reflects Toronto’s suburban sprawl patterns, with many residential areas located beyond comfortable walking distance from employment centers, shopping, and services.
Education and Research Institutions in Canada 2025
| Education Category | Number of Institutions | Student Enrollment | International Students | Research Funding |
|---|---|---|---|---|
| Universities | 4 major | 200,000+ | 85,000 | $1.5 billion |
| Colleges | 3 major | 85,000+ | 32,000 | $85 million |
| Elementary/Secondary Schools | 850+ | 580,000 | Limited | N/A |
| Private Schools | 300+ | 40,000 | 8,000 | N/A |
| Research Hospitals | 15 major | N/A | N/A | $800 million |
Data Source: University websites, Statistics Canada, and Ministry of Education data (2024)
The educational infrastructure supporting the biggest city in Canada by population in 2025 encompasses a comprehensive network of institutions ranging from elementary schools to world-class research universities that serve both the local population and attract students from across the globe. The four major universities—University of Toronto, York University, Toronto Metropolitan University (formerly Ryerson), and OCAD University—collectively enroll more than 200,000 students, making Toronto one of North America’s largest centers of higher education. The University of Toronto alone ranks consistently among the top 25 universities globally and conducts groundbreaking research in fields including artificial intelligence, medicine, engineering, and social sciences.
The 85,000 international students enrolled in Toronto universities represent a substantial economic and demographic force, contributing an estimated $4.5 billion annually to the local economy through tuition fees, accommodation, living expenses, and related spending. These students come predominantly from China, India, Iran, South Korea, and France, seeking Canadian credentials, potential pathways to permanent residency, and exposure to the multicultural environment that Toronto provides. However, recent federal policy changes announced in late 2024 have imposed caps on international student admissions and restricted off-campus work permissions, potentially reducing international enrollment in the coming years.
The 850 elementary and secondary schools serving approximately 580,000 students face significant overcrowding pressures in many neighborhoods experiencing rapid population growth. School boards have struggled to build new facilities quickly enough to keep pace with residential development, particularly in suburban areas where developers have constructed thousands of new homes without corresponding educational infrastructure. The 300 private schools enrolling approximately 40,000 students provide alternatives for families seeking specialized curricula, religious education, or smaller class sizes, though the relatively high tuition fees of $15,000 to $40,000 annually make private education accessible only to upper-income households.
Environmental and Sustainability Challenges in Canada 2025
| Environmental Indicator | Current Status | Target | Gap | Impact |
|---|---|---|---|---|
| Greenhouse Gas Emissions | 15 million tonnes CO2e | 12 million tonnes (2030) | 20% reduction needed | Climate contribution |
| Green Space per Capita | 13 m² per person | 28 m² WHO standard | 54% below standard | Quality of life |
| Tree Canopy Coverage | 27% | 40% by 2050 | 13% increase needed | Urban heat |
| Waste Diversion Rate | 52% | 70% by 2026 | 18% gap | Landfill pressure |
| Energy Use per Capita | 68 GJ/year | 50 GJ/year target | 26% reduction needed | Resource consumption |
| Water Consumption | 274 liters/day | 200 liters/day | 27% reduction needed | Water stress |
Data Source: City of Toronto Environmental Performance Reports and Statistics Canada (2023-2024)
Environmental sustainability challenges in the biggest city in Canada by population in 2025 have intensified as rapid population growth places increasing pressure on natural resources, green spaces, and climate change mitigation efforts. The metropolitan area generates approximately 15 million tonnes of CO2 equivalent emissions annually, making Toronto one of Canada’s largest sources of greenhouse gas emissions despite per-capita emission rates that rank below national averages. Transportation represents the single largest source of emissions at approximately 36% of the total, followed by buildings at 32%, reflecting the city’s automobile-dependent suburban development patterns and the heating/cooling demands of its large building stock.
The green space per capita of 13 square meters per person falls dramatically short of the World Health Organization recommended standard of 28 square meters, placing Toronto among the lowest-ranked major cities in North America for parkland availability. This scarcity has worsened as intensification concentrates development in already-dense neighborhoods where acquiring additional parkland faces prohibitive costs. The 27% tree canopy coverage provides important environmental benefits including air quality improvement, stormwater management, and urban heat island mitigation, but falls well below the city’s ambitious target of 40% coverage by 2050. Achieving this target will require protecting existing trees, planting hundreds of thousands of new trees, and modifying development regulations to preserve mature trees during construction.
The waste diversion rate of 52% indicates that approximately half of all solid waste generated in Toronto gets diverted from landfills through recycling, composting, and other programs, while the remainder continues to be sent to disposal facilities. The city has set an ambitious target of 70% diversion by 2026, but achieving this goal will require significant behavioral changes, expanded programs for difficult-to-recycle materials, and potentially controversial measures like mandatory waste audits or disposal fees. Water consumption of 274 liters per capita per day exceeds the target of 200 liters, though Toronto’s consumption rates remain lower than many comparable North American cities, benefiting from relatively efficient fixtures and water conservation campaigns.
Healthcare System and Public Health in Canada 2025
| Healthcare Metric | Toronto | Ontario Average | National Average | Challenges |
|---|---|---|---|---|
| Hospital Beds per 1,000 | 2.5 | 2.3 | 2.5 | Below OECD average (4.7) |
| Physicians per 100,000 | 285 | 245 | 241 | Uneven distribution |
| Average ER Wait Time | 3.8 hours | 4.2 hours | 4.0 hours | Capacity pressures |
| Family Doctor Access | 88% | 85% | 83% | Growing gap |
| Mental Health Services | Limited capacity | Insufficient | Underfunded | Access barriers |
| Healthcare Spending | $8,500 per capita | $8,200 | $8,019 | Rising costs |
Data Source: Canadian Institute for Health Information and Ontario Ministry of Health (2023-2024)
Healthcare system capacity in the biggest city in Canada by population in 2025 faces mounting pressures from rapid population growth, an aging demographic, and lingering impacts from the COVID-19 pandemic that have created substantial backlogs in elective procedures and routine care. The 2.5 hospital beds per 1,000 population available in Toronto matches the national Canadian average but falls significantly below the OECD average of 4.7 beds per 1,000, indicating that Canadian healthcare capacity generally lags behind comparable developed nations. Major Toronto hospitals including Toronto General, Mount Sinai, and Sunnybrook routinely operate at or beyond 100% capacity, forcing patients to wait in emergency departments for inpatient beds and resulting in periodic hallway medicine situations.
The physician density of 285 doctors per 100,000 population places Toronto above provincial and national averages, reflecting the city’s concentration of medical schools, teaching hospitals, and specialist practices that attract physicians from across Canada and internationally. However, this relatively favorable physician-to-population ratio masks significant geographic disparities, with downtown and affluent neighborhoods enjoying abundant medical services while some suburban areas, particularly in the inner suburbs, face shortages of family doctors and specialists. The 88% of Toronto residents who report having access to a regular family doctor exceeds provincial and national averages, but the 12% without a family physician represents approximately 335,000 people who rely on walk-in clinics or emergency departments for primary care.
Emergency department wait times averaging 3.8 hours in Toronto hospitals fall slightly below provincial averages but remain a source of frustration for patients requiring urgent care. These lengthy waits reflect overcrowding driven by patients who lack family doctors, insufficient community mental health and addiction services forcing people into crisis situations, and bed shortages that prevent admitted patients from moving out of the ER. Mental health services face particularly severe capacity constraints, with wait times of several months to over a year for specialized psychiatric care, minimal publicly-funded psychotherapy options, and inadequate crisis intervention services that have contributed to rising homelessness and addiction-related deaths.
Cultural and Recreational Amenities in Canada 2025
| Amenity Category | Number in Toronto | Annual Visitors/Users | Economic Impact | Accessibility |
|---|---|---|---|---|
| Museums and Galleries | 50+ major | 8 million+ | $600 million | Concentrated downtown |
| Professional Sports Teams | 7 major league | 4 million attendance | $1.2 billion | High ticket prices |
| Performing Arts Venues | 200+ | 5 million | $800 million | Varied accessibility |
| Public Libraries | 100 branches | 33 million visits | Community resource | Well distributed |
| Parks and Recreation | 1,500+ parks | Year-round use | Quality of life | Uneven distribution |
| Festivals and Events | 100+ annual | 20 million+ attendees | $2 billion | Mostly free |
Data Source: City of Toronto, Tourism Toronto, and various cultural institutions (2023-2024)
The cultural vitality of the biggest city in Canada by population in 2025 represents one of its most distinctive attributes, with an extraordinary concentration of world-class museums, performing arts venues, sports facilities, and festivals that enhance quality of life for residents while attracting millions of tourists annually. The 50 major museums and galleries include internationally renowned institutions like the Royal Ontario Museum, Art Gallery of Ontario, Aga Khan Museum, and Gardiner Museum, which collectively welcome more than 8 million visitors annually and contribute an estimated $600 million to the local economy through direct spending, employment, and related tourism activity.
Professional sports occupy a prominent place in Toronto’s cultural landscape, with the city hosting seven major league professional teams including the Toronto Raptors (NBA), Toronto Maple Leafs (NHL), Toronto Blue Jays (MLB), Toronto FC (MLS), Toronto Argonauts (CFL), Toronto Rock (NLL), and Toronto Defiant (OWL). These teams attract approximately 4 million spectators annually to games and generate an estimated $1.2 billion in direct and indirect economic impact. However, ticket prices for major events, particularly NHL and NBA games, have escalated to levels that make live attendance prohibitively expensive for many middle-income families, with average Maple Leafs tickets exceeding $250 and playoff tickets commanding prices in the thousands of dollars.
The 1,500 parks spread across Toronto’s 630 square kilometers provide essential recreational opportunities, though distribution remains uneven with some neighborhoods enjoying abundant green space while others, particularly in the inner suburbs, face parkland deficits. The Toronto Public Library system’s 100 branches serve as crucial community gathering places, offering not only books but also computer access, meeting spaces, language learning programs, and social services referrals that are especially valuable for newcomers and lower-income residents. The 100+ annual festivals including Caribbean Carnival, Pride Toronto, TIFF (Toronto International Film Festival), and Nuit Blanche bring communities together and reinforce Toronto’s brand as a diverse, vibrant city, with most major festivals offering free admission that ensures broad accessibility.
Disclaimer: This research report is compiled from publicly available sources. While reasonable efforts have been made to ensure accuracy, no representation or warranty, express or implied, is given as to the completeness or reliability of the information. We accept no liability for any errors, omissions, losses, or damages of any kind arising from the use of this report.